Turn bullish positions into bearish positions in a single transaction.
In this webinar, market wizard Tony Saliba shows you how to take advantage of the flexibility of trading options by… more
Turn bullish positions into bearish positions in a single transaction.
In this webinar, market wizard Tony Saliba shows you how to take advantage of the flexibility of trading options by… more
Day trading futures outright is one of the most difficult forms of speculation with little room for error, generally high leverage, and fierce competition.
Watch this webinar to hear Carley… more
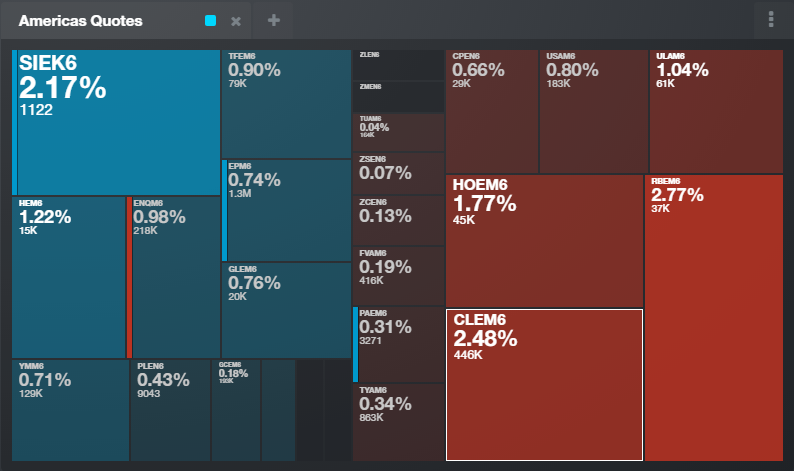
In our release last month of version 2.1, we focused on improvements to CQG M on the phone. This month, these exciting features for desktops are ready in version 2.2, available on mdemo.cqg.… more
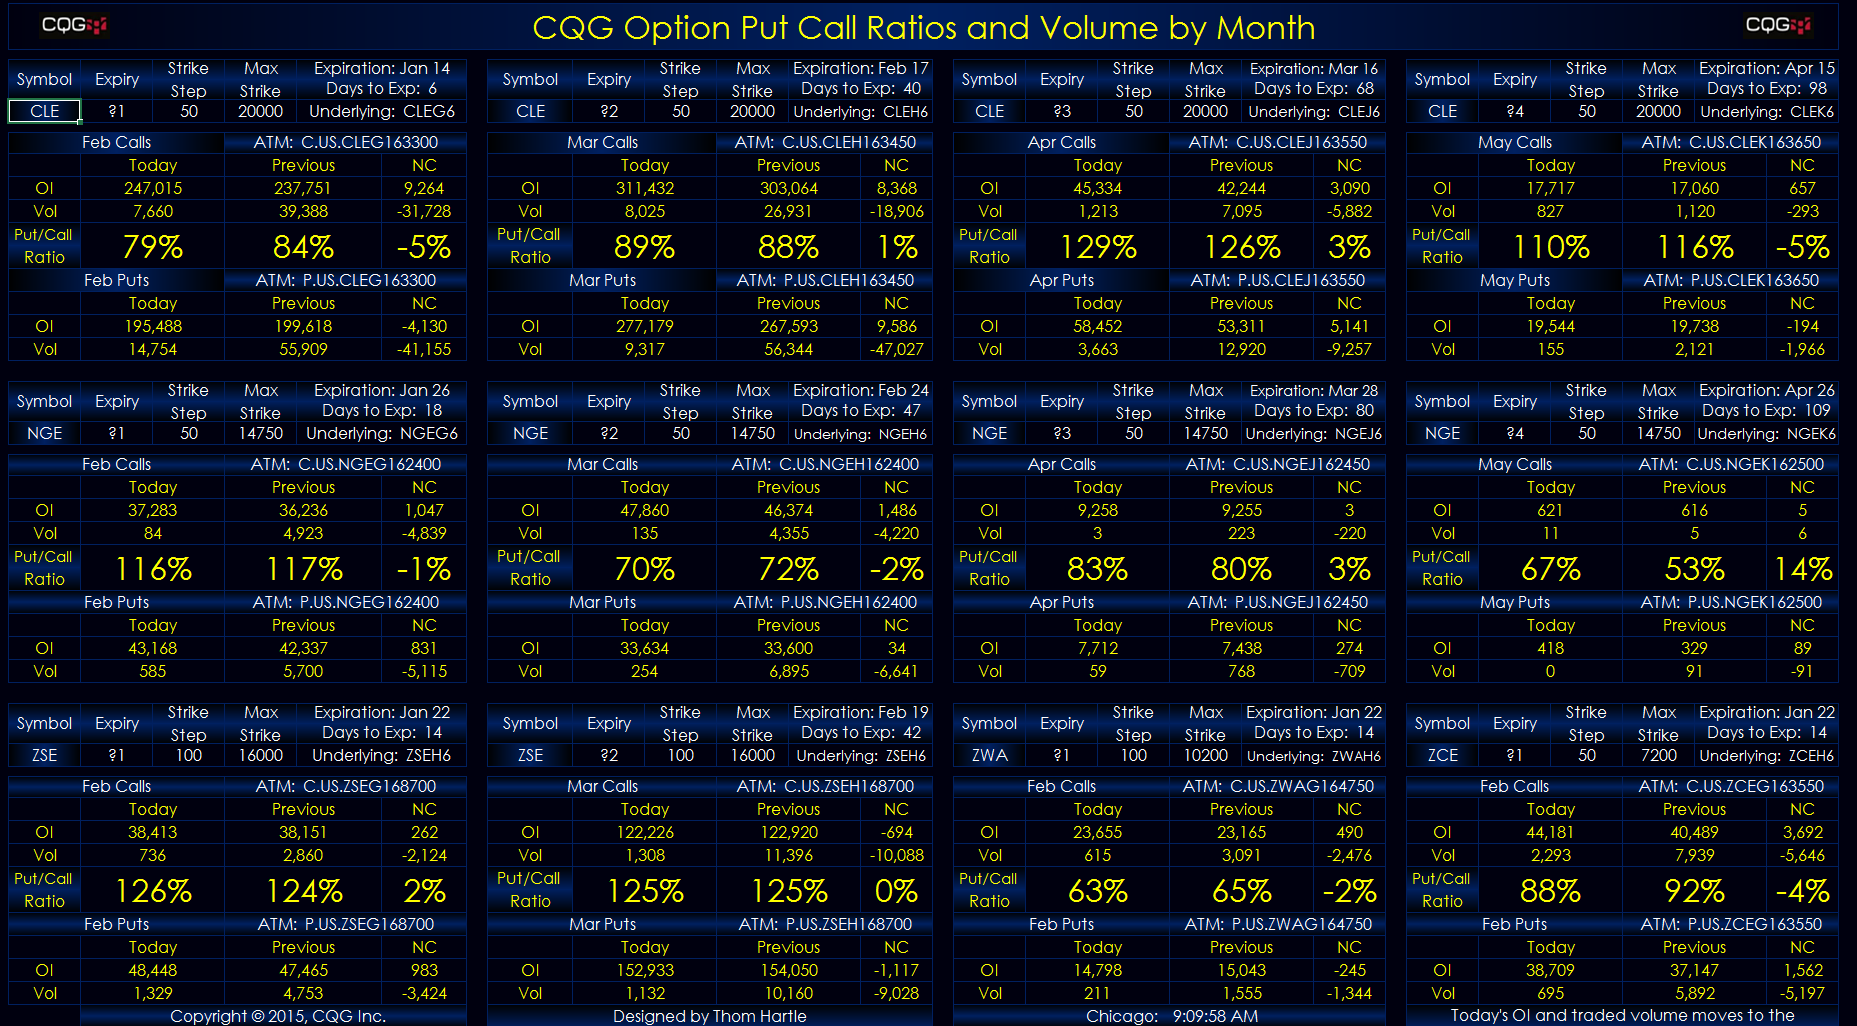
This Microsoft Excel® dashboard displays today’s open interest and traded volume for all of the strikes by month for both call and put options on futures. In addition, the current put/call ratio… more

This Microsoft Excel® dashboard uses the CQG RTD OptVal formula to calculate implied volatility, theoretical value, delta, and the Greeks using data inputs from other RTD formulas.
… more
You can use Microsoft Excel® and data from CQG to expand the features of your own market display dashboards. This powerful combination can be tailored to your specific needs. This article shows… more

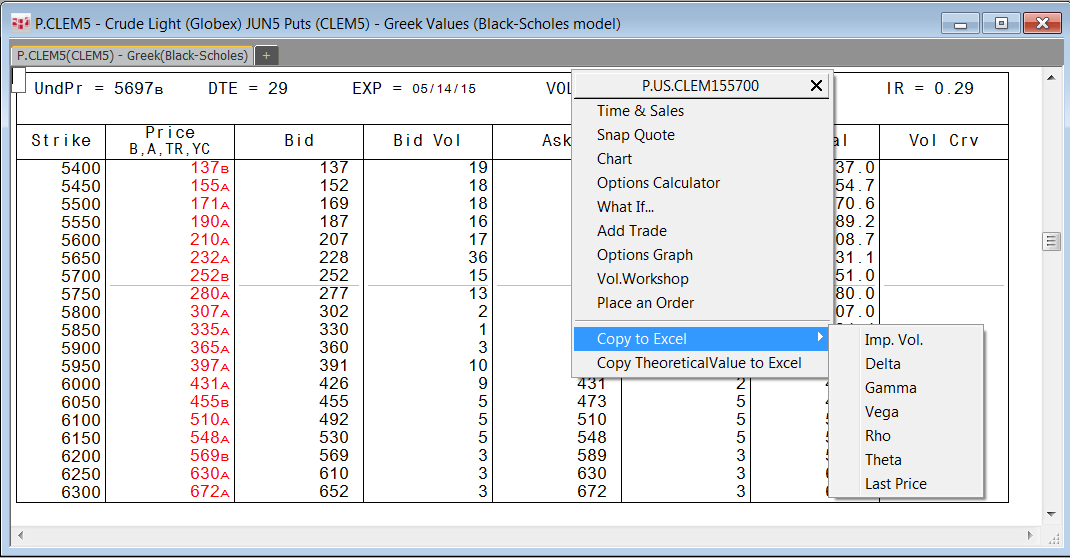
Options offer a wide variety of strategies for traders. CQG provides a powerful options analytics package. A number of the analytics tools, such as theoretical value, implied volatility, and the… more

This Microsoft Excel® dashboard displays the current crude oil options market ranked by the time of the last trade. It has two columns for two different expiry months. There are two tabs where you… more

See how long-time trader Jeanette Young day-trades the Russell 2000 futures contract.
Also known as the Options Queen, Ms. Young presented her daily trading preparation and CQG Integrated… more

In this webinar, Carley Garner shows you how to determine when to sell options using volatility to find… more