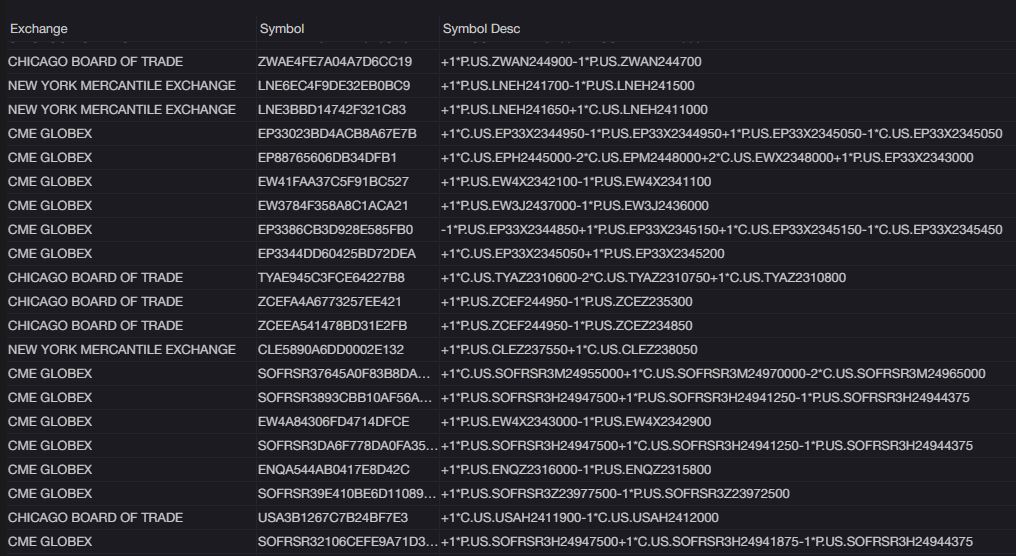
CQG One provides an "Active RFQ" widget. A Request for Quote (RFQ) is functionality provided for traders to access electronic quotes on multi-leg options strategies. It is an electronic message… more
Options
CQG IC and QTrader offer two studies that track volatility: Implied Volatility and Historical Volatility. This post details each study and provides an Excel spreadsheet for tracking the two.
… more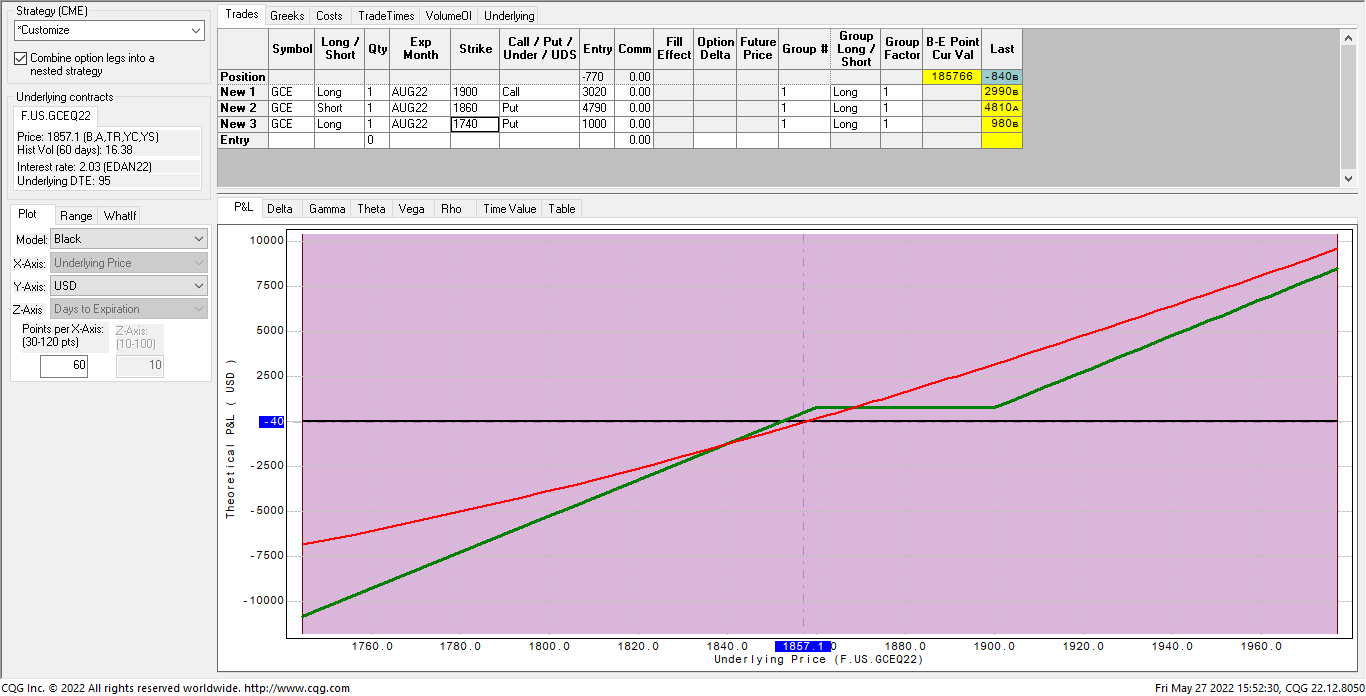
Over the past few weeks, I’ve asked several options pros with over forty years’ experience about a specific options strategy that I developed for speculators which has limited downside risk and… more
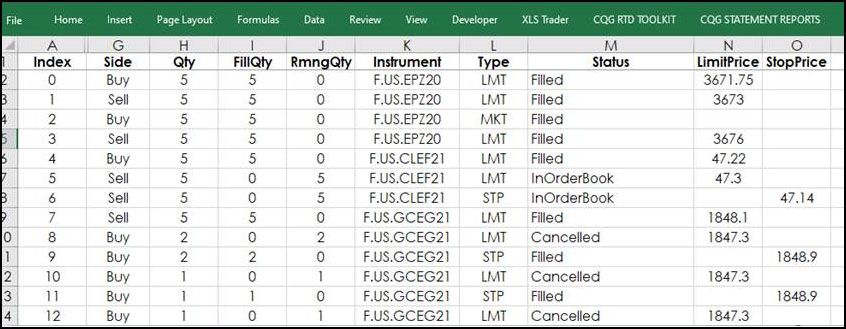
The CQG RTD Toolkit Add-in has been updated. This updated Excel add-in is automatically installed with CQG IC 21-12-8042 Beta and higher. The updates are to the Orders and Positions… more
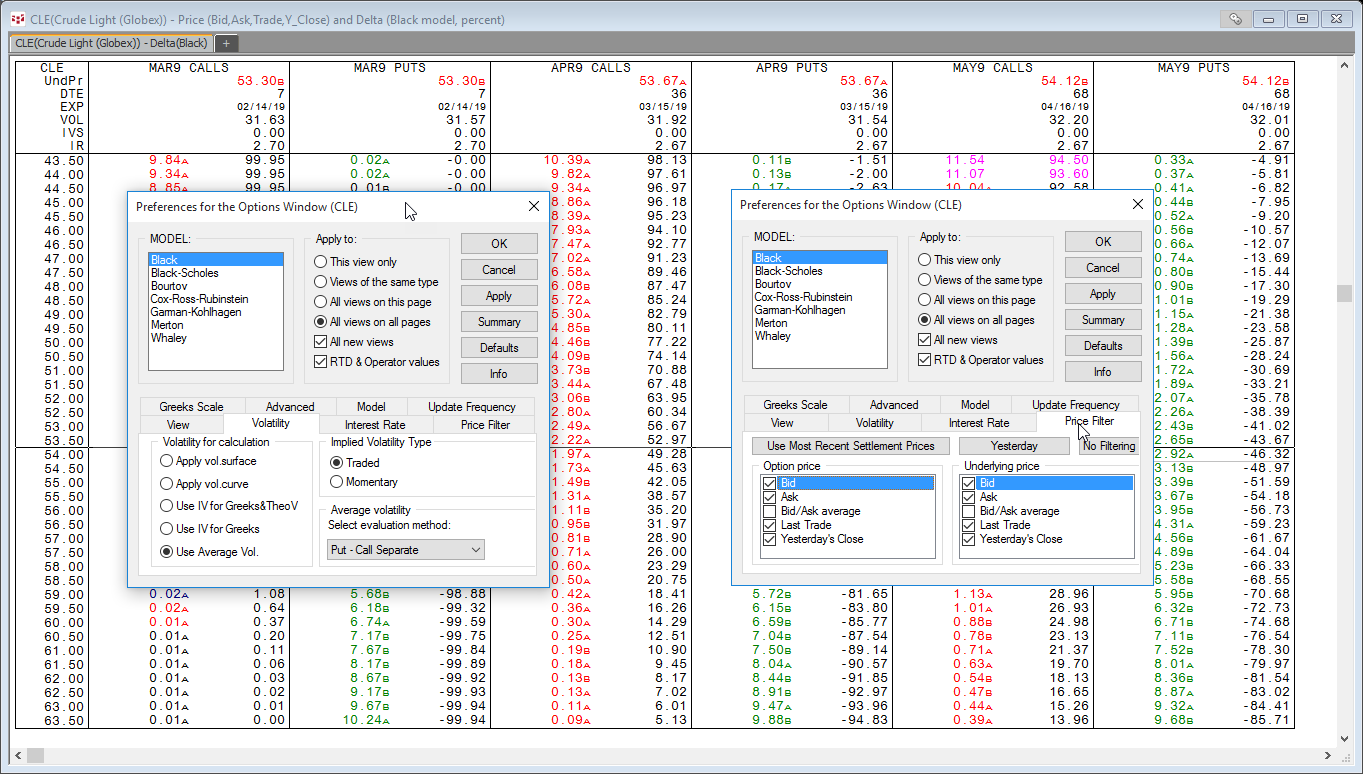
If you set up a Microsoft Excel® dashboard to monitor options prices and their respective deltas you may see the delta values disappear occasionally in the dashboard. In other words, the value for… more
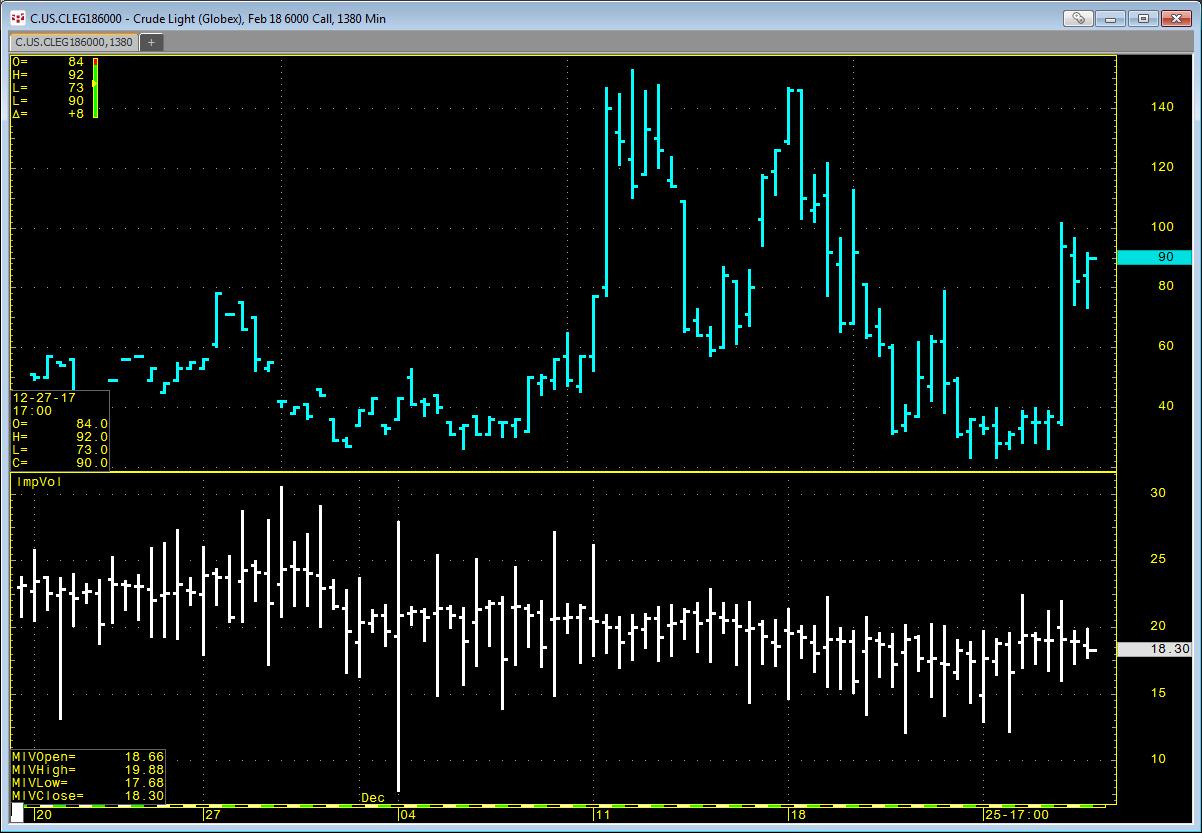
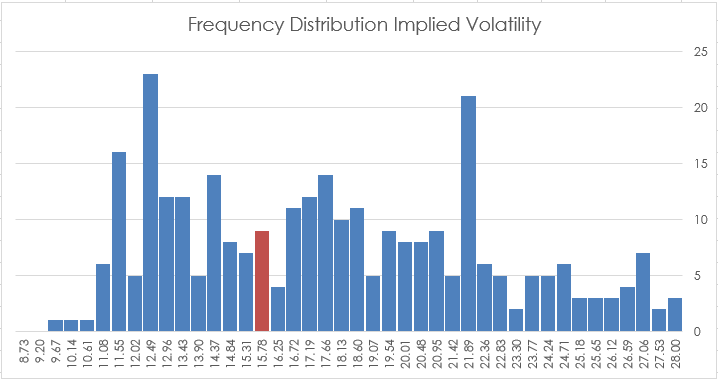
CQG offers an Implied Volatility (ImpVol) study that allows you to pull in historical implied volatility data onto a chart. ImpVol is not the implied volatility of one particular option.… more
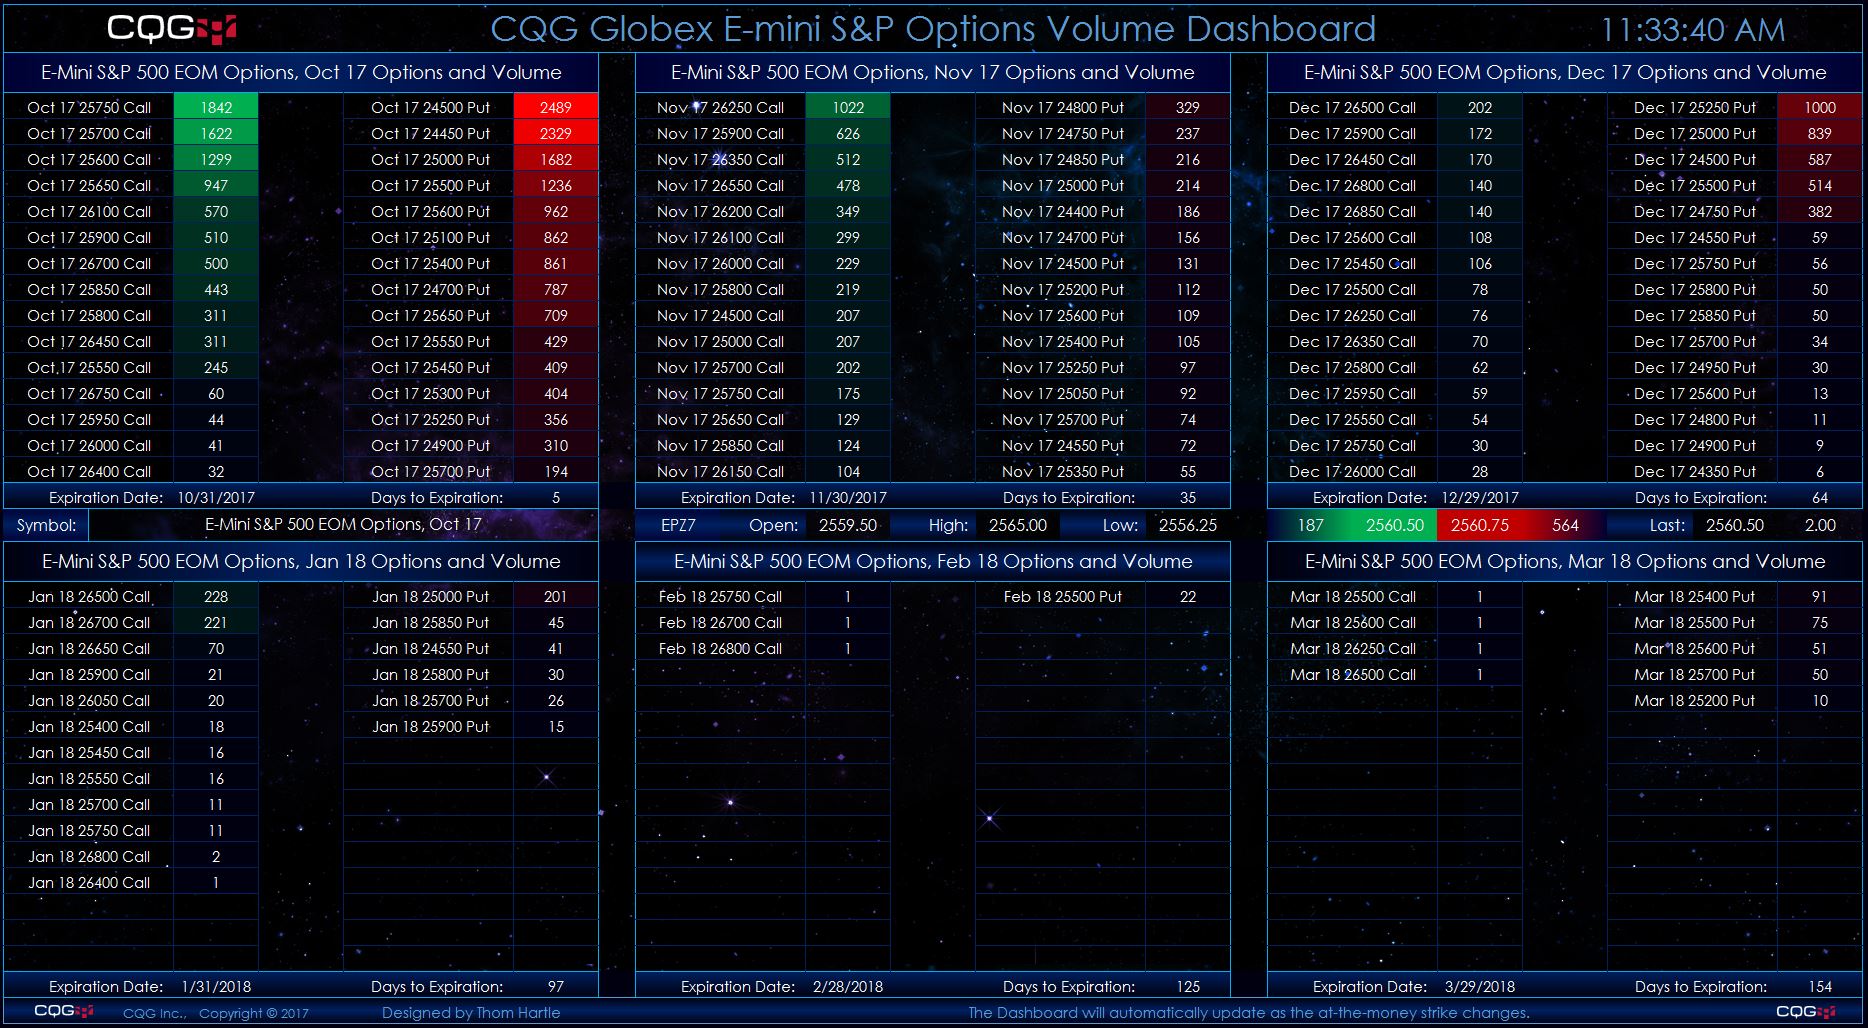
This Microsoft Excel® dashboard scans options on the E-mini S&P 500 futures market using the CQG RTD Toolkit for volume and displays strikes ranked by the volume traded for each listed expiry… more

Watch our recorded webinar to learn about the following services that CQG Integrated Client customers can access for free through the end of the year:
Market Scan Advanced OptionsOur… more
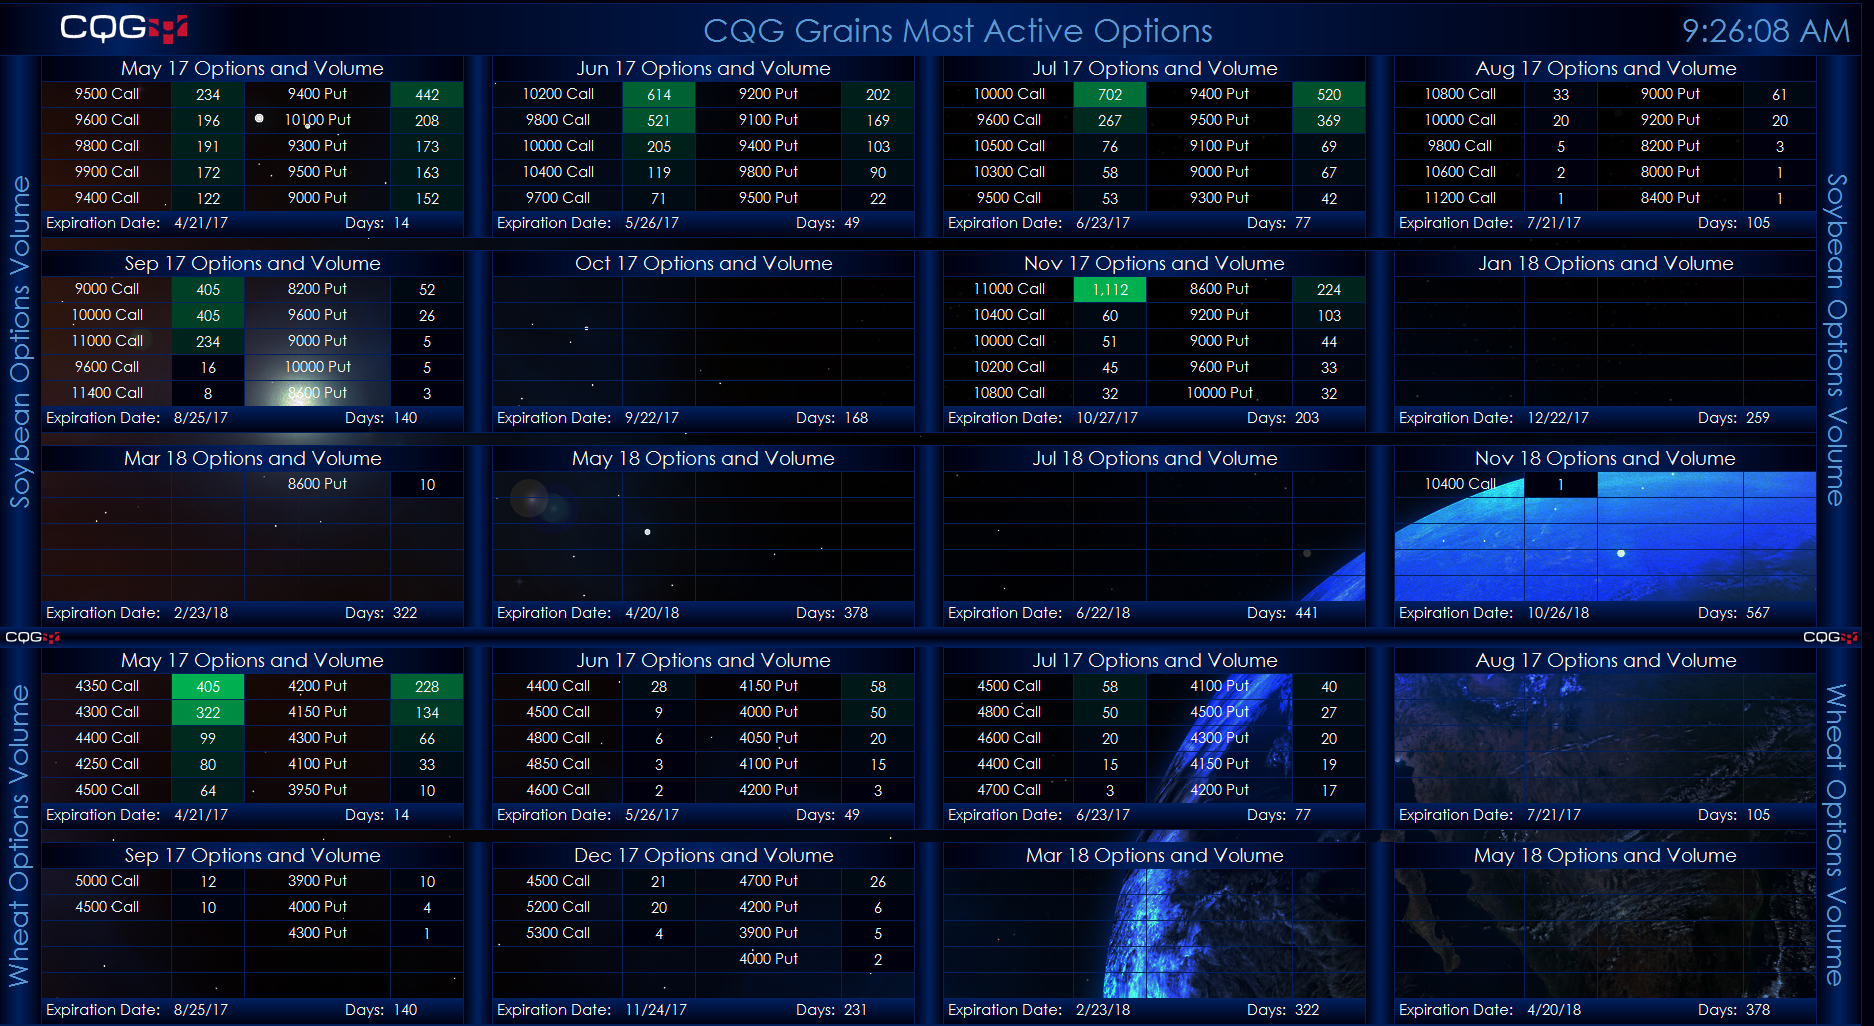
This Microsoft Excel® dashboard scans the options on soybeans, wheat, and corn (Globex) futures markets for volume. It displays strikes ranked by the volume traded for each expiry listed… more
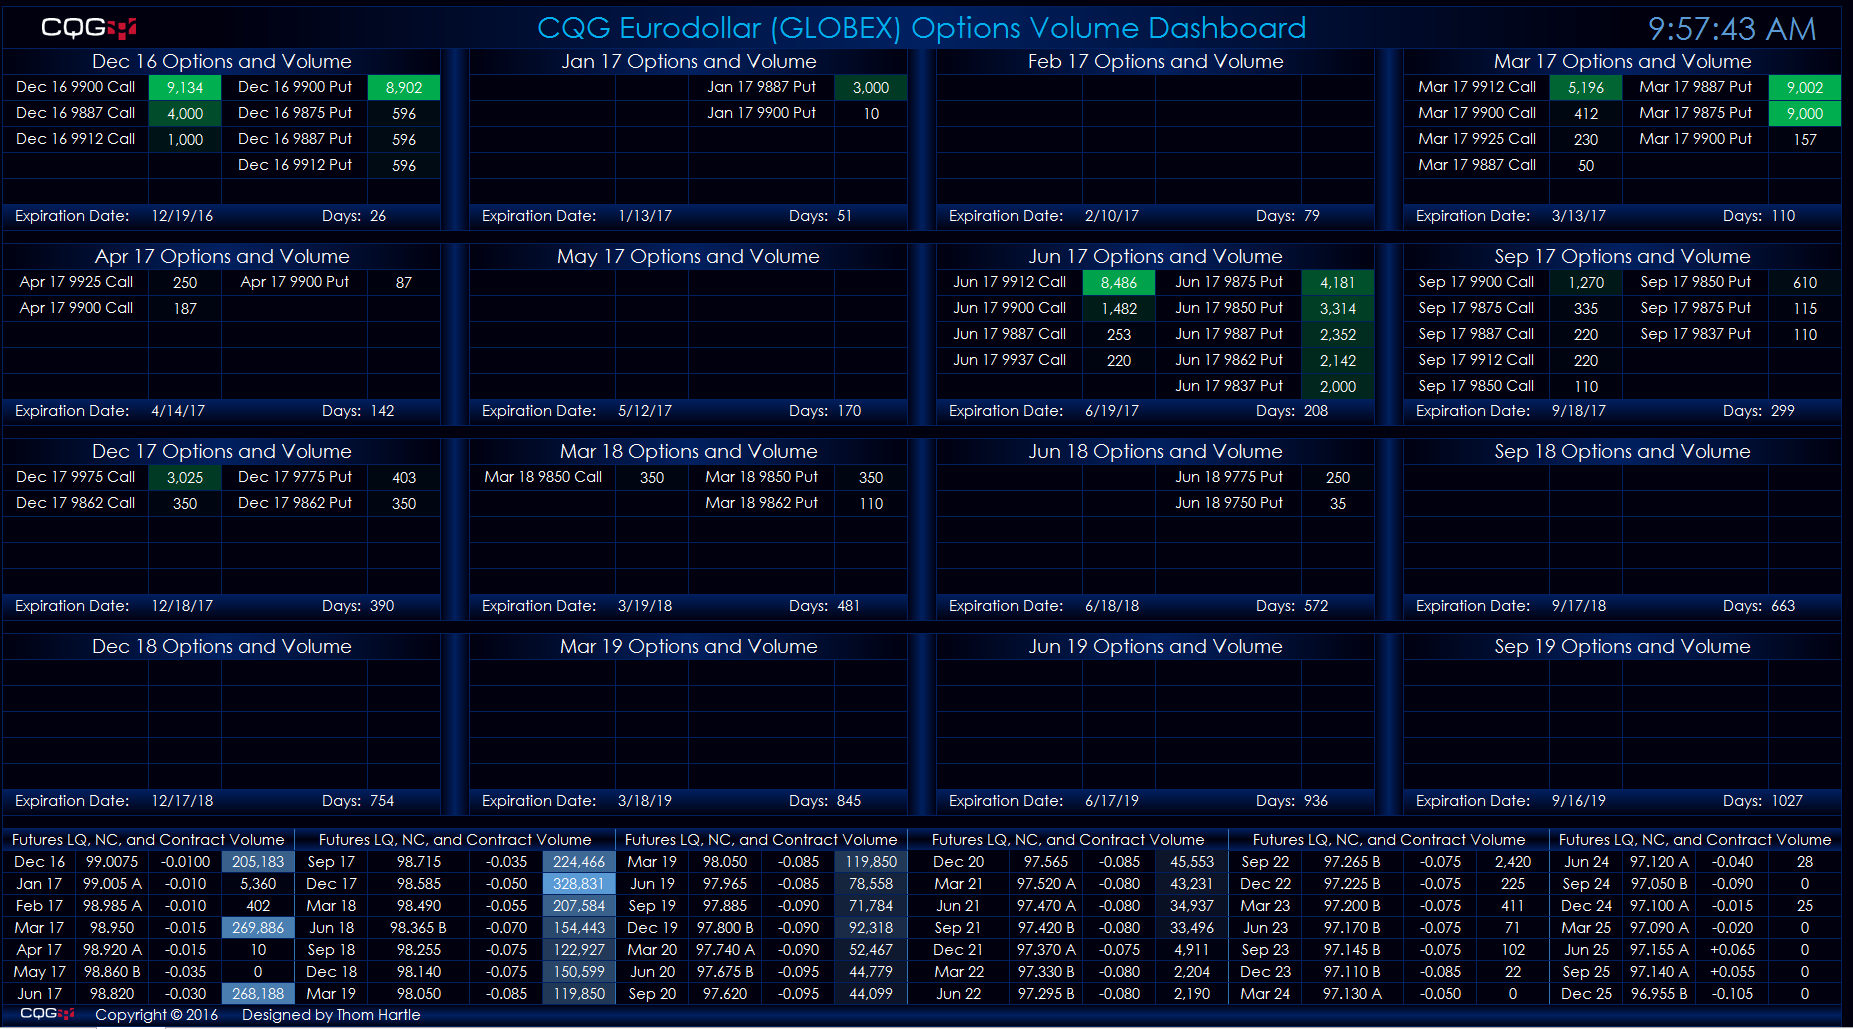
This Microsoft Excel® dashboard scans the options on the Eurodollar futures market for volume and ranks the traded volume for each expiry out to three years. The scan covers options traded ten… more