This article builds upon the post titled “Evaluate ETF Constituents Performance Using Excel” that detailed gauging the current price of a stock relative to the high as an indication of relative weakness and a table was included that demonstrated that if a stock was down, say, 50% from its annual high then it required a 100% gain to return to the annual high. The formula was simple: (Last Price minus Annual High)/Annual High.
However, if we simply calculate the difference between the annual high and the last price but divide by the last price, then we know what the required percentage gain: (Annual High minus Last Price)/ Last Price.
For example, Last Price = 80, Annual High is 100 then (100-80)/80 = 25%. Last price is down 20% and the stock has to advance by 25% to return to 100.
The original post used: (80-100)/100 = -20%. Knowing what the required gain to return to the annual high seems to be more valuable information. In addition, we can analyze for the required loss to match the annual lows.
There are two downloadable spreadsheets: CQGSampleHighLow.xlsx and CQGQQQHighLow.xlsm.
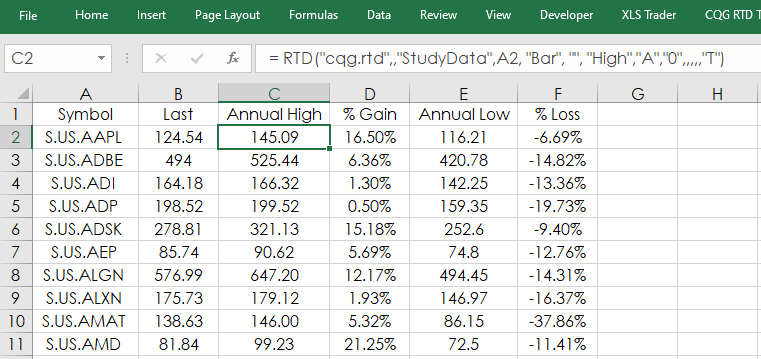
The sample spreadsheet gives you a simple set of RTD formulas for the calculations.
The QQQ Analysis Dashboard has a number features. First, along the bottom is the entire list of securities held by the ETF in alphabetical order. The blue histogram bars indicate the percentage gain required to match the annual high and the red histogram bars indicate the percentage loss required to match the annual low.
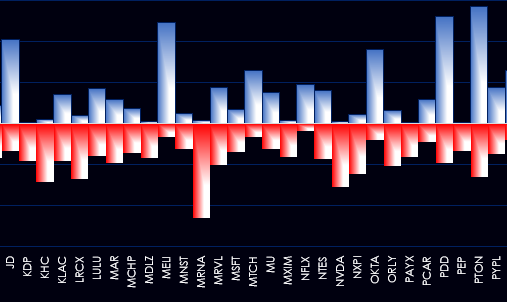
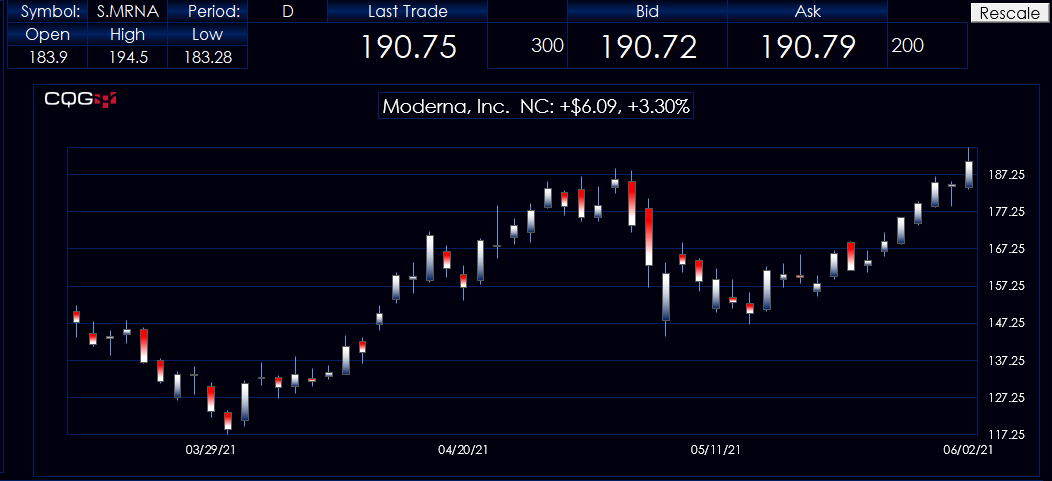
Small blue histogram bars indicate the last price is close to the annual high. Large red histogram bars indicate the last price is well above the annual low. For example, as of this writing Moderna (symbol: MRNA) last price is very near the annual high and well above the annual low.
Further analysis of the stocks in the QQQ ETF is frequency distribution of the relationship between the last price and the annual high.
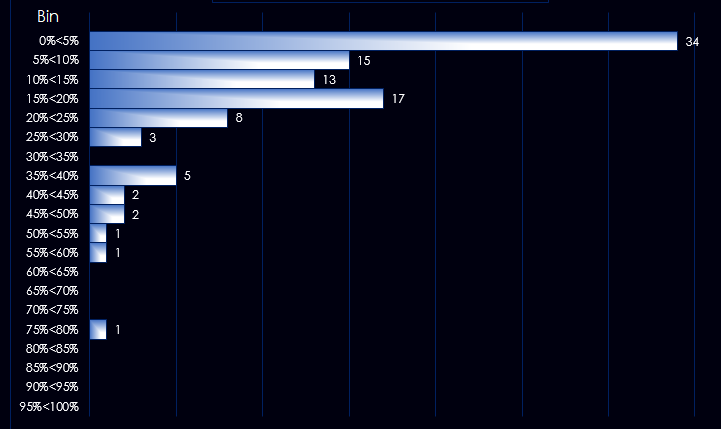
The above chart is showing that 34 stocks are just under 5% from their annual highs, 15 stocks are 5% up to but less than 10% from their annual highs, 13 stocks are 10% up to but less than 15% from their annual highs, etc.
Finally, you can enter a symbol and a time frame (period) for the last 55 bars of price action. Excel does not always scale a chart efficiently, so once you see the stock’s name in the chart then hit “Refresh”.
Requires CQG Integrated Client or QTrader and exchange enablements. Strongly recommended: Microsoft Office Professional Excel 2016, 2019, 32 or 64-bits installed on your computer, not in the Cloud.