Excel 365 includes the SORT and SORTBY functions which provide users with a simple way to dynamically sort data on a real-time basis. A common use would be to dynamically sort market performance by percentage net change using RTD calls to highlight the leaders and laggards in a group of markets, such as a group of equities.
Below is an explanation of the SORT function from Microsoft's Help file.
=SORT(array,[sort_index],[sort_order],[by_col])
| Argument | Description |
|---|---|
| array Required | The range, or array to sort |
| [sort_index] Optional | A number indicating the row or column to sort by |
| [sort_order] Optional | A number indicating the desired sort order; 1 for ascending order (default), -1 for descending order |
| [by_col] Optional | A logical value indicating the desired sort direction; FALSE to sort by row (default), TRUE to sort by column |
For example, below is an image from the downloadable Excel sample where the various S&P Sectors are sorted by percent net change.
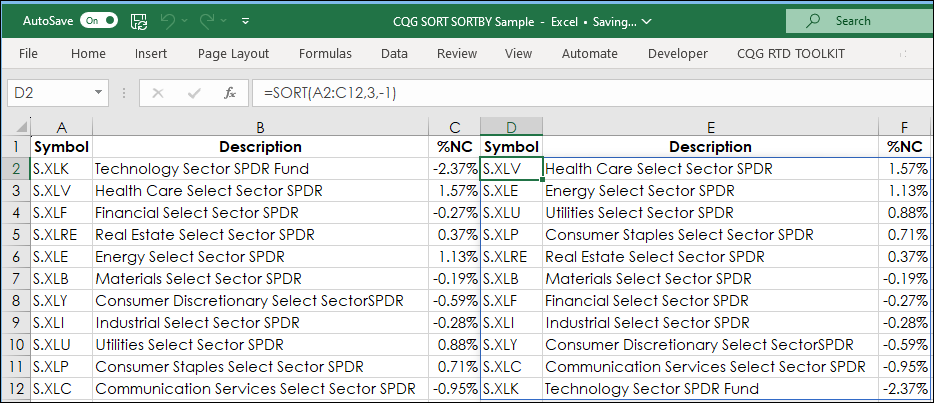
To use the function SORT, here in cell D2 was entered =SORT(and then cells A2 to C12 were selected, then comma, then 3 (as this is the column to sort by), then comma, then -1 for Descending and then close parenthesis:
=SORT(A2:C12,3,-1)
Then hit enter and the array is automatically redisplayed and is sorted. You do not have to enter this formula as an array. And, if you want to change to ascending order then return to cell D2 and change -1 to 1.
SORTBY enables you to perform multiple sorting by different columns.
Below is an explanation of the SORTBY function from Microsoft's Help file.
=SORTBY(array, by_array1, [sort_order1], [by_array2, sort_order2],…)
| Argument | Description |
|---|---|
| array Required | The array or range to sort |
| by_array1 Required | The array or range to sort on |
| [sort_order1] Optional | The order to use for sorting. 1 for ascending, -1 for descending. Default is ascending. |
| [by_array2] Optional | The array or range to sort on |
| [sort_order2] Optional | The order to use for sorting. 1 for ascending, -1 for descending. Default is ascending. |
The SORTBY function is very useful for sorting by multiple columns in a certain order. For example, the image below is listing the symbol in column A, the description in column B, the percent net change in column C, and the S&P Sector in column D.
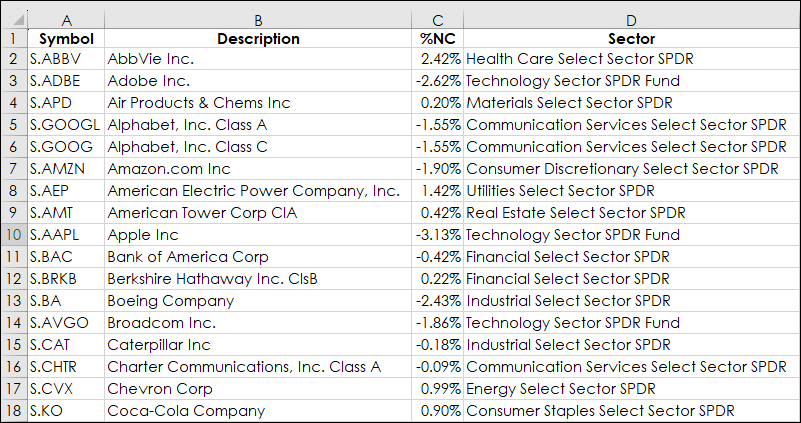
The market data is the 11 S&P Sectors and the top five holdings for each sector as of December 29, 2023. Let's say that the requirement is to sort the data by sectors first, and then sort the data by percent net change. In Cell E2 is the following formula:
=SORTBY(A2:D57,D2:D57,1,C2:C57,-1)
This formula uses the array A2:D57, and the column to sort is D2:D57 (Sector), and the 1 is to sort using ascending values, in this case alphabetically. Next, the additional column to sort based on C2:57 and the -1 is to sort using descending values. The result is displayed below.
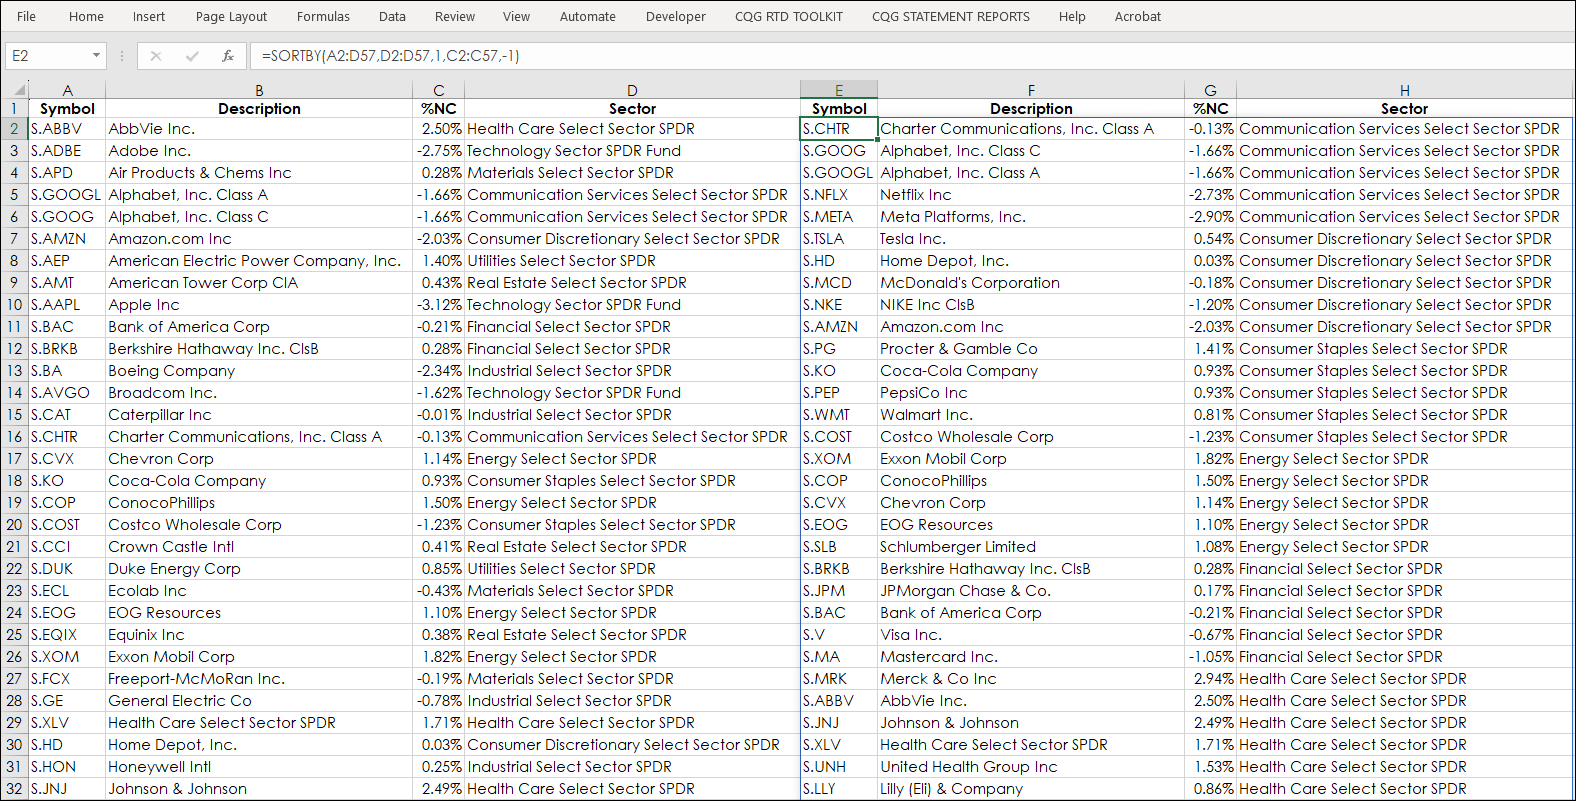
The data is first sorted by sector and then the top five stocks by percentage holding in the sector is sorted by percent net change. Again, you do not have to enter the SORTBY function as an array.
These two new functions in Excel 365 are valuable tools for traders using RTD and Excel.
Requirements: CQG Integrated Client or QTrader, and Excel 365 (locally installed, not in the Cloud) or more recent.