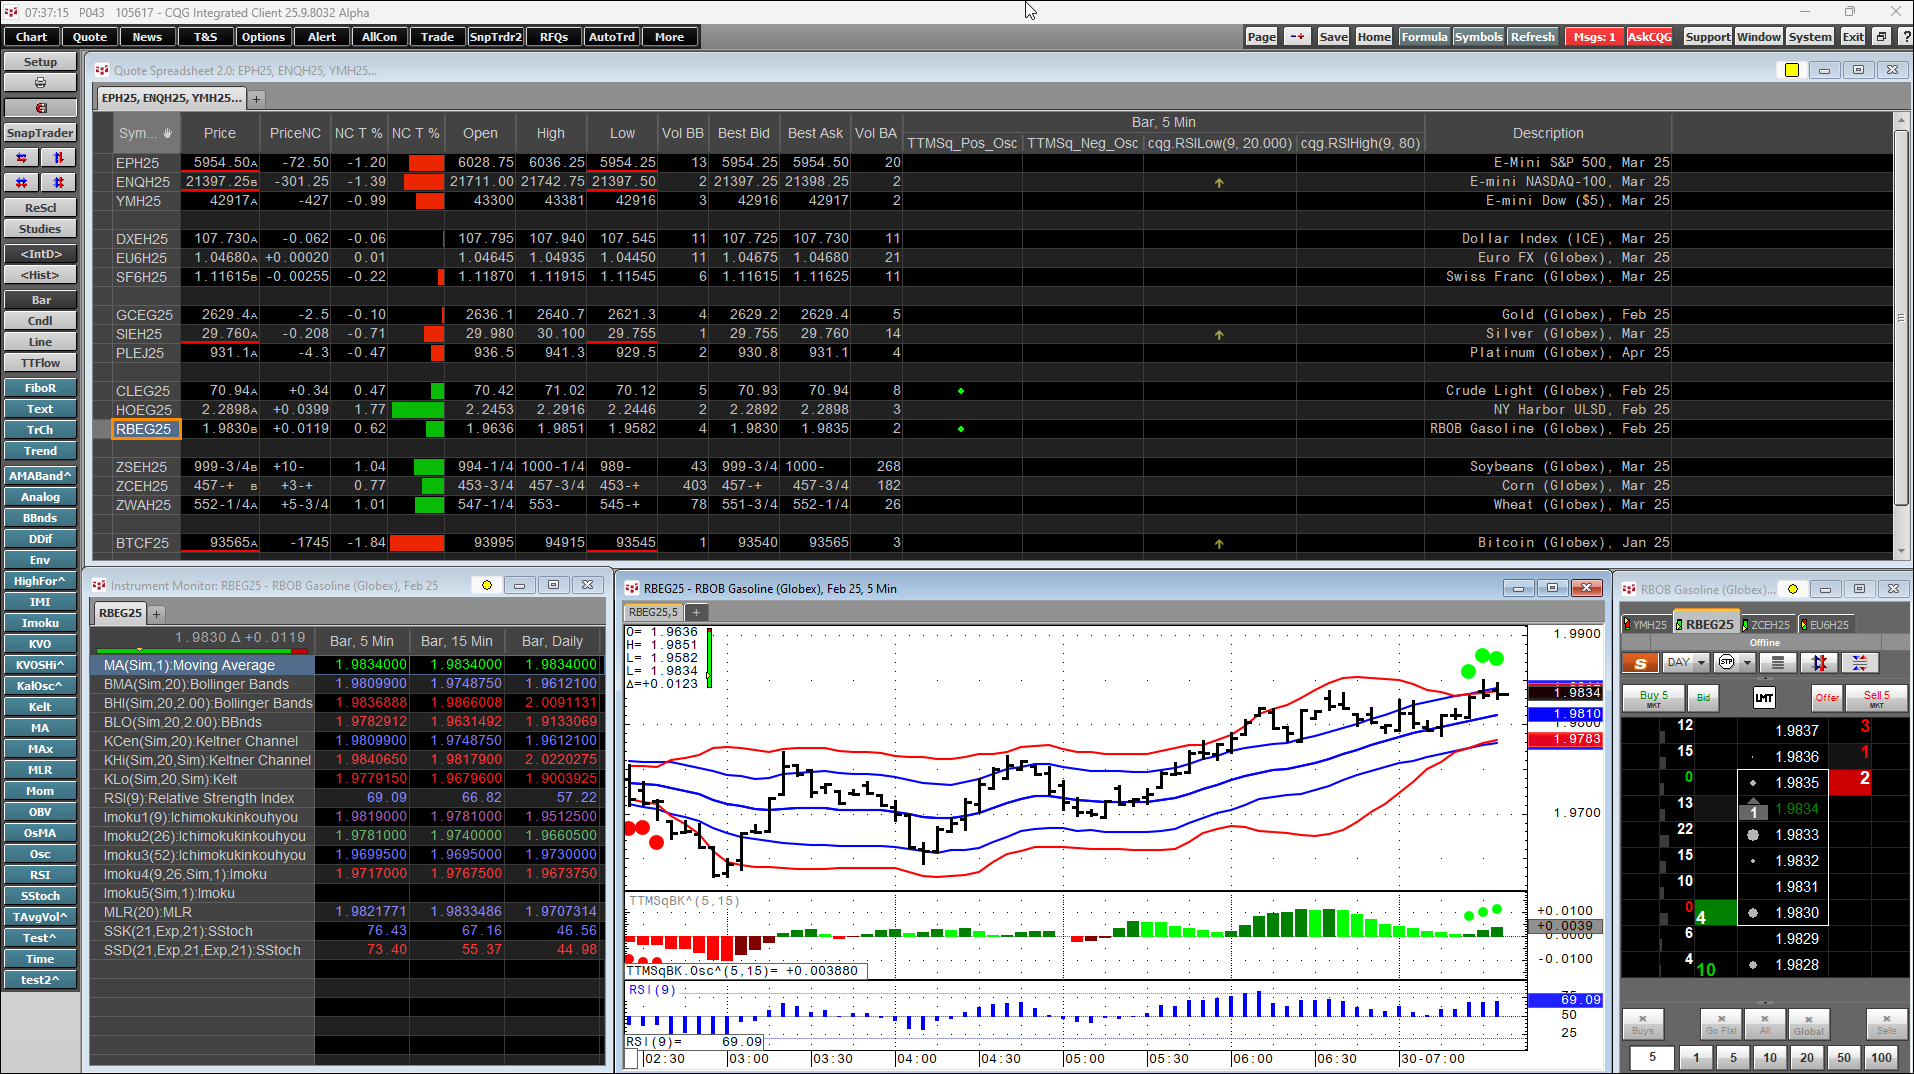
This post details using CQG's Quote Spreadsheet 2.0, Instrument Monitor, chart and DOMTrader to monitor and trade a portfolio of instruments on a single page.
The benefit of the Quote Spreadsheet 2.0 is a collection of markets, and the status of conditions and study values can be monitored in a single view. In addition, the QSS 2.0 can be linked to other features such as charts and DOMTraders.
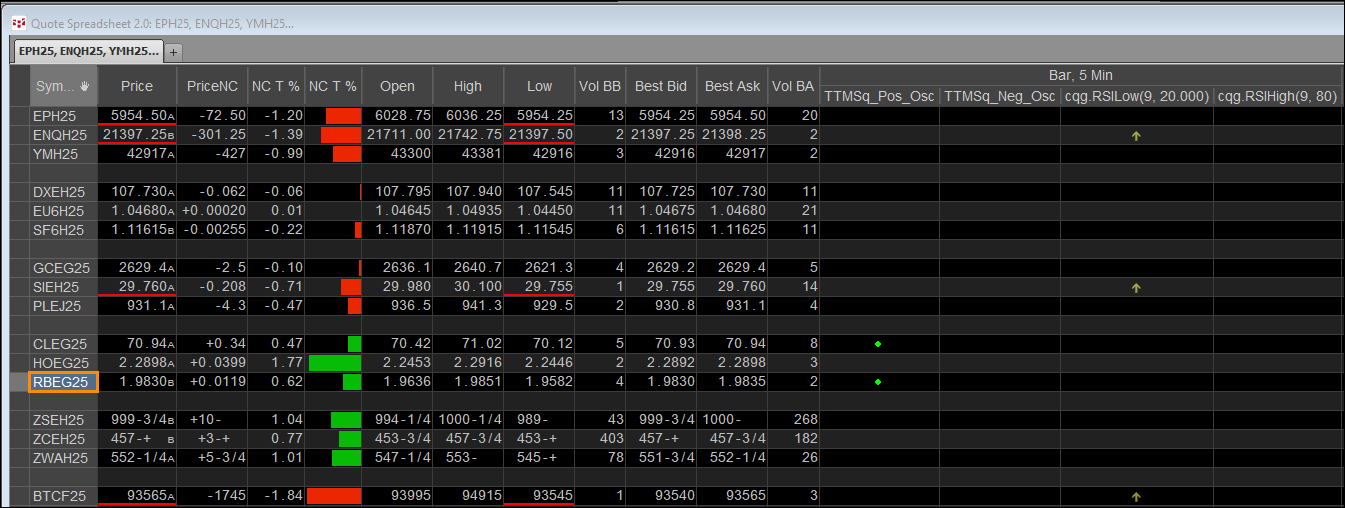
Below, the QSS 2.0 is displaying the status of the TTM Squeeze study and the RSI study. The TTM Squeeze was profiled here.
The RSI study is detailed here.
At the moment of this writing, the condition for the TTM Squeeze is on for RBOB Gasoline (Globex), Feb 25.
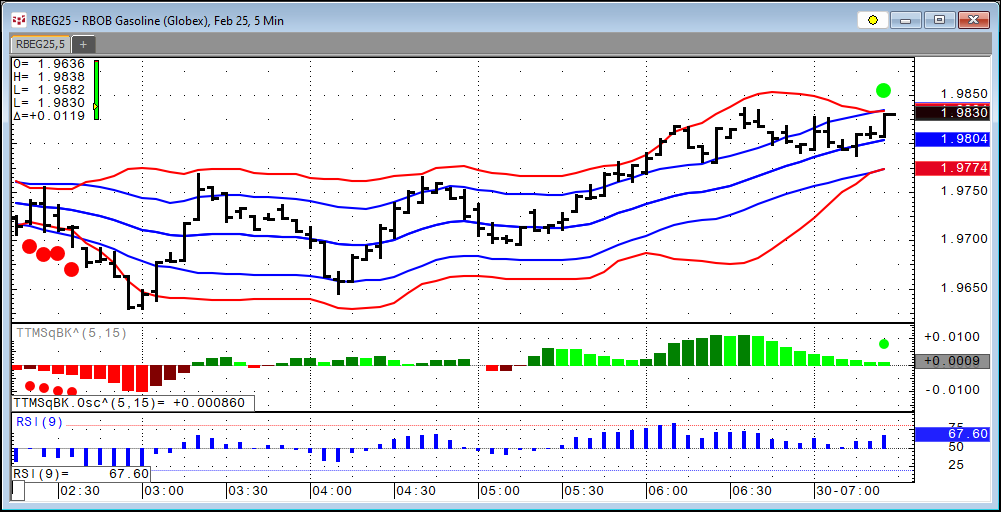
The chart for RBOB Gasoline (Globex), Feb 25 shows the condition on the bar and the oscillator. The condition is the Bollinger Bands are inside the Keltner channels. The squeeze is on. When the Bollinger Bands move outside of the Keltner Channel, the squeeze if off.
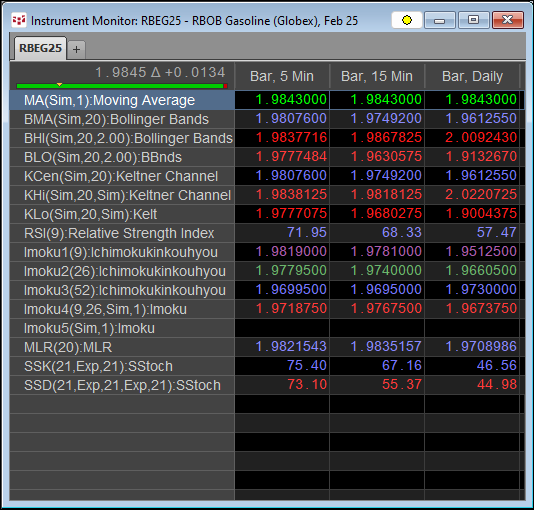
The QSS 2.0 is also linked to the CQG Instrument Monitor and displays the current values of a number of studies over three time frames.
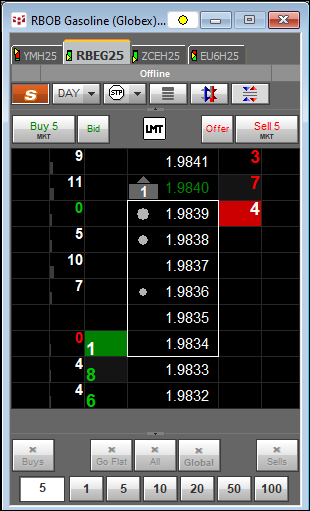
Finally, the QSS 2.0 is linked to the CQG DOMTrader. Select any symbol in the QSS 2.0 and the IM, chart and DOMTrader will change to that symbol.
The downloadable CQG PAC includes the TTM Squeeze custom study and condition.
Requirements: CQG Integrated Client or QTrader.
