Whilst POPS (Price makes a nine-bar high, or low and the RSI makes a three-bar high or low) and UFO (Price makes a 9 Bar high and the RSI a 3 Bar low) have their qualities, the concept is somewhat basic and crude. In isolation, there are times that this simple pattern is simply a warning sign and needs further qualification in order to signal that a reversal is likely. This led to a derivative of the pattern that still required the 9-Bar high or low, but subsequent to that happening, a separate divergence needed to occur subsequent to that pattern. This was done by smoothing out the RSI by placing it on a different measurement of momentum. A pattern could only occur when they crossed over in value. This had the benefit of waiting for the low or high to hold. The secondary benefit was that if it did, it opened up divergence in the traditional sense but also hidden divergence within a sideways trend and most usefully, divergence as a continuation pattern. e.g. The trend is already up, and a buy signal appears.
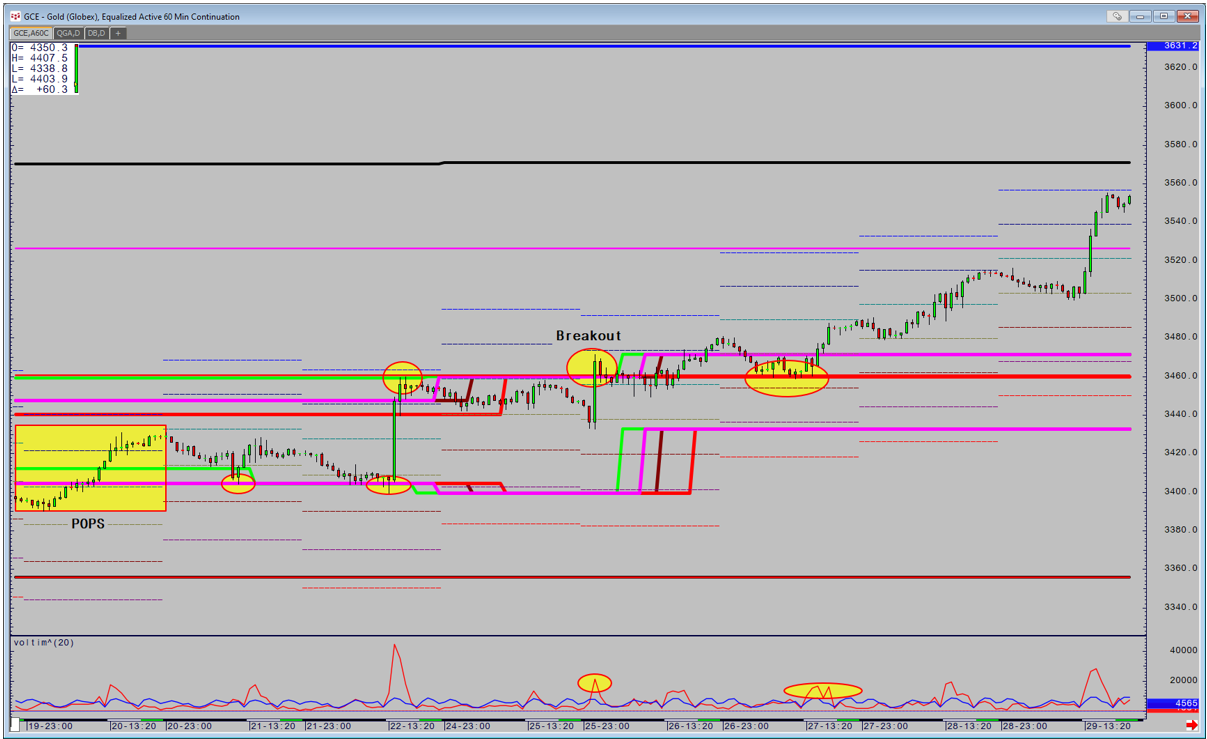
Gold has seen examples of all three. Looking at the chart below, the first pattern is within a large sideways grind, but the low held just above powerful weekly based support. After the signal, price rallies but tops out at the first major upside target at the weekly based resistance (black line, second circle). Price retreats before a POPS signal appears and the rally begins once more.


After the POPS signal, price moves sideways but holds short term support. Finally a breakout occurs and the retracement holds the breakout point, before moving higher. Both points see volume higher for the time of day than normal.
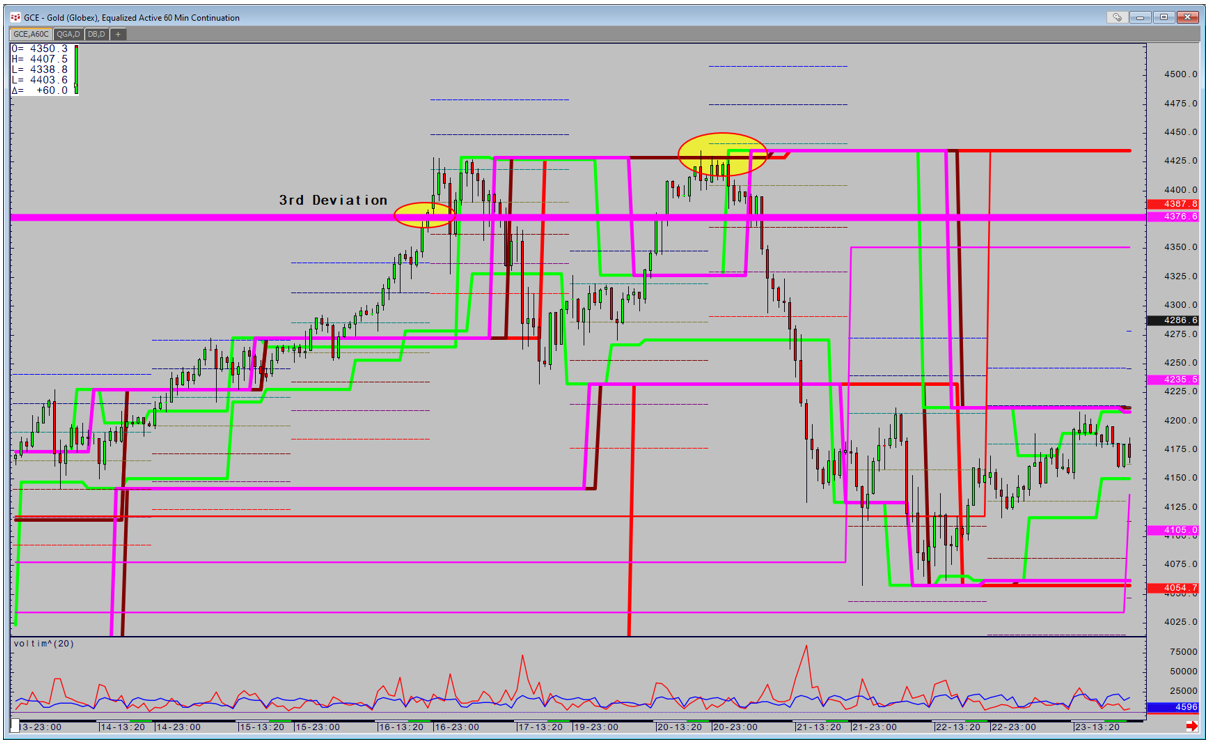
A major technical conundrum occurs when price moves to a price it's never been before or for a very long time. This is where Range Relativity and Range Deviation Pivots provides upside targets.
The chart shows the 3rd Deviations from Weekly to Quarterly (black, blue, pink). Price reaches the Quarterly point, which is rare for any market to achieve. It is even rarer to achieve this just 3 weeks into the quarter and tells me that the market is overextended. Note that price did also reach the 3rd Quarterly Deviation in September but right at the end of the month. This distinction is critical as it will only be a matter of days before the levels reset as the new quarter begins. This highlights how the splicing of time in relationship to the traditional way of continuous momentum is crucial in providing the studies power.

A glance at the short-term chart shows that when it hit the target there was no resistance. However, two days later the picture has changed significantly as what was support has switched to resistance and the top is made.
The second historical signal is an example of a trend ending. There has been a sharp correction, and then a quiet period of sideways.

The short-term chart shows that it takes two further days to signal the breakout with volume double what it is normally for the time of day.
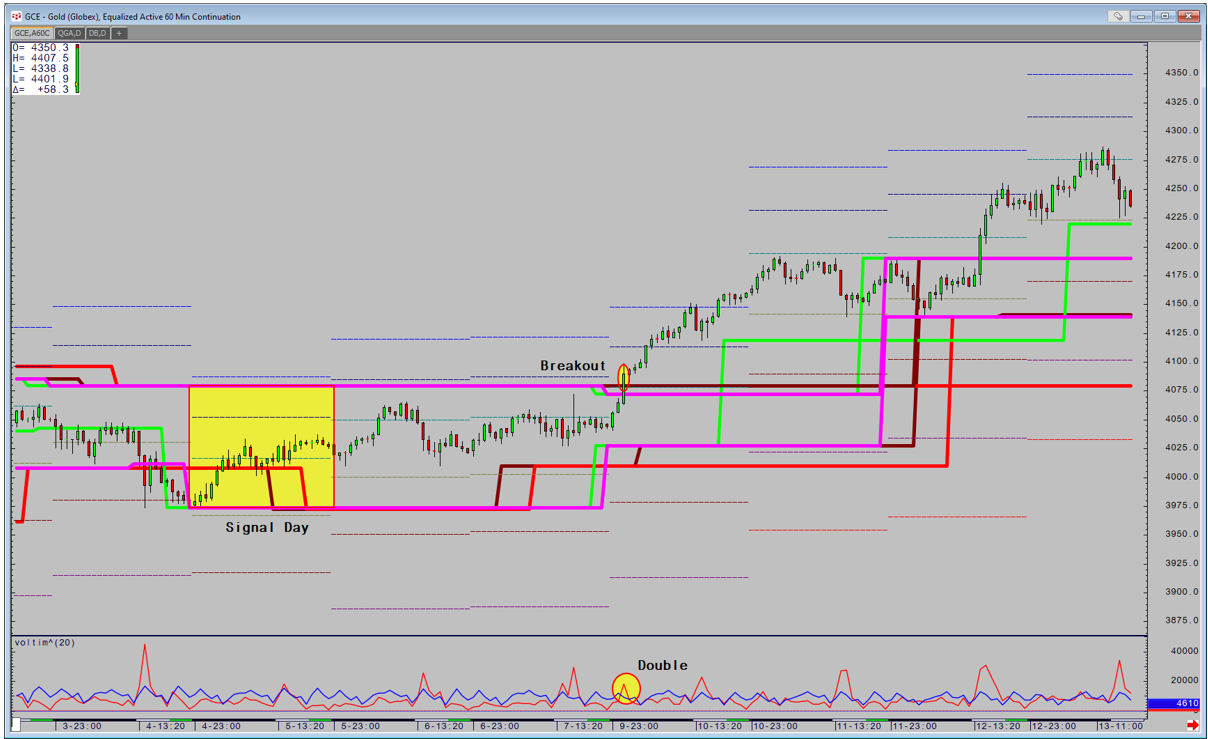
The final signal highlights divergence as a continuation. The most compelling aspect of this, is that traditional analysis is signalling that a breakout will occur if we make new all-time closing highs. In contrast the Peak based method of quantifying support and resistance shows that the breakout point has dropped significantly to the 4286.60 point. A daily close above here leaves no resistance and produces divergence as a continuation of the uptrend to confirm the breakout.

Next month we will Look at Quantifying Divergence through multiple relationships of price to momentum.
