This post provides 10-year analysis of the most profitable Exchange Traded Funds (ETFs) offered on the US Exchanges. At the end of the post is a downloadable CQG PAC for installing a page in CQG IC or QTrader. ChatGPT was used.
The initial prompt: "What are the names, symbols and percentage gain for the ten top performing Exchange Traded Funds in the US since January 2, 2015?"
The AI returned this table based on an article posted by ETF.com:
"Top 10 ETFs (name — ticker — 10-year annualized returns, as reported)
- VanEck Semiconductor ETF — SMH — 28.18%.
- iShares Semiconductor ETF — SOXX — 25.54%.
- Invesco Dynamic Semiconductors ETF — PSI — 24.14%.
- SPDR S&P Semiconductor ETF — XSD — 21.66%.
- iShares U.S. Technology ETF — IYW — 20.56%.
- Technology Select Sector SPDR Fund — XLK — 20.48%.
- Vanguard Information Technology ETF — VGT — 20.46%.
- Fidelity MSCI Information Technology Index ETF — FTEC — 20.23%.
- iShares Expanded Tech Sector ETF — IGM — 19.81%.
- iShares Global Tech ETF — IXN — 19.36%.
(ETF.com's article and table explain methodology and exclusion of leveraged/alternative ETFs; data timestamp: June 10, 2024.) etf.com
The best-performing ETFs of the last 10 years are all technology sector funds, the top four of which focus on semiconductors. Other funds on the list offer broader exposure to other tech industries, including computer software, hardware and information technologies. While technology could continue to outperform the broader market, investors should remember that past performance is no guarantee of future results, and technology ETFs can be volatile."
To track these ten ETFs in CQG a PAC that installs a page in CQG IC or QTrader is available at the bottom of the post. The page consists of a Quote Spread Sheet and a collection of charts.
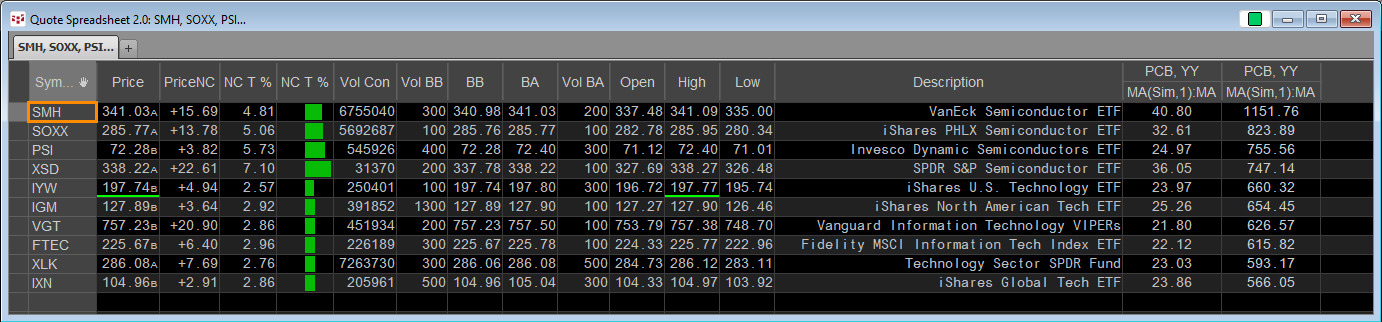
The Quote Spreadsheet displays the ten ETFs sorted by percentage change from January 2, 2015 (far right column). The second far right column is this year's percentage change for each ETF.
The charts are annual charts showing the percentage change from 2015.
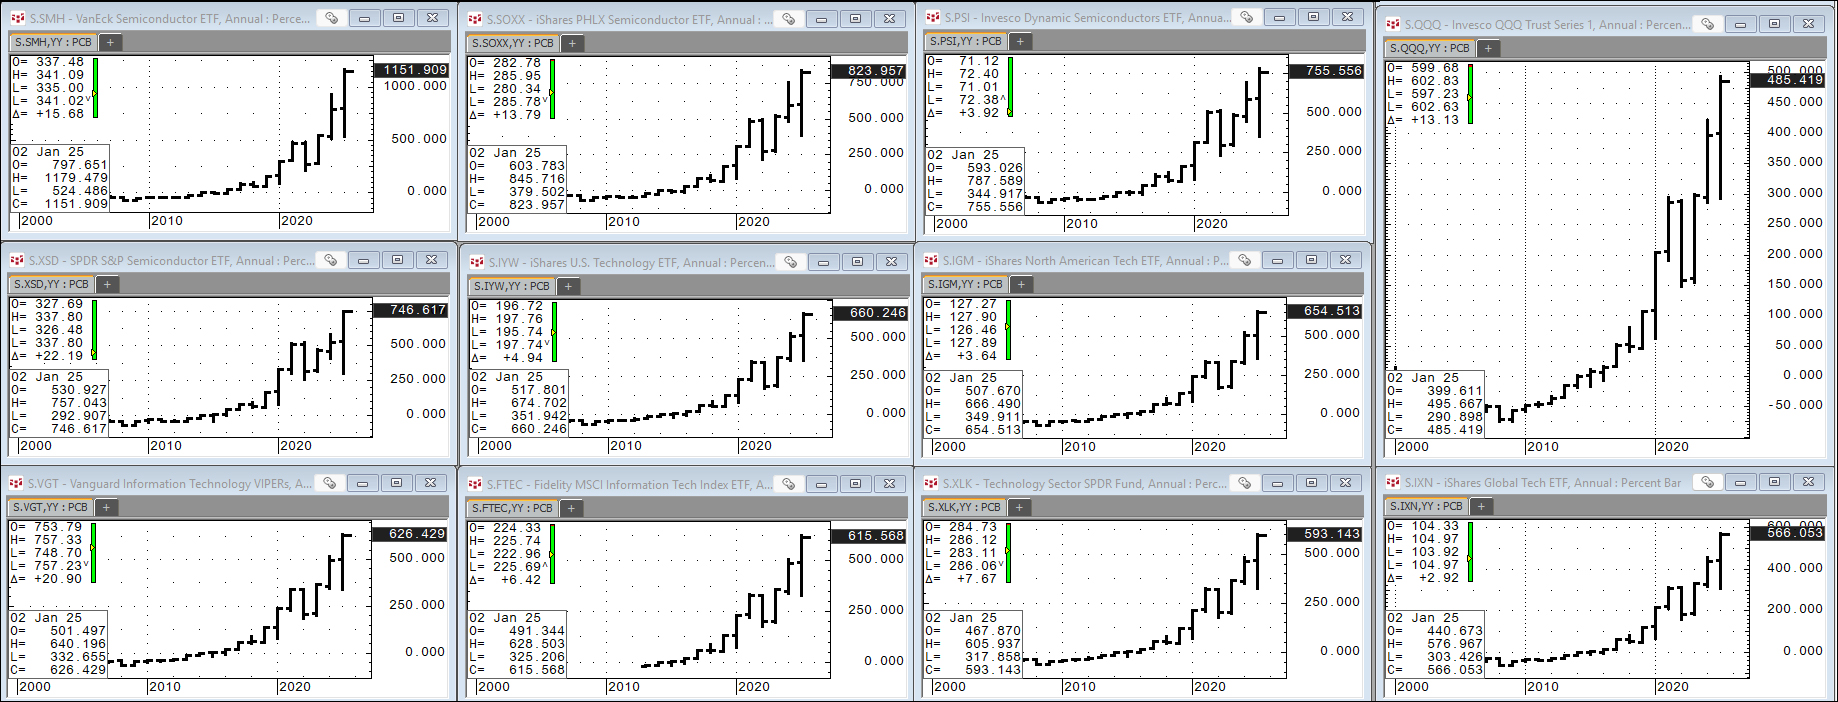
The chart in the top right-hand corner is symbol QQQ. The percentage change for QQQ is less than the percentage change of the other ETFs.
Once the page is installed the charts can be modified.
Requires CQG Integrated Client or CQG QTrader, data enablements for the NYSE and Nasdaq stocks.
This post was assisted by AI and reviewed by Thom Hartle.