This post offers two Excel dashboards for tracking the holdings of the Vanguard Information Technology ETF. The fund tracks a market cap-weighted index of companies in the US information technology sector.
From TradingView.com: "The fund passively provides diverse exposure to information technology stocks in the US, yet it still reflects the concentrated nature of the space. It represents the market well, including more small- and micro-caps than most of the other broad tech sector funds. Definitions of tech differ from fund to fund: the fund includes credit card firms but excludes telecoms. Gaming and internet services companies are also excluded, following a GICS revision in 2018. In all, the fund offers broad, plain-vanilla exposure to the US technology market. The fund diversifies its holdings by applying limits on regulated investment companies using the MSCI 25/50 methodology. The index is rebalanced on a quarterly basis."
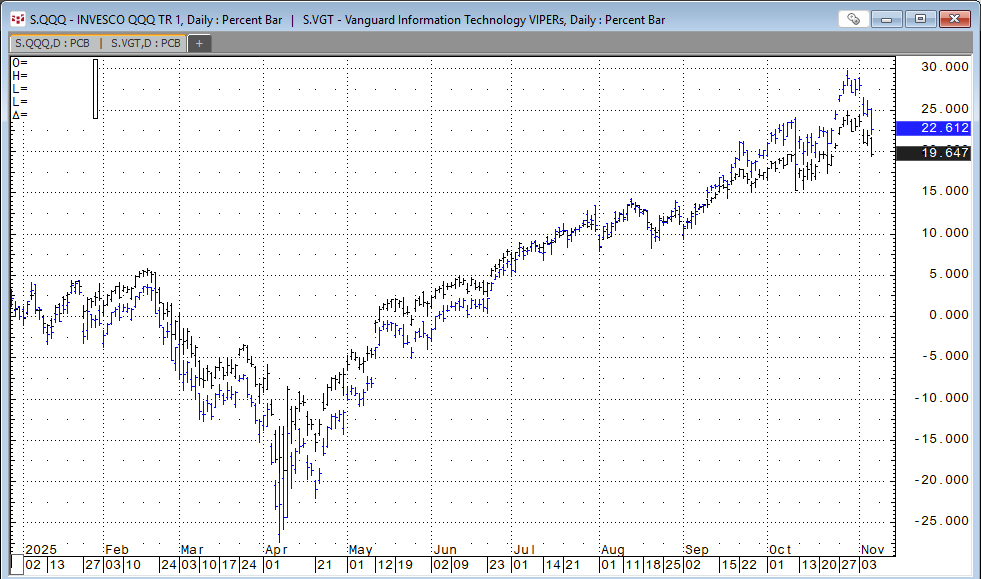
The image below shows the percentage net change from 12/31/24 for VGT ETF and QQQ (Nasdaq 100) ETF. VGT is slightly more volatile than QQQ.
Below is an image of the downloadable Excel Dashboard. During the trading session, the Excel dashboard dynamically ranks the individual stocks held by VGT. The Excel dashboard displayed below shows the top and bottom fifteen performers as histogram bar charts, along with their respective net percent change for today's trading session.
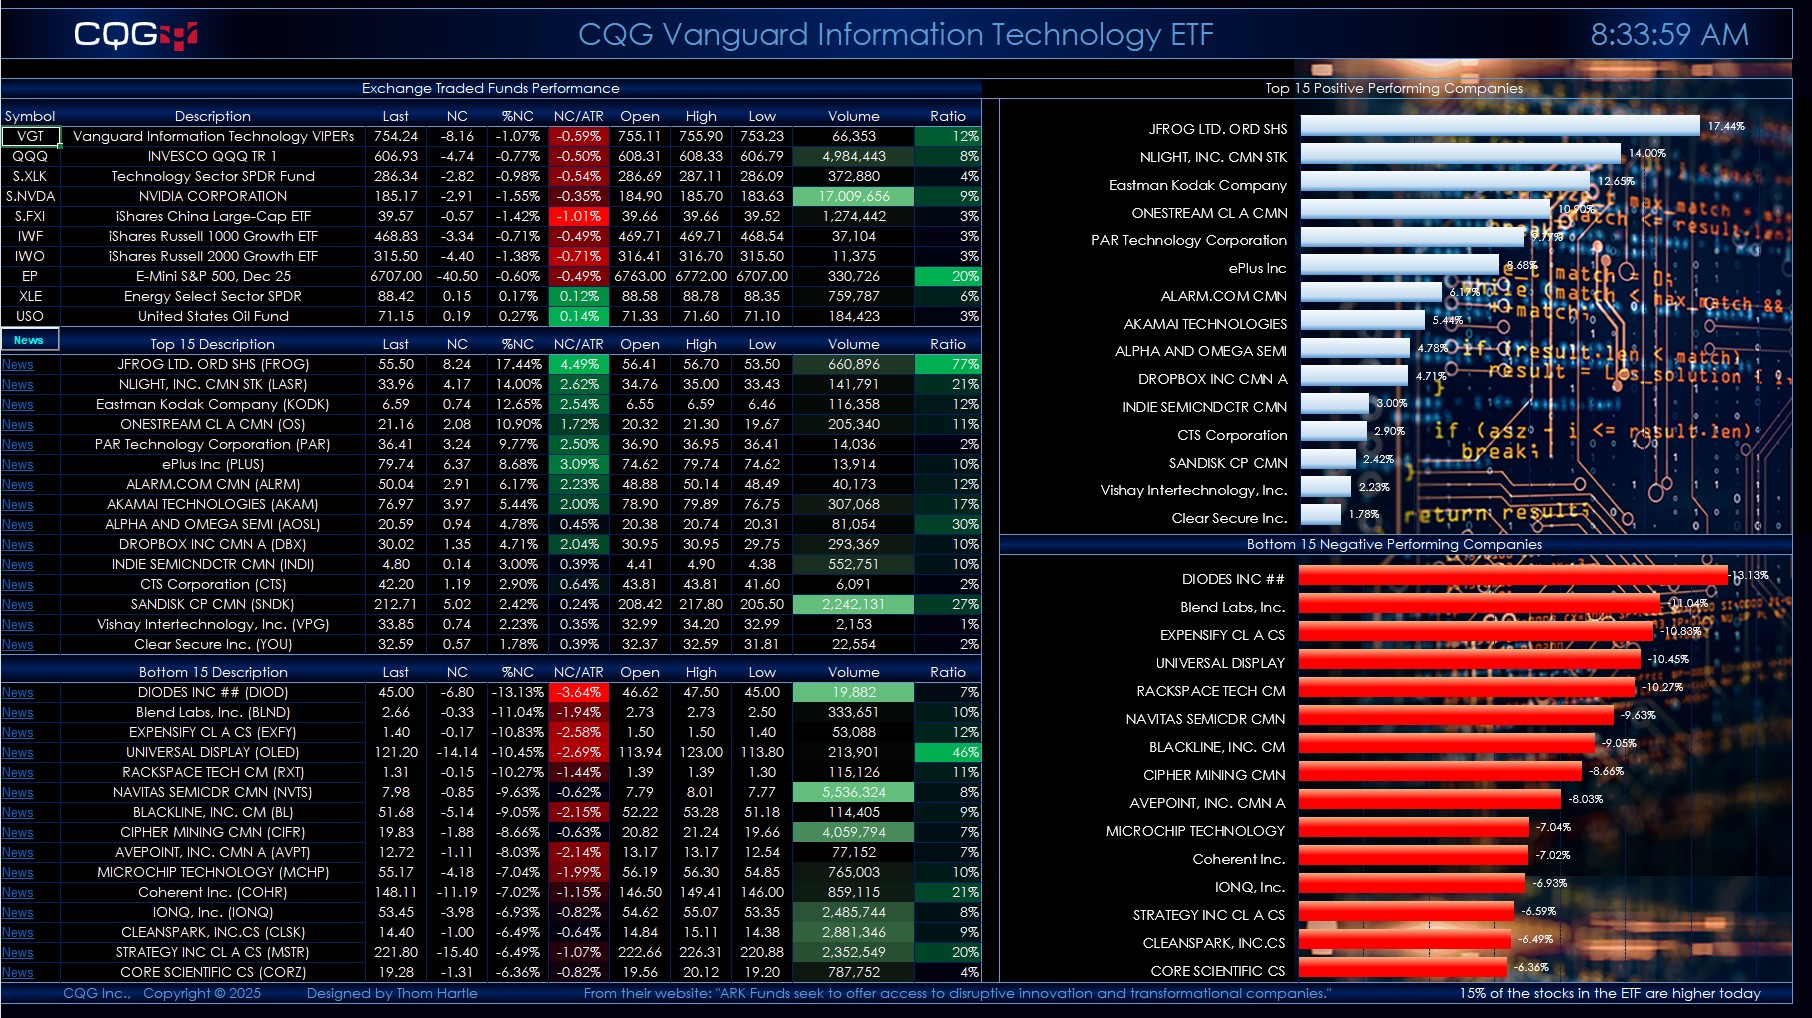
The top section of the quote display allows you to enter your own symbols.
The second section displays the top fifteen performers. The third section displays the bottom fifteen performers.
Quote data includes today's net change as a ratio to the 21-day Average True Range study. Next to today's traded volume is a column that calculates the ratio of today's volume versus the 21-day average of the volume. This ratio column gives you a sense of how active today's trading is. Readings of 100% and higher indicate active trading.
A key feature next to each company name is a link to Yahoo Finance. Clicking the News link will take you to the Yahoo page for that symbol. Note that this could take approximately 30 seconds to open in a browser. Turning off Extensions in your browser will make this happen faster.
If you open another Excel spreadsheet, then this dashboard will no longer be the active spreadsheet. The macro that updates the links and ranks the stocks by performance will stop. To start the macro, simply click the News toolbar button in the first column.
The fund is actively managed. The current holdings are as of 8/29/2025. There is a Symbols tab with instructions detailing where to download the latest posted spreadsheet with the current holdings and steps to update the dashboard.
Two dashboards are available: One has a solid black background, and one has an image background.
Requires CQG Integrated Client or CQG QTrader, data enablements for the NYSE and Nasdaq stocks, and Excel 2016 or more recent.