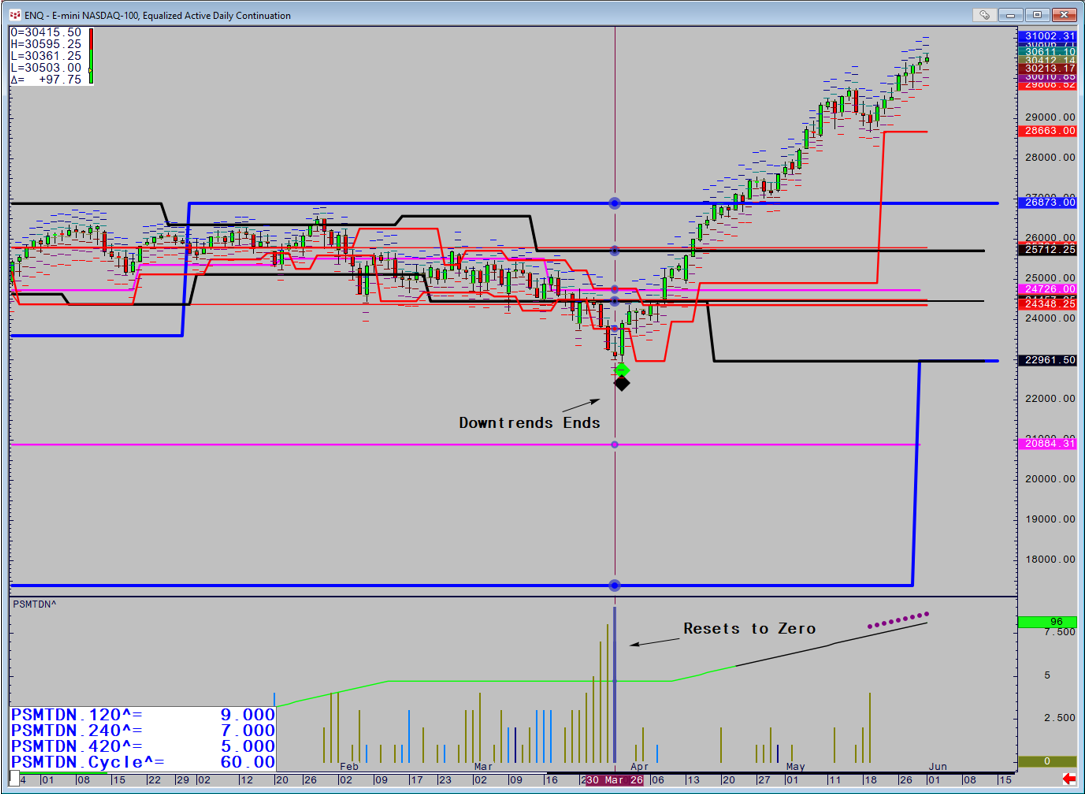
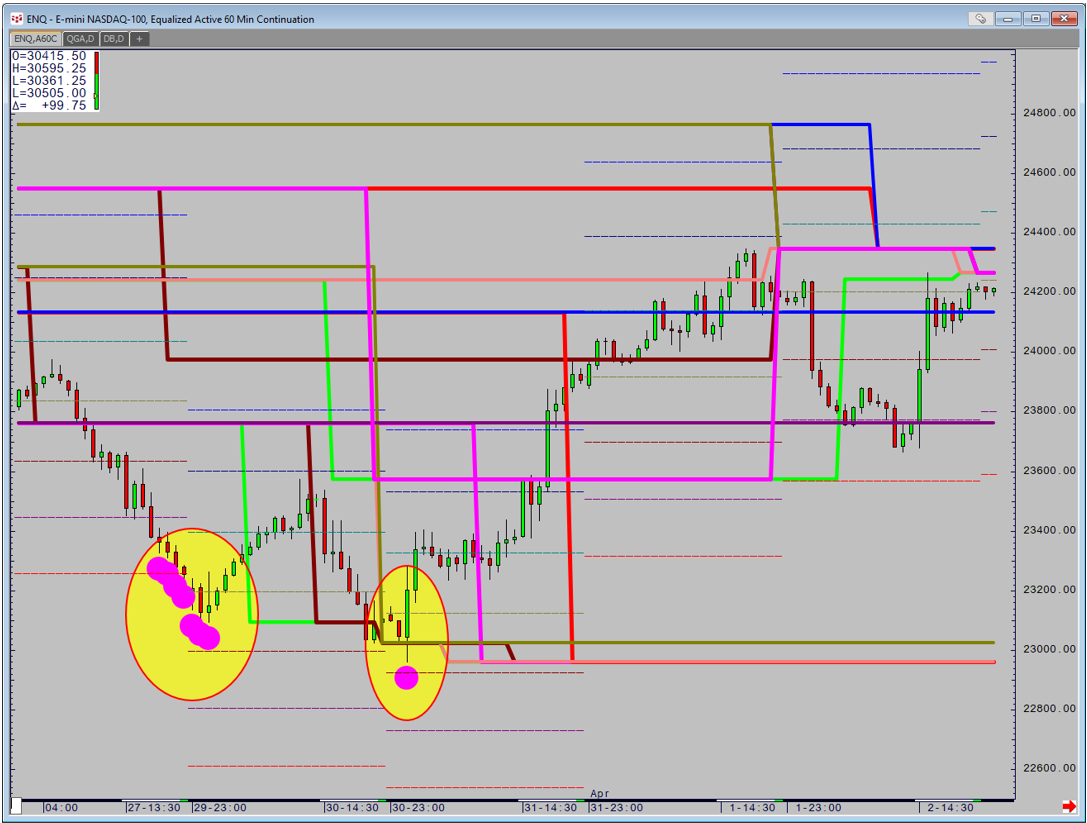
The vast majority of my multiple timeframe analysis is taking my timing chart and projecting higher timeframe patterns and supports and resistances. Stochastic Steps is one of the few that does it the other way around. To recap in an downtrend the Steps record crossovers of the Stochastic and if it is at a lower point than the last time it happens the Step moves up. On historical charts this means that we are referencing the 120-, 240-and 420-minute time frames. Once they have gone above 6 it is now in a set-up whereby if it resets to zero the trend is over. The Nasdaq chart below shows this process whereby the 120 and 240 minutes satisfied the criteria with the 420 minute only at 5 before they all reset.
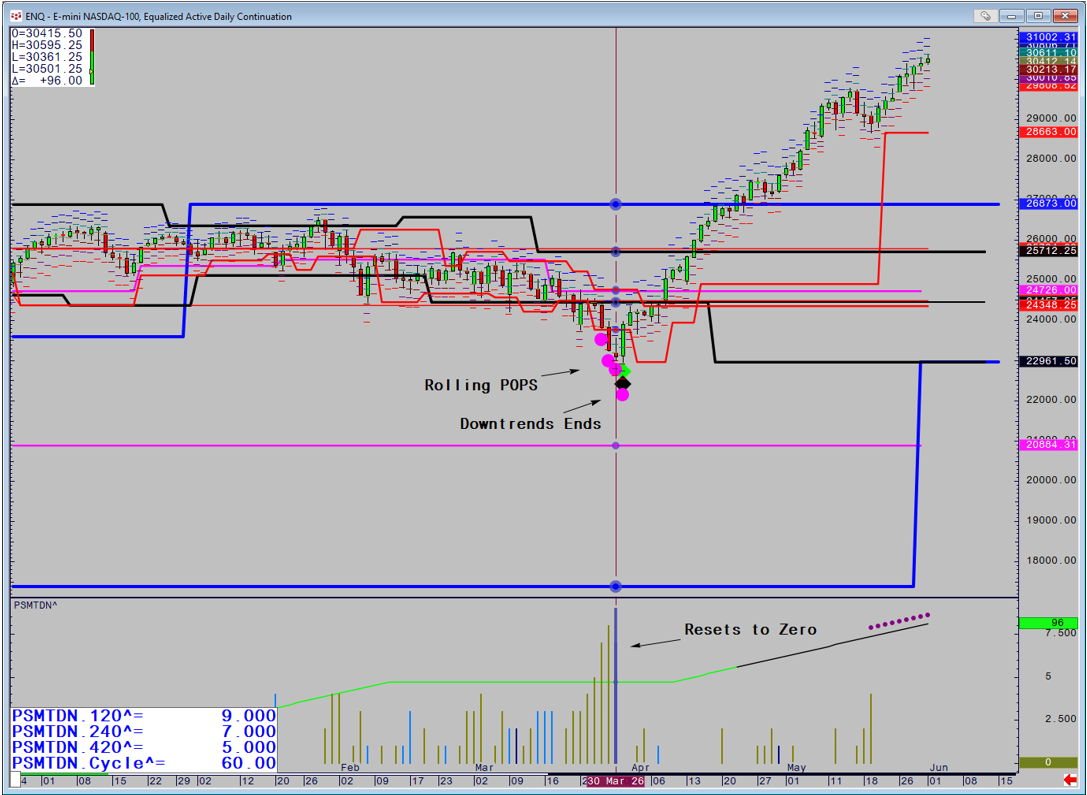
Rolling Divergence takes a similar logic whereby it references a lower timeframe and marks whether your divergence indicator is diverging in lower timeframes. In this instance I have used POPS, but it can be any. Due to the fact that it is referencing multiple lower timeframes, it is often the case that it will mark consecutive Candles. Returning to the Nasdaq the Pink Circles highlight the fact that the downtrend was weakening.
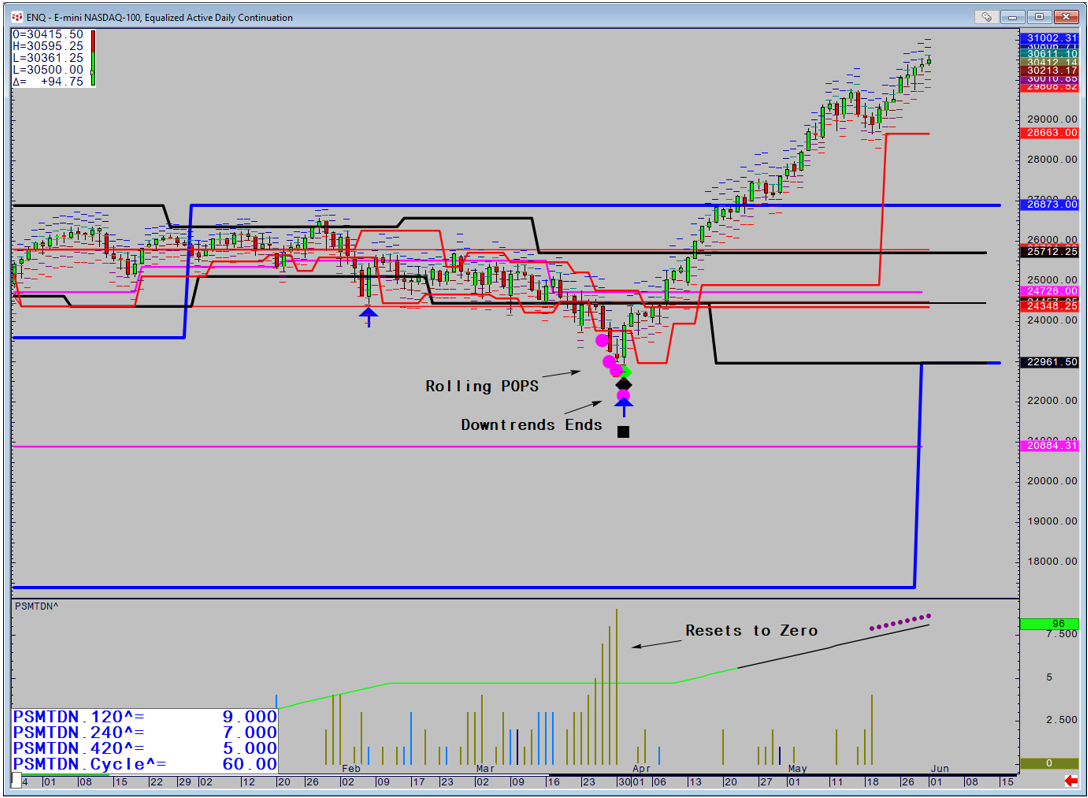
In this instance the Low was also marked by a POPS signal and The Double Smoothed version as well (Blue Arrow, Black Square)
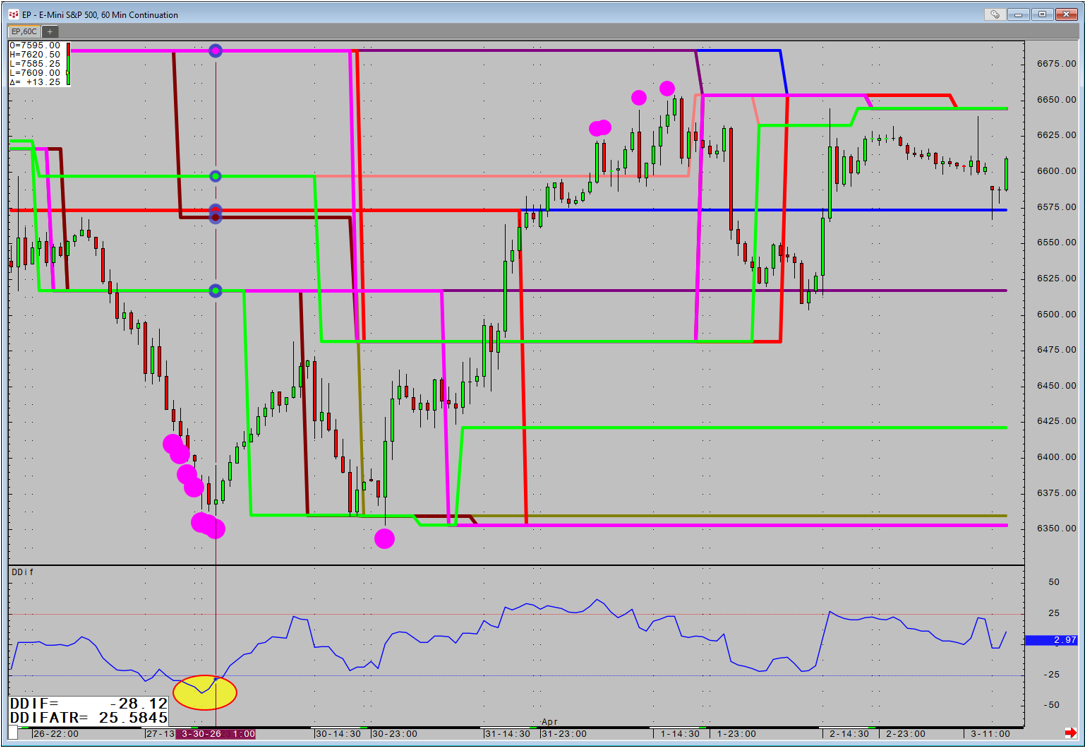
The Rolling Divergence can be used on Intraday charts and then can be connected up with the Supports and Resistances. Looking at the 60-minute, reveals that the trend previously diverged but had no support. This changed on the Day of the historical signals where once again it diverged but this time support had formed and therefore provided a reference point to where the trade was incorrect.
The DMI indicator references and plots an up and down Dmi number over a 10 period average dependant on whether the close was up or down. This means in a trend the lines typically go in opposite directions. Traditionally the crossover between the two was the key point. However I found more use in using the Dmi Diff study which plots the difference between the two. The Dmi itself rarely indicates overbought or oversold, but the difference does. The code is simple and is one of the first I ever created. The Difference has to have been beyond 35 or -35 and then moved in the opposite directional for two periods.
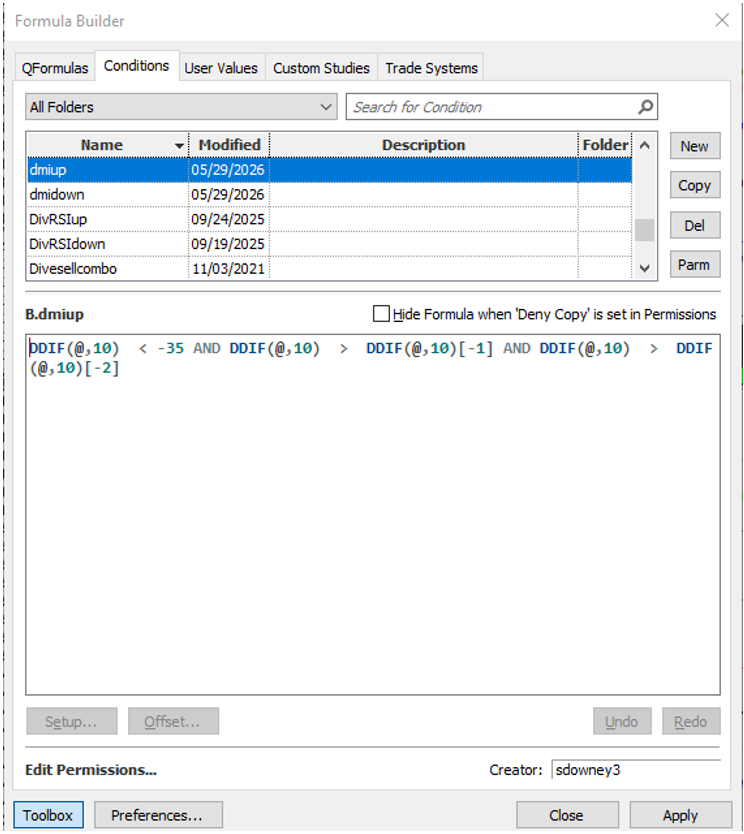
In a similar vein to Rolling, it is possible for it to occur on consecutive Candles, so there is one important caveat. If the signal appears in a downtrend but it is a down Candle, you wait for the first positive Candle before the signal is validated. The lower the timeframe you are using the more important this becomes.
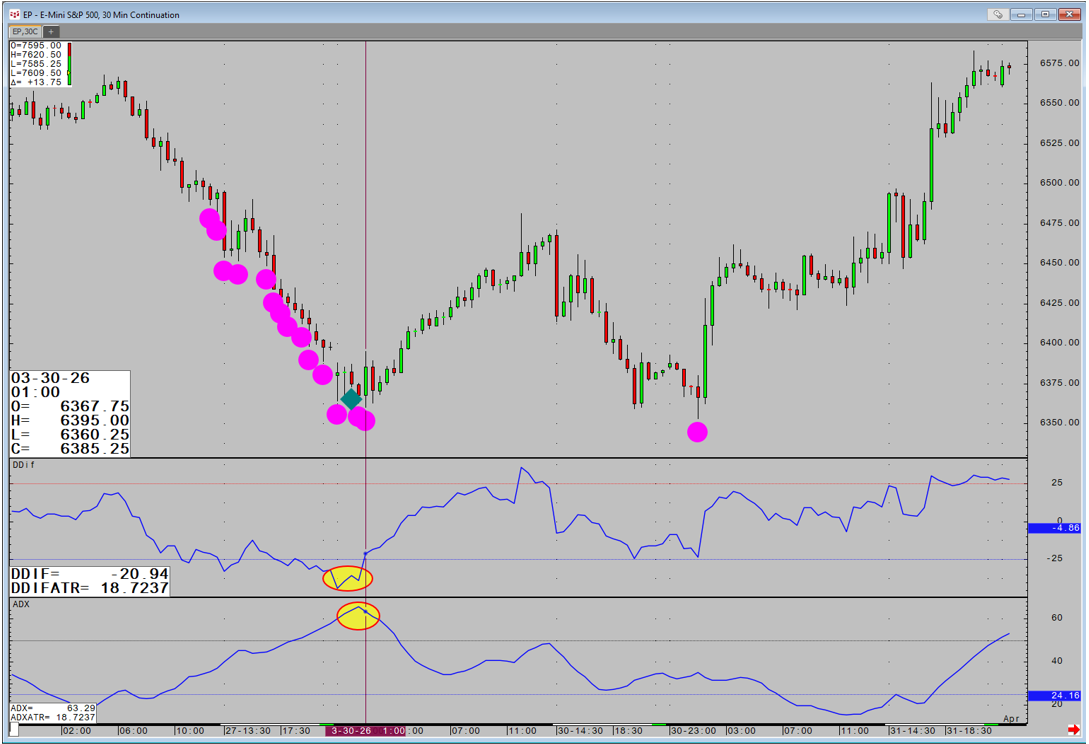
Looking at the S&P at the same time as the Nasdaq low, we see that the 60 minute was Rolling but by the time a pattern could occur on the Dmi Diff it is above the threshold of -35.
However on the 30-minute Rolling has been going for some time and then a Dmi Diff signal appears (Green Diamond).
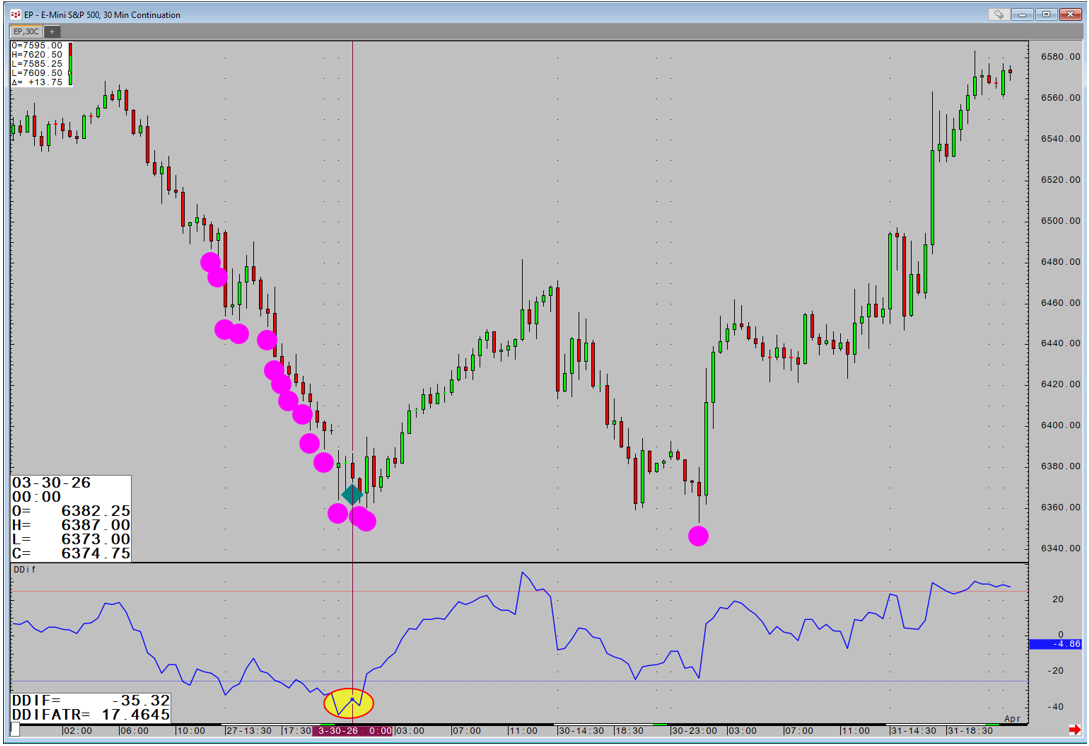
It is said that when the ADX study is close to drawing its pension then the trend is close to ending. The ADX turns down from above 70 on the Candle of the final Rolling signal.