This post is similar to the recent post "Excel 365 GROUPBY and XLOOKUP".
That post introduced using the Excel function GROUPBY to arrange by sectors the stocks in the NASDAQ 100 and identify the stock within each sector with the maximum percentage net change and the stock with minimum percentage net change during the current session.
This post is similar in that the GROUPBY function is used to aggregate energy markets, such as Crude Light Oil (Symbol: CLE) which has 130 contracts, by years and determine which delivery month has the highest net change and which delivery month has the lowest net change within each year.
Here is a brief introduction to the GROUPBY function:
Excel's GROUPBY function offers the ability to create a summary of data. The data can be grouped, aggregated, sorted, and filtered based on the fields you specify.
The syntax of the GROUPBY function is:
GROUPBY(row_fields,values,function,[field_headers],[total_depth],[sort_order],[filter_array],[field_relationship])
The sample spreadsheet available at the bottom of the post has six tabs. The Main Display tab, CLE Data, QO Data, HOE Data, RBE Data, and NGE Data.
Each Data is using RTD formulas to pull in market data. The GROUPBY function is used on the Data tabs. The function is pulling in the year and the net change using the MAX parameter.
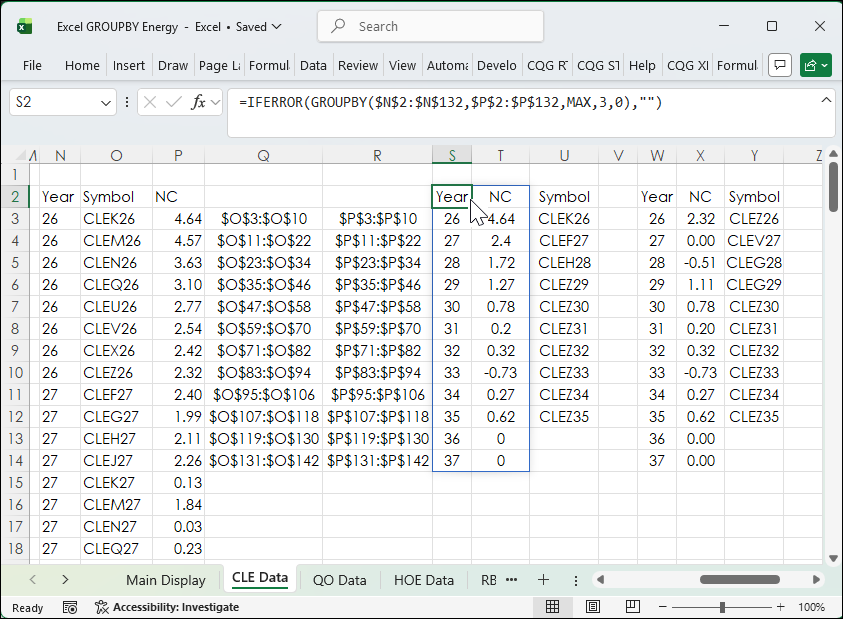
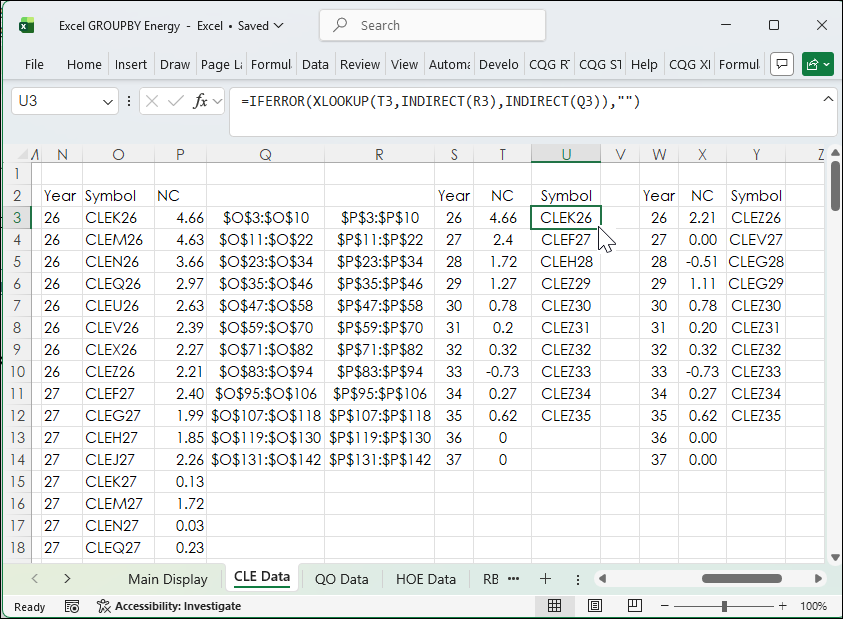
Then, using the XLOOKUP Function the symbols are reversed engineered from Columns Q and R using the percentage net change to find the symbol.
Notice below the XLOOKUP is using the INDIRECT function for the parameters. This confines the XLOOKUP Function to search for the symbol that matches the net change range within the same year. This is because the XLOOKUP function will return the symbol upon the first time it sees the first matching net change value, which might be in an earlier year. Columns Q and R will automatically adjust the range when the contracts roll.
This same process using the GROUPBY function set to MIN and XLOOKUP for the minimum net change in cells W2 to Y14.
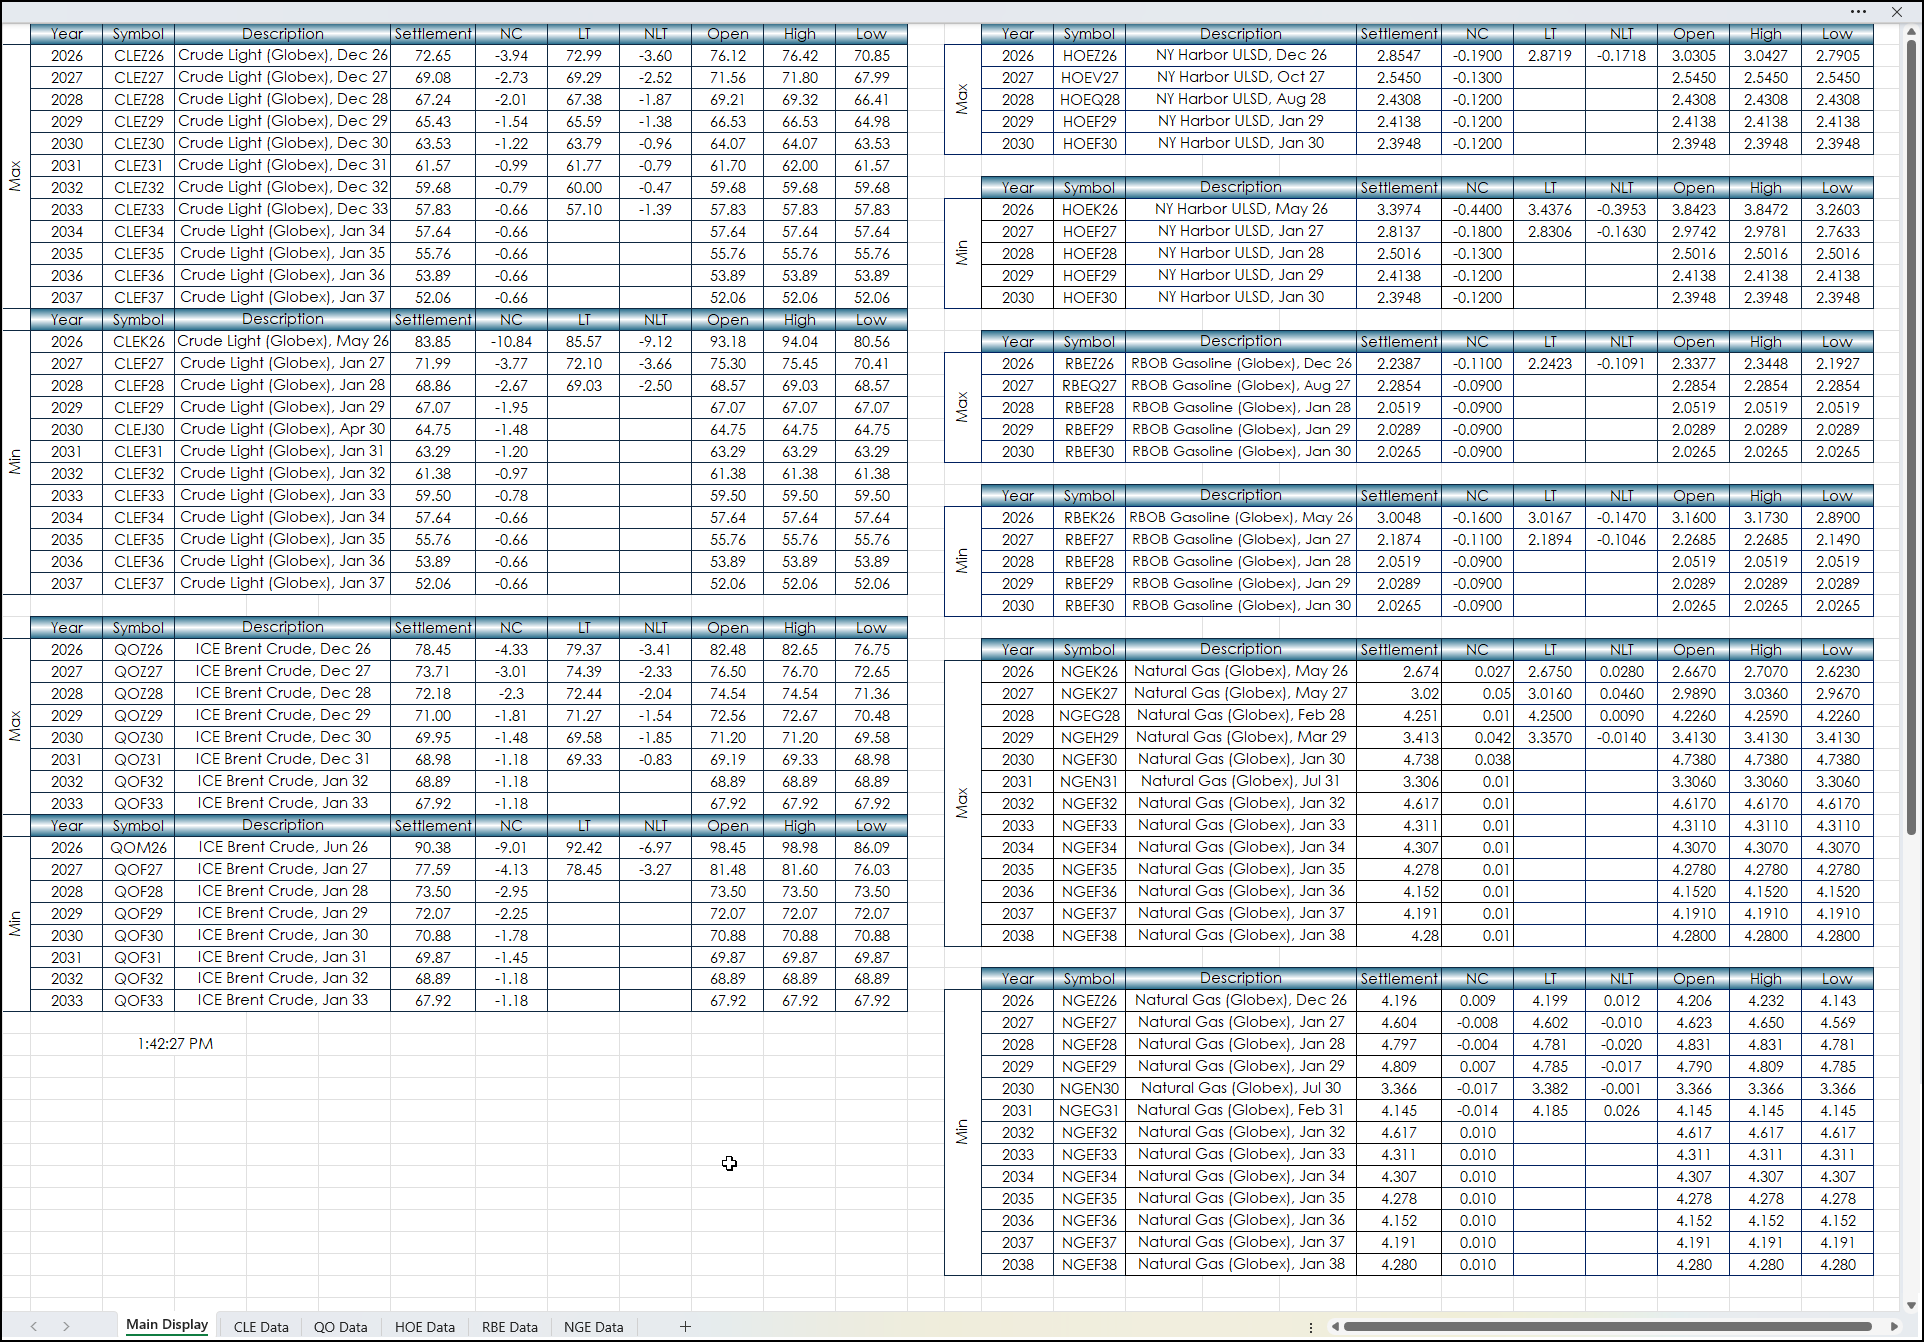
All of this data is used on the Main Display tab. The data is pulled into blocks. There are two blocks for each market, a Max block and a Min block. During the trading session the net change is used for the GROUPBY function.
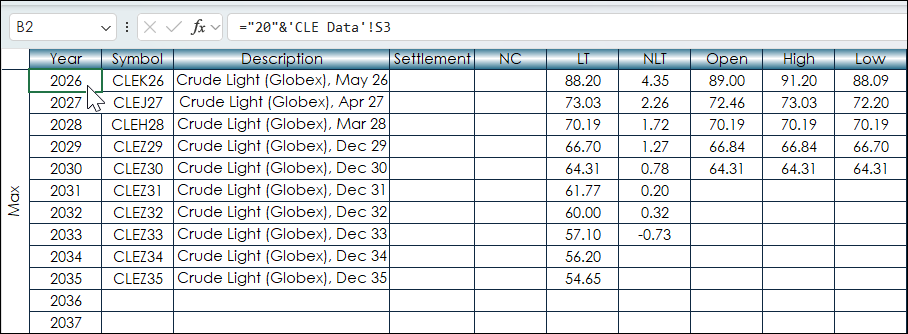
When the session's Settlements are posted then the GROUPBY function uses the Settlement's Net Change for the evaluation. The five columns to the right of the NC will continue to update using the symbols from the symbol column.
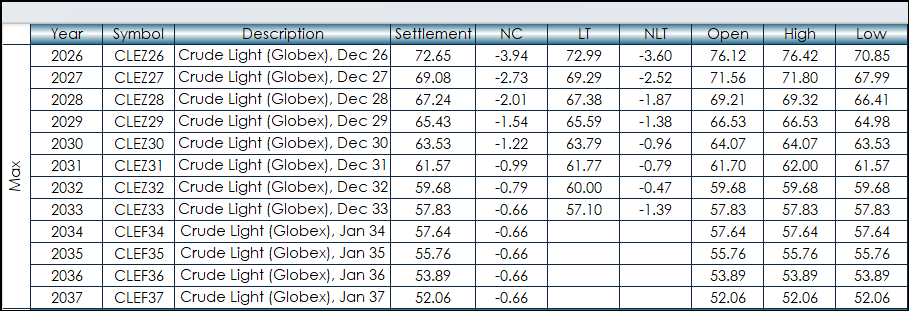
The image below shows the entire Main Display tab.
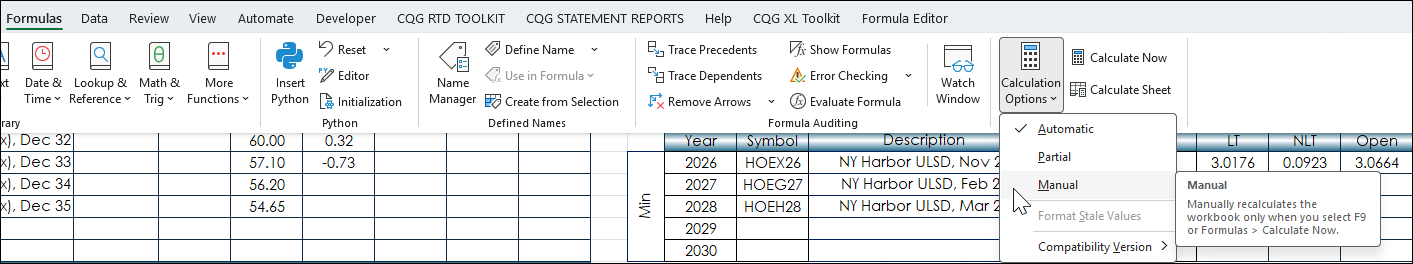
Note: This spreadsheet is pulling in a large amount of real-time data. Prior to an important economic release setting the data update to Manual just before the release and then setting the data update back to Automatic will reduce the load on the CPU. Go to Formulas and temporarily set the Calculation Options to Manual. The clock at the bottom of the spreadsheet will stop updating.
This post introduced Excel's GROUPBY function to group Energy markets by years and then determined the Maximum and Minimum performers within the each year for the session. Excel's XLOOKUP function was used to extract the symbol matched to the Maximum and Minimum data points.
Requirements: CQG Integrated Client or QTrader, exchange enablements for the CME Group and ICE Futures Europe -- Commodities, and Excel 365 (locally installed, not in the Cloud) or more recent.