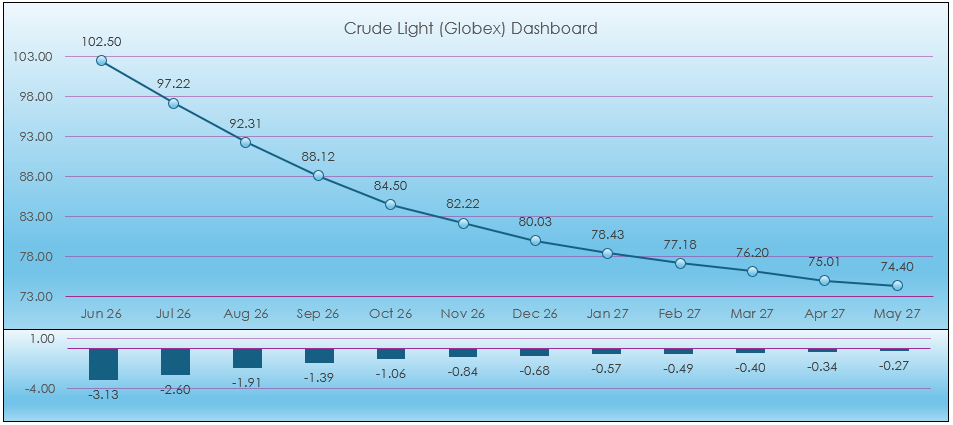
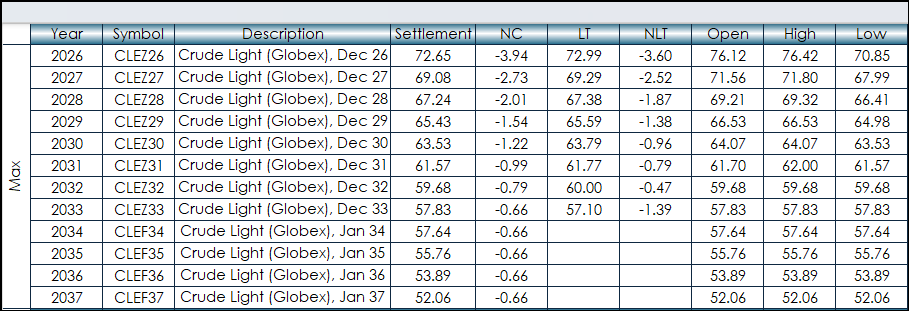
This post presents a macro enabled Excel Light Crude Oil dashboard using combined functionality detailed in previous Workspace posts. The dashboard uses numerous RTD calls for today's market… more
Energy
This post is similar to the recent post "Excel 365 GROUPBY and XLOOKUP".
That post introduced using the Excel function GROUPBY to arrange by sectors the stocks in the NASDAQ 100 and identify… more
The Middle East explodes, sending crude oil prices higherBrent outperforms WTI for obvious reasonsThe levels to watch in crude oil over the coming weeksThe optimistic caseThe pessimistic case
Crude… more
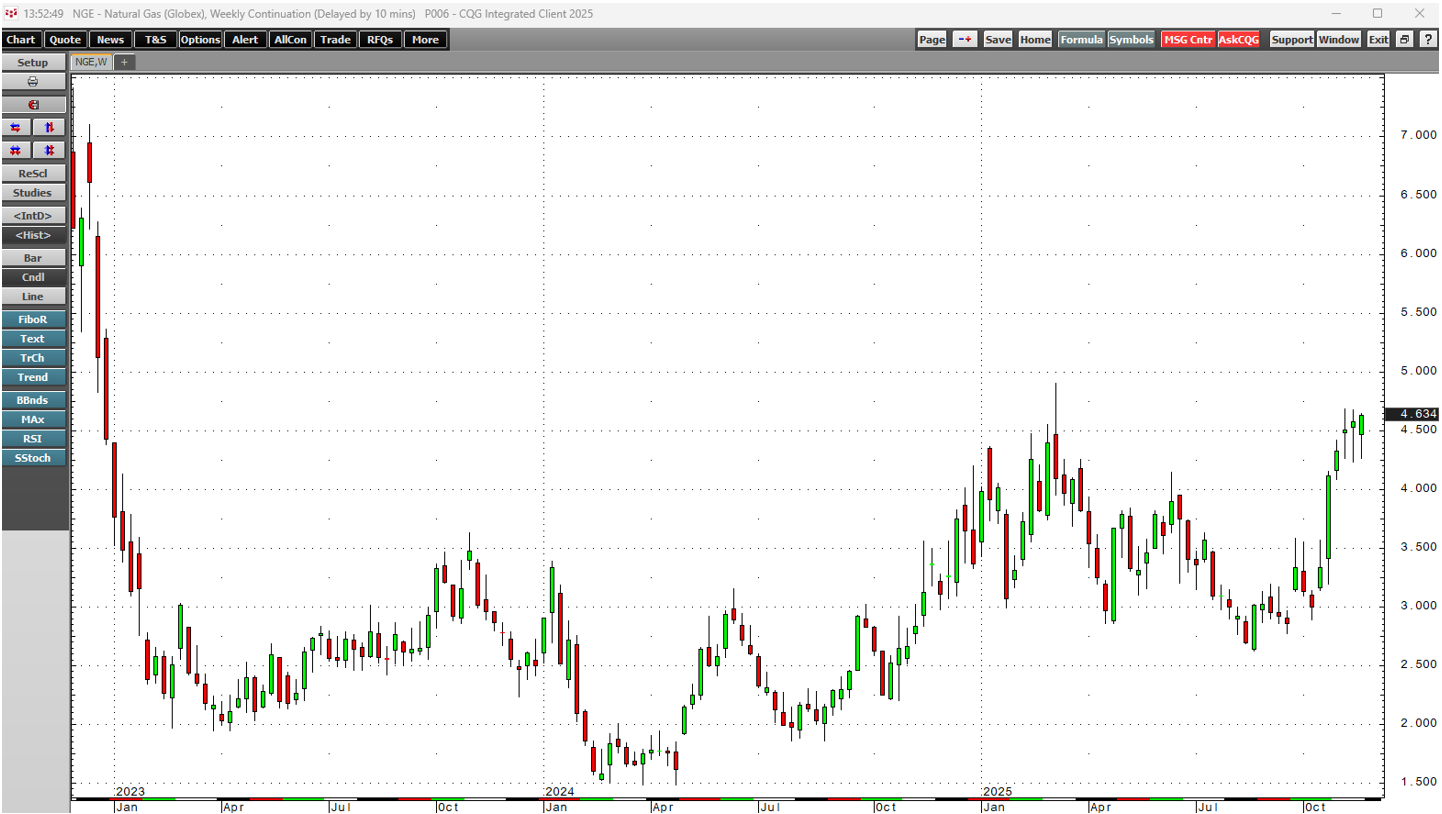
A bullish trend in natural gas at the beginning of the peak demand seasonThe withdrawal season began in mid-NovemberGeopolitics and LNG could support pricesThe winter temperatures are critical for… more
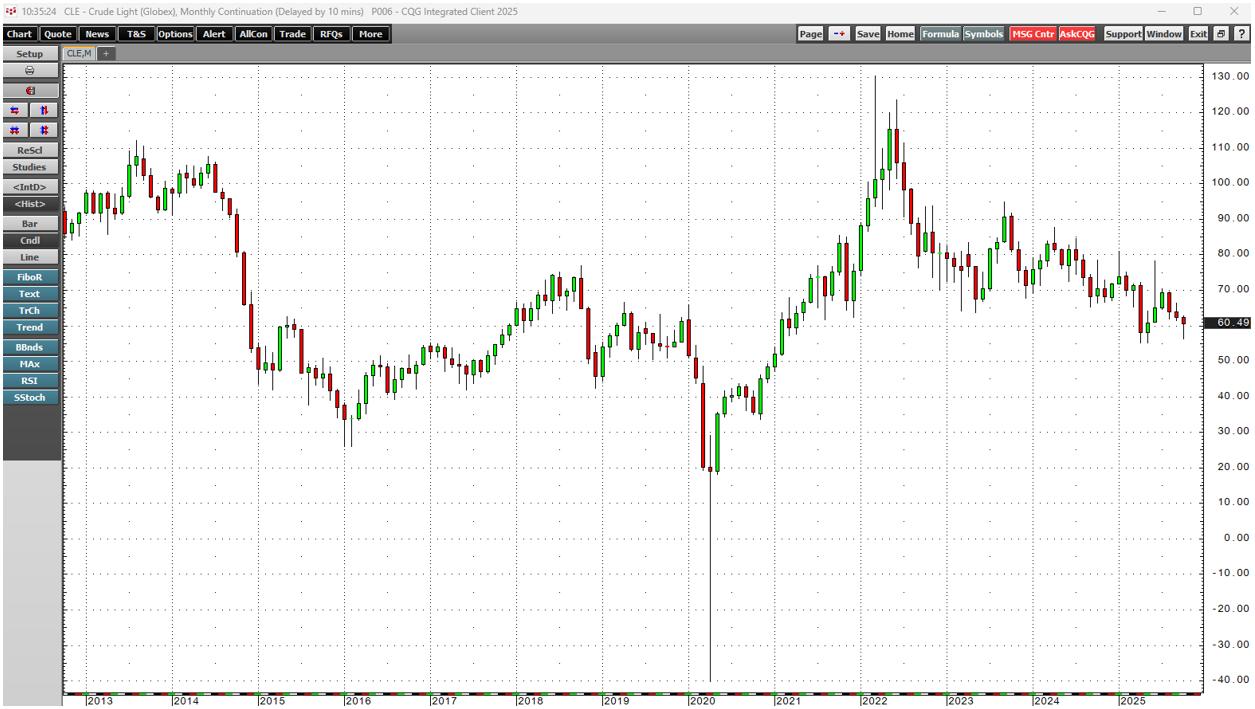
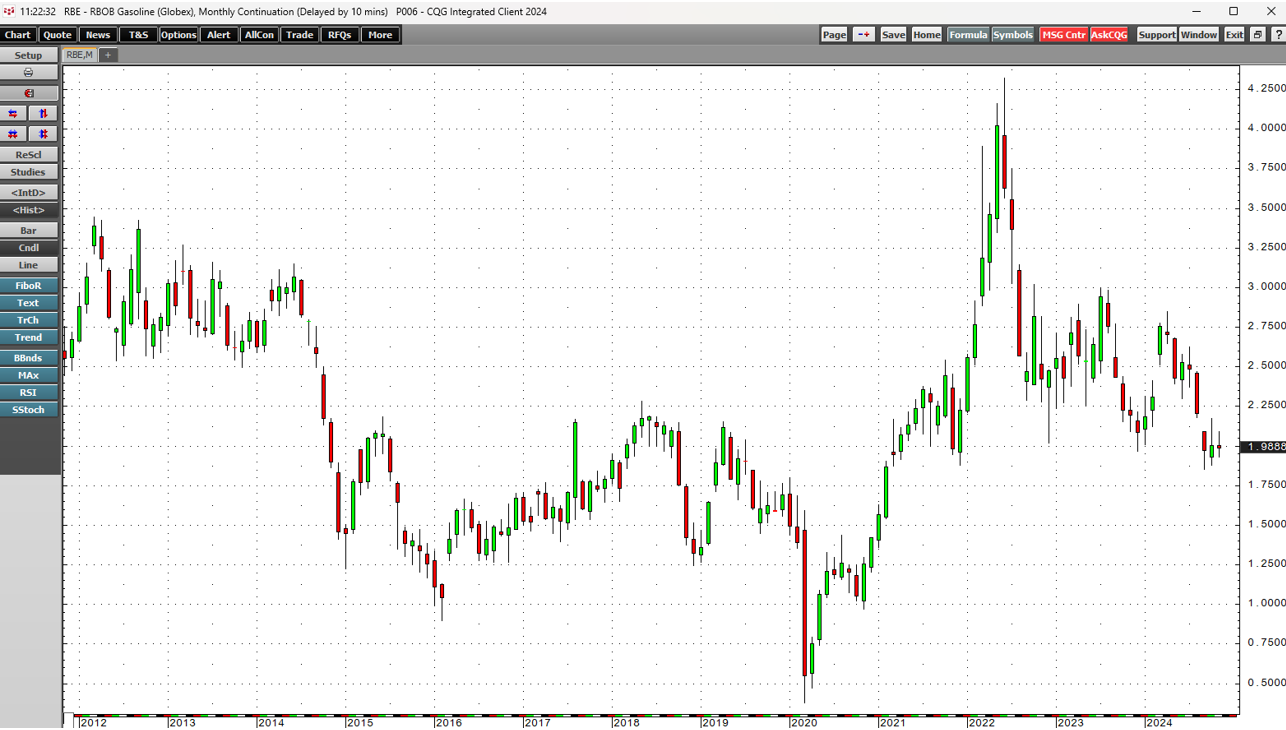
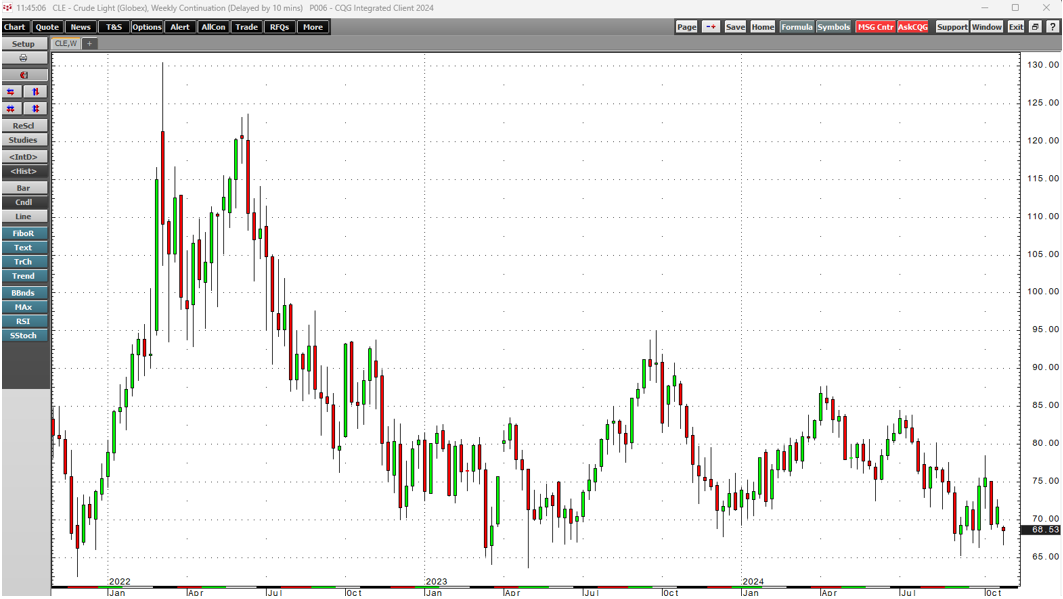
The bearish trend since the 2022 peak continuesSeasonality favors lower oil pricesU.S. energy policy is bearish- OPEC+ production weighs on pricesGeopolitics remains bullishA break of critical… more
This dashboard provides market data for CME products. The dashboard uses a navigation bar instead of tabs.
The left-hand side provides market data for products. The right-hand side… more
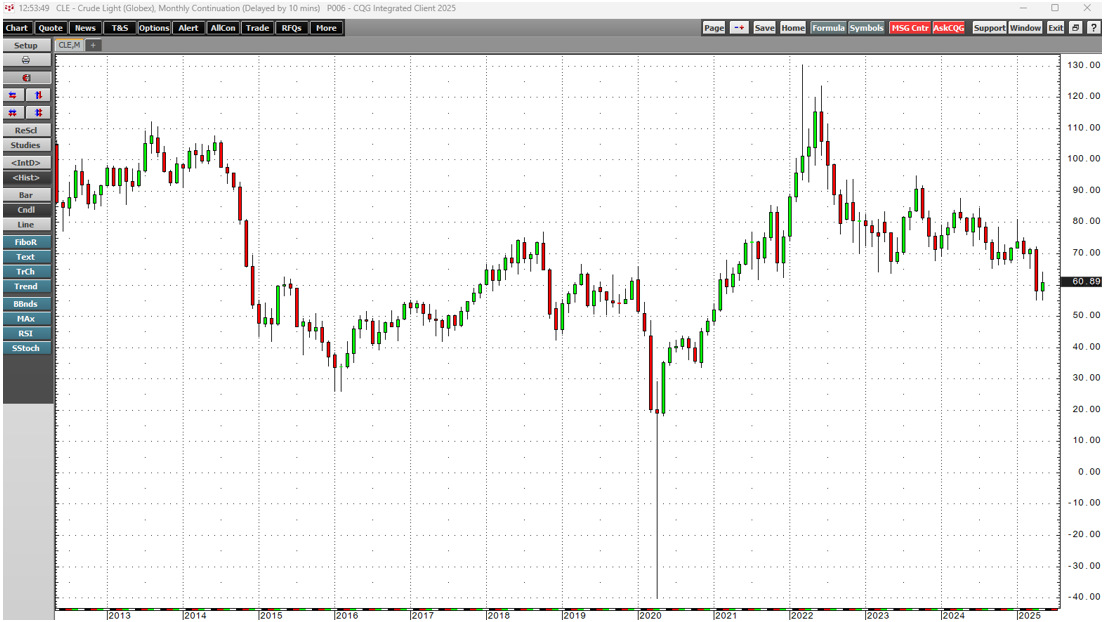
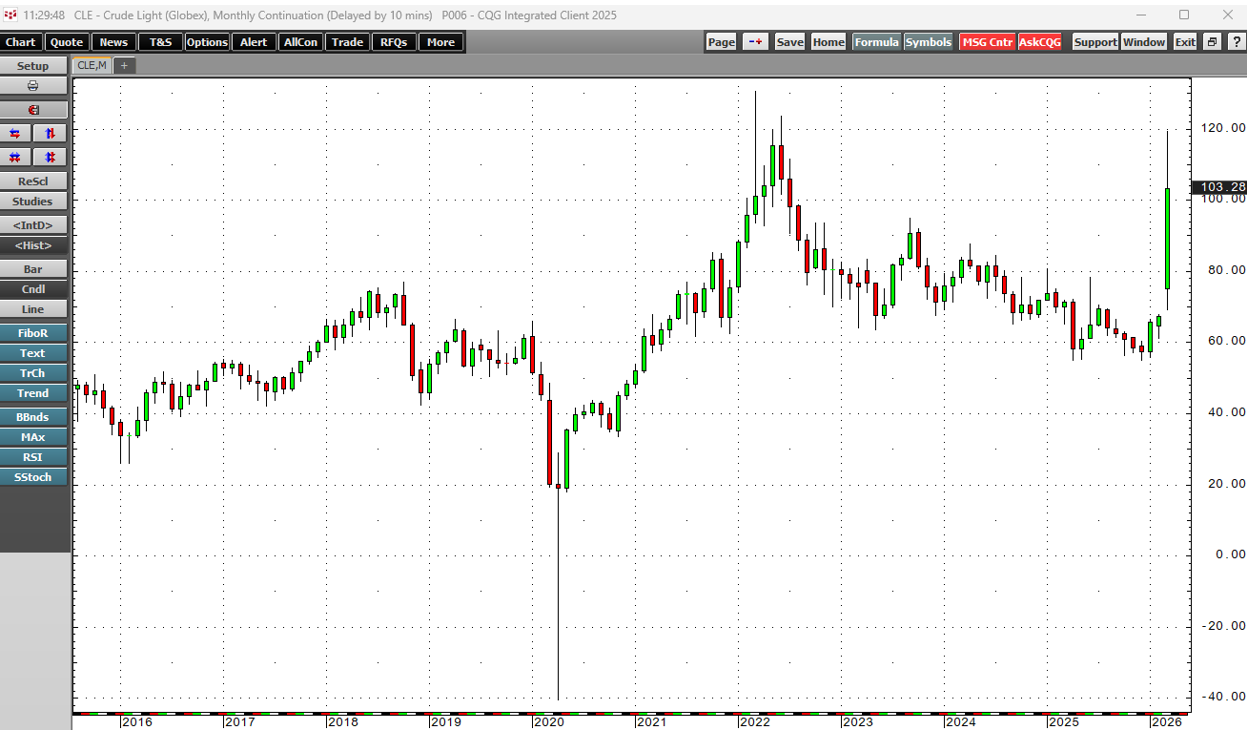
Crude oil prices have been falling since 2022, when they reached the highest price since 2008 at $130.50 on the nearby NYMEX WTI futures contract. Meanwhile, the energy commodity's pivot point has… more
This post details the downloadable Excel Market Performance Dashboard's features and functions. The dashboard has seven tabs (the first is data and the other tabs display a chart and a table of… more
Crude oil is a highly political energy commodity that powers the world. The U.S. is the world's leading oil-consuming country.
Source: Statista
The chart shows the U.S. was the… more
The ongoing and escalating war in the Middle East between Israel and Iran and its proxies is not bearish for crude oil prices. However, other factors have led crude oil lower. China is the world's… more