
Technical studies are used to analyze markets and are often the basis for trading decisions. The studies all take market data and apply mathematical steps that result in a single value.
An improvement would be a study result in the form of a relative comparison. For example, the current session's trading volume is a value. Is it a high value or a low value? The solution is to compare the current level of volume to an average and create a ratio. This is the topic of this post. Three studies are detailed that are common studies but are modified to be ratios. A CQG PAC is at the end of the post that installs a page with the three studies applied to charts.
First, is Net Change (NC) as a ratio to Average True Range (ATR). The net change is simply the current price minus yesterday's closing or settlement price. Average True Range is the average of the difference between each session's high and low in the lookback period.
The CQG formula for the NC_ATR study is:
(Close(@)-(Close(@)[-1]))/ATR(@,Sim,21)
The NC is compared to the 21-period average high low ranges.
In this next image META has the largest NC_ATR reading.
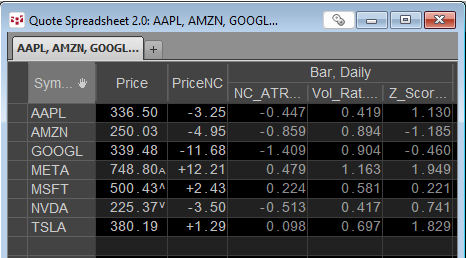
The next study compares the current session's volume to the 21-day moving average of the volume. The previous 21-day volume average is used to have a fixed value. The image above shows that META again is the leader with this study. The CQG formula for the Vol_Ratio study is:
OIVol(@)/(MA(@,Sim,21)[-1])
The final study is the statistic Z Score. This is the difference between the current price and the 21-day moving average. That difference is divided by the 21-day standard deviation. The CQG formula for the Z_Score study is:
(Last(@)-MA(@,Sim,21))/STDDEV(@,21)
This study can indicate strong market performance. In META's case the ratio is close to 2 and is the highest in group.
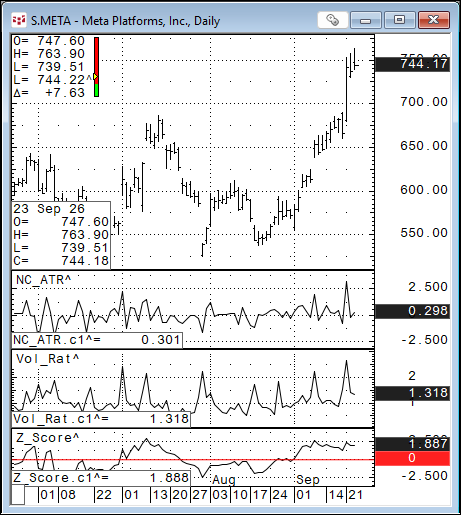
The next image is a chart with all three studies applied.
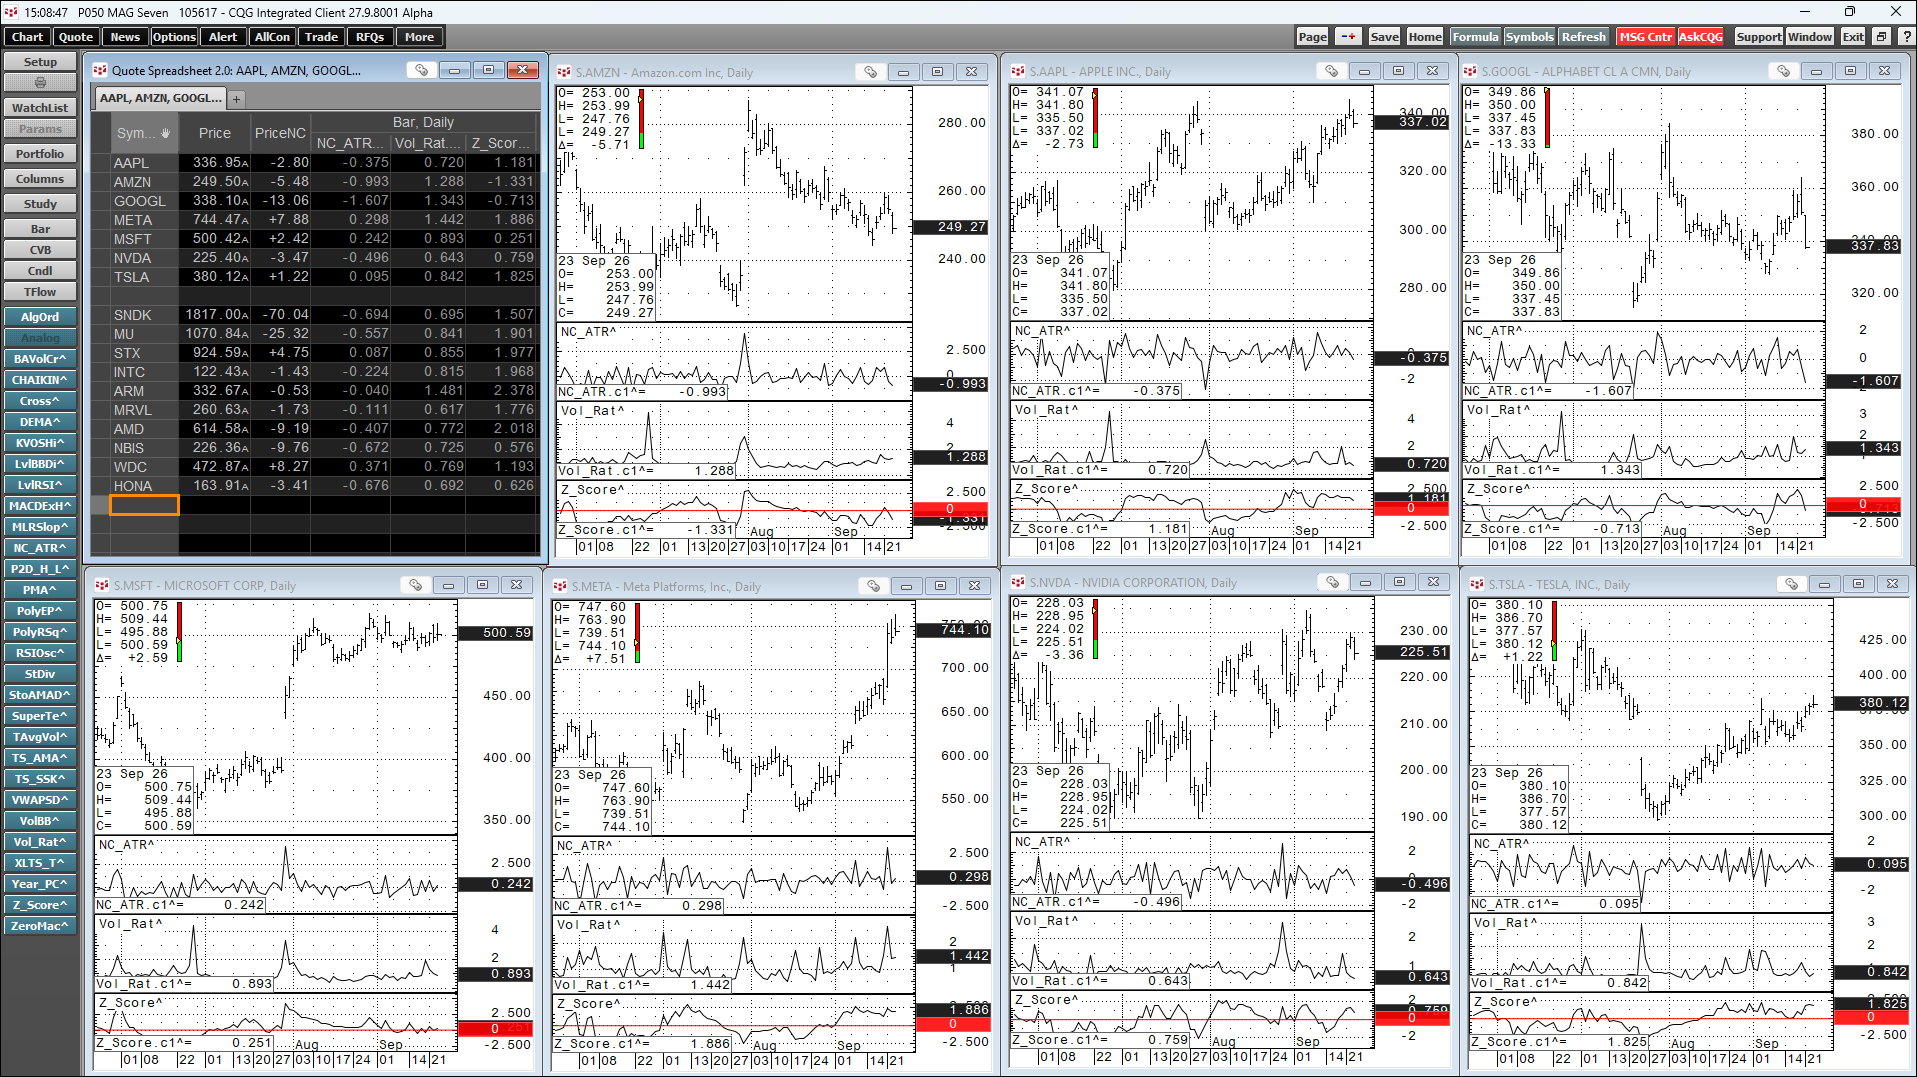
The downloadable PAC is a page with the Mag 7 stocks and the three studies looks like this:
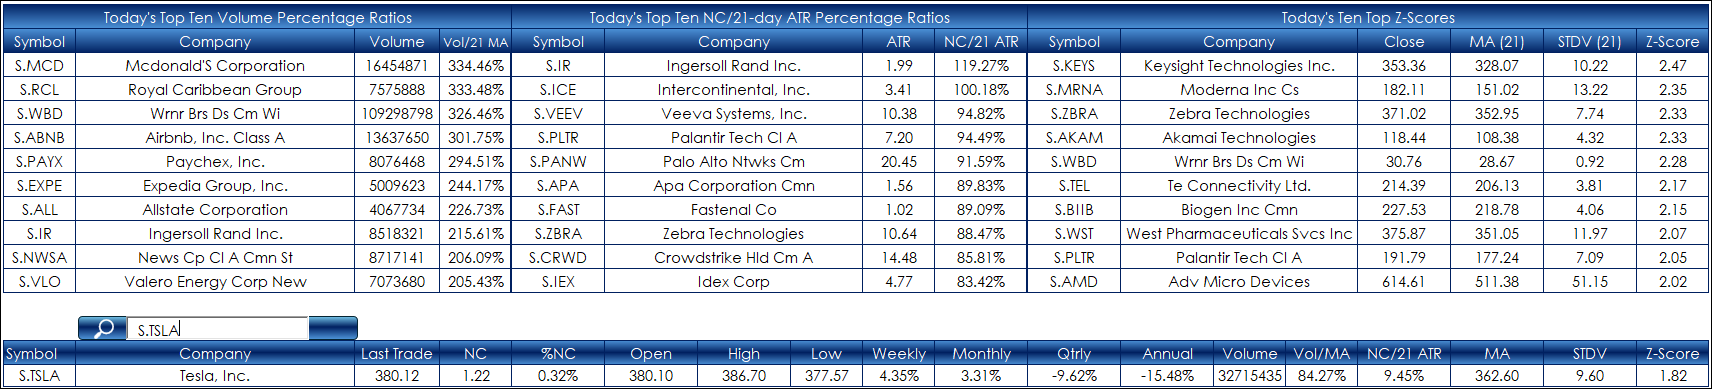
Customers interested in using Excel to screen a collection of markets, such as the stocks in the S&P 500, can download this Excel spreadsheet and automatically see the top ten performers using these three studies. The spreadsheet is here.
Requires CQG Integrated Client or CQG QTrader.