This post presents a macro enabled Excel Light Crude Oil dashboard using combined functionality detailed in previous Workspace posts. The dashboard uses numerous RTD calls for today's market action for symbols listed on the Display tab.
The dashboard is not password protected. The left side of the Display tab presents market data for crude oil using wildcard symbols in the first column for the first three years of the monthly contracts. All of the RTD formulas use the symbols in the first column.
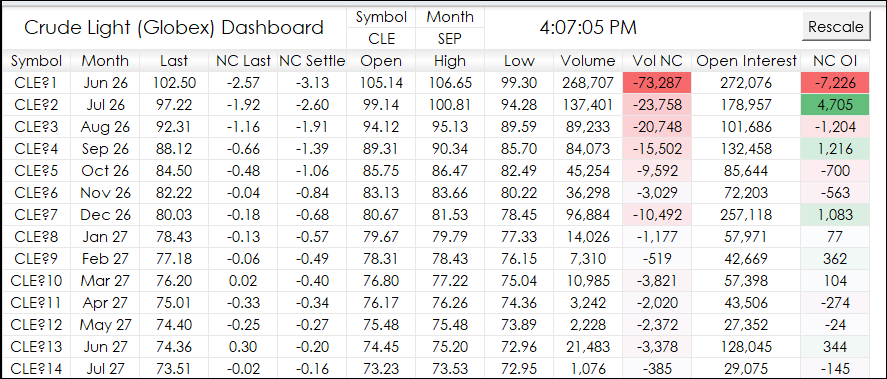
The right side of the Display tab presents two forward charts with the net change for the current session. The prices are from the Data tab.
Below is the image of the Data tab. The Data tab lists all symbols for CLE.
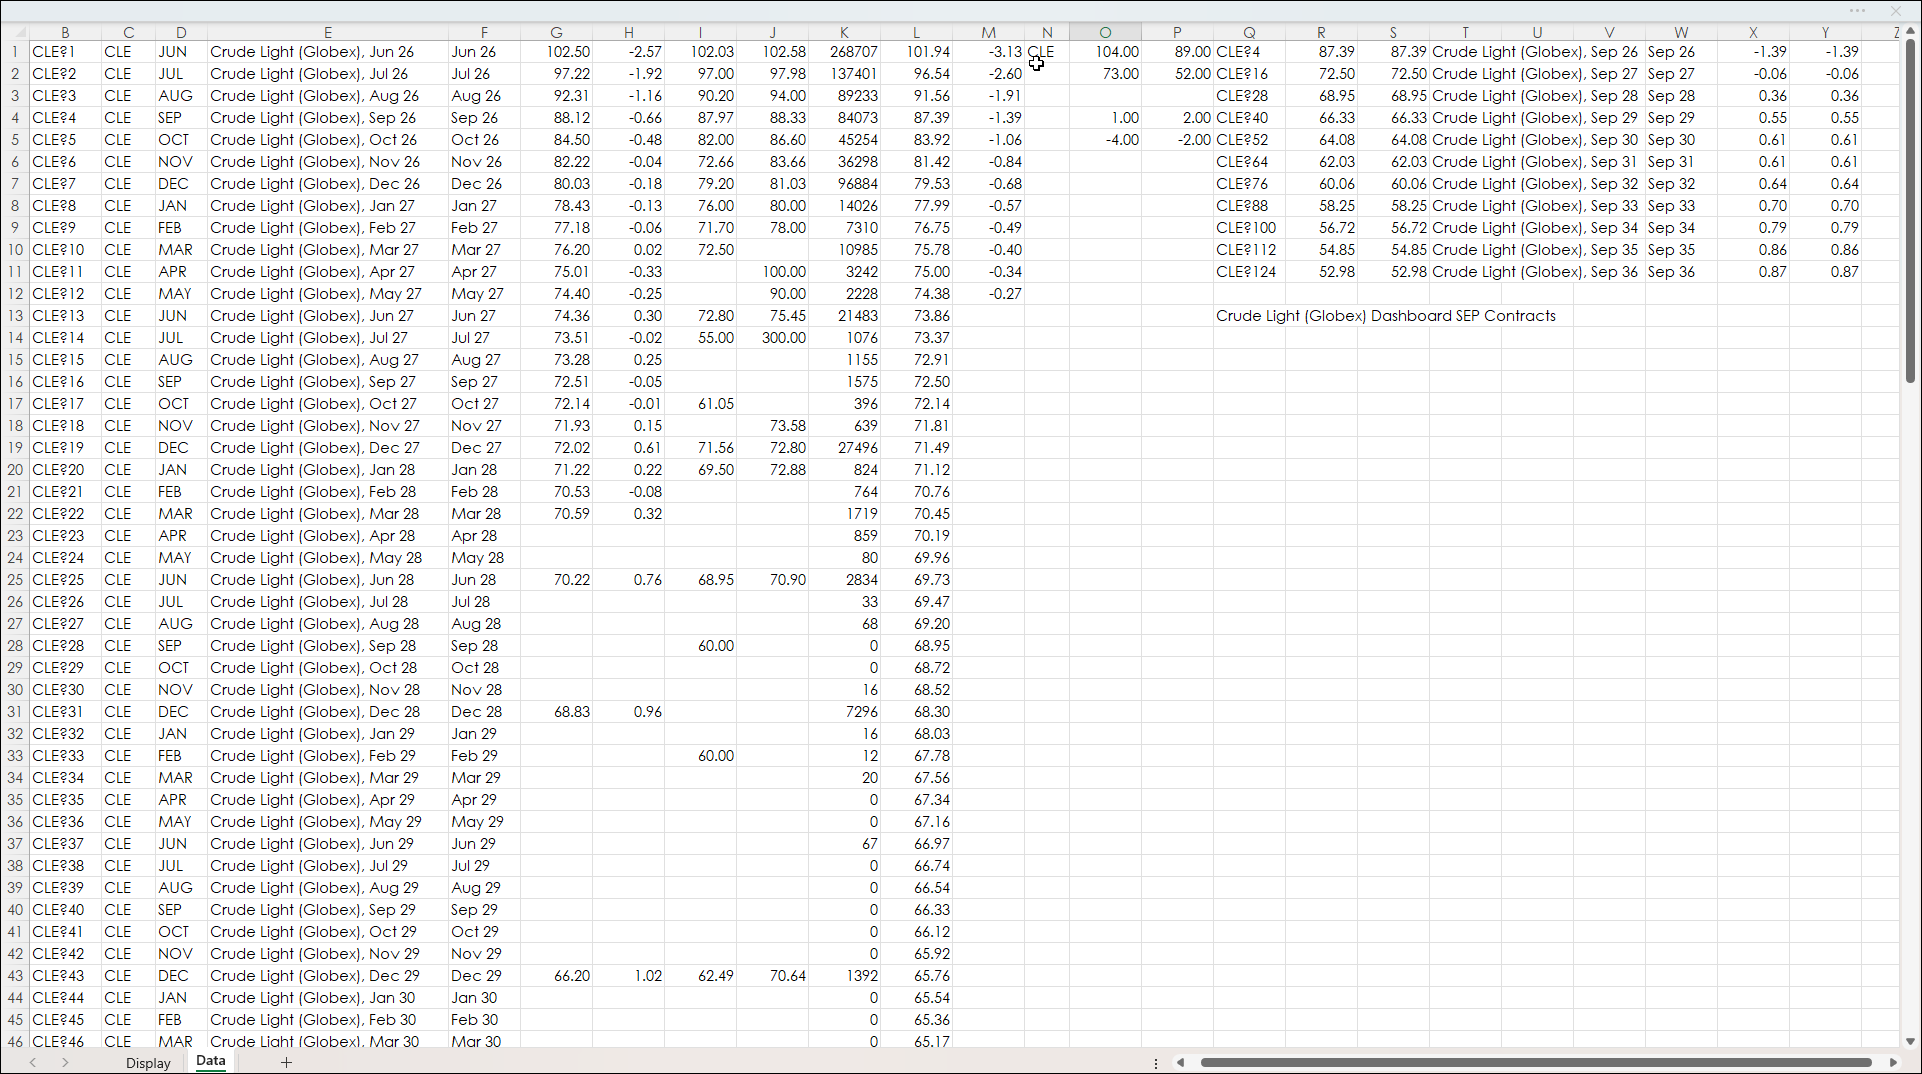
The left hand side is market data. If you want to change the RTD formulas the best source is this post: RTD: The Fastest Way to Find Market Data Labels
The right hand side of the Data tab is using Excel's FILTER function to pull symbols based on two conditions: The contract root symbol and the month (not including the year).
The Month is entered on the Display tab using three letters.
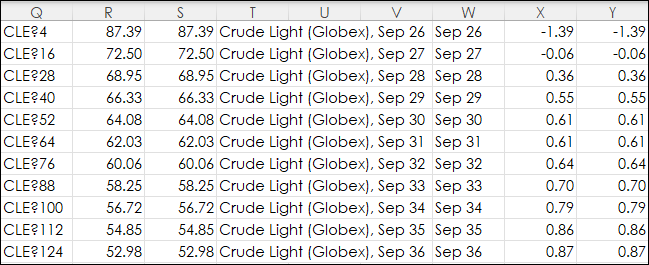
The FILTER function entered in cell Q1 and is finding September contracts (from the Display tab) and spills the symbols down in column Q (shown in the image below).
=FILTER(Data!$B$1:$B$130,((Data!$C$1:$C$130=Display!F2)*(Data!$D$1:$D$130=Display!G2)))
For more information about using the FILTER function with two conditions see: Excel Agriculture Dashboard Using the FILTER Function (Part II)
For the Forward Curve chart on the Display tab the last price is pulled into column R and S using the symbol in column Q. Column R uses an "IF THEN" function and if the cell in column Q is blank the cell in Column R displays the #N/A error and the chart on the Display tab will skip that data point. Column S will display a blank cell for the data label in the chart.
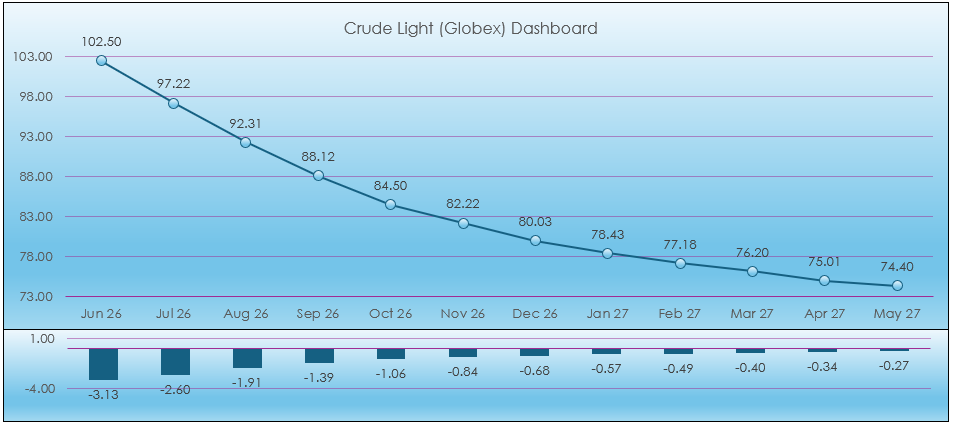
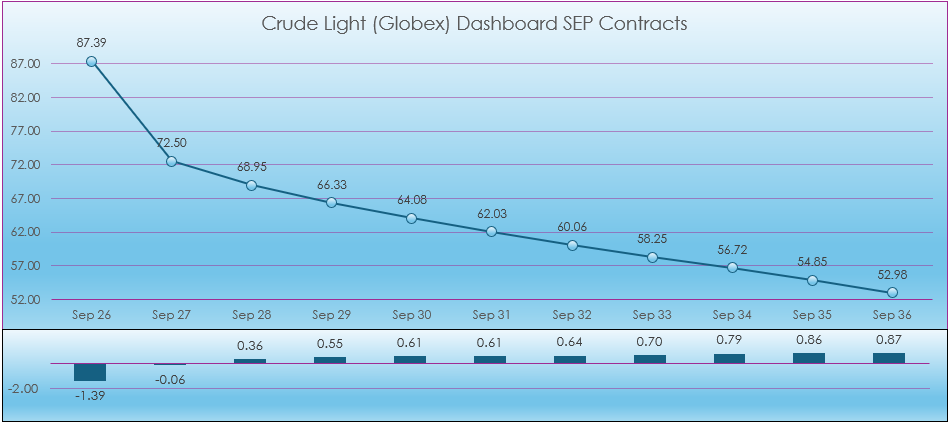
The image below shows the Forward Curve for all of the September contracts. This data fully populates after the close of the primary session when settlements are posted.
For more information regarding build forward curve charts in Excel see: Excel Forward Curve Charts.
The image below shows the Forward Curve chart for the September contracts. Notice, the dates are three letters and the year. That is from column W above. To extract just the month and year from the long description in column T the REGEX function is used.
Read this post for more details regard using REGEX: Excel 365 Functions REGEXEXTRACT & REGEXREPLACE and AI.
Here is the full image of the Display tab. Press the Rescale button and the macro will rescale the charts.
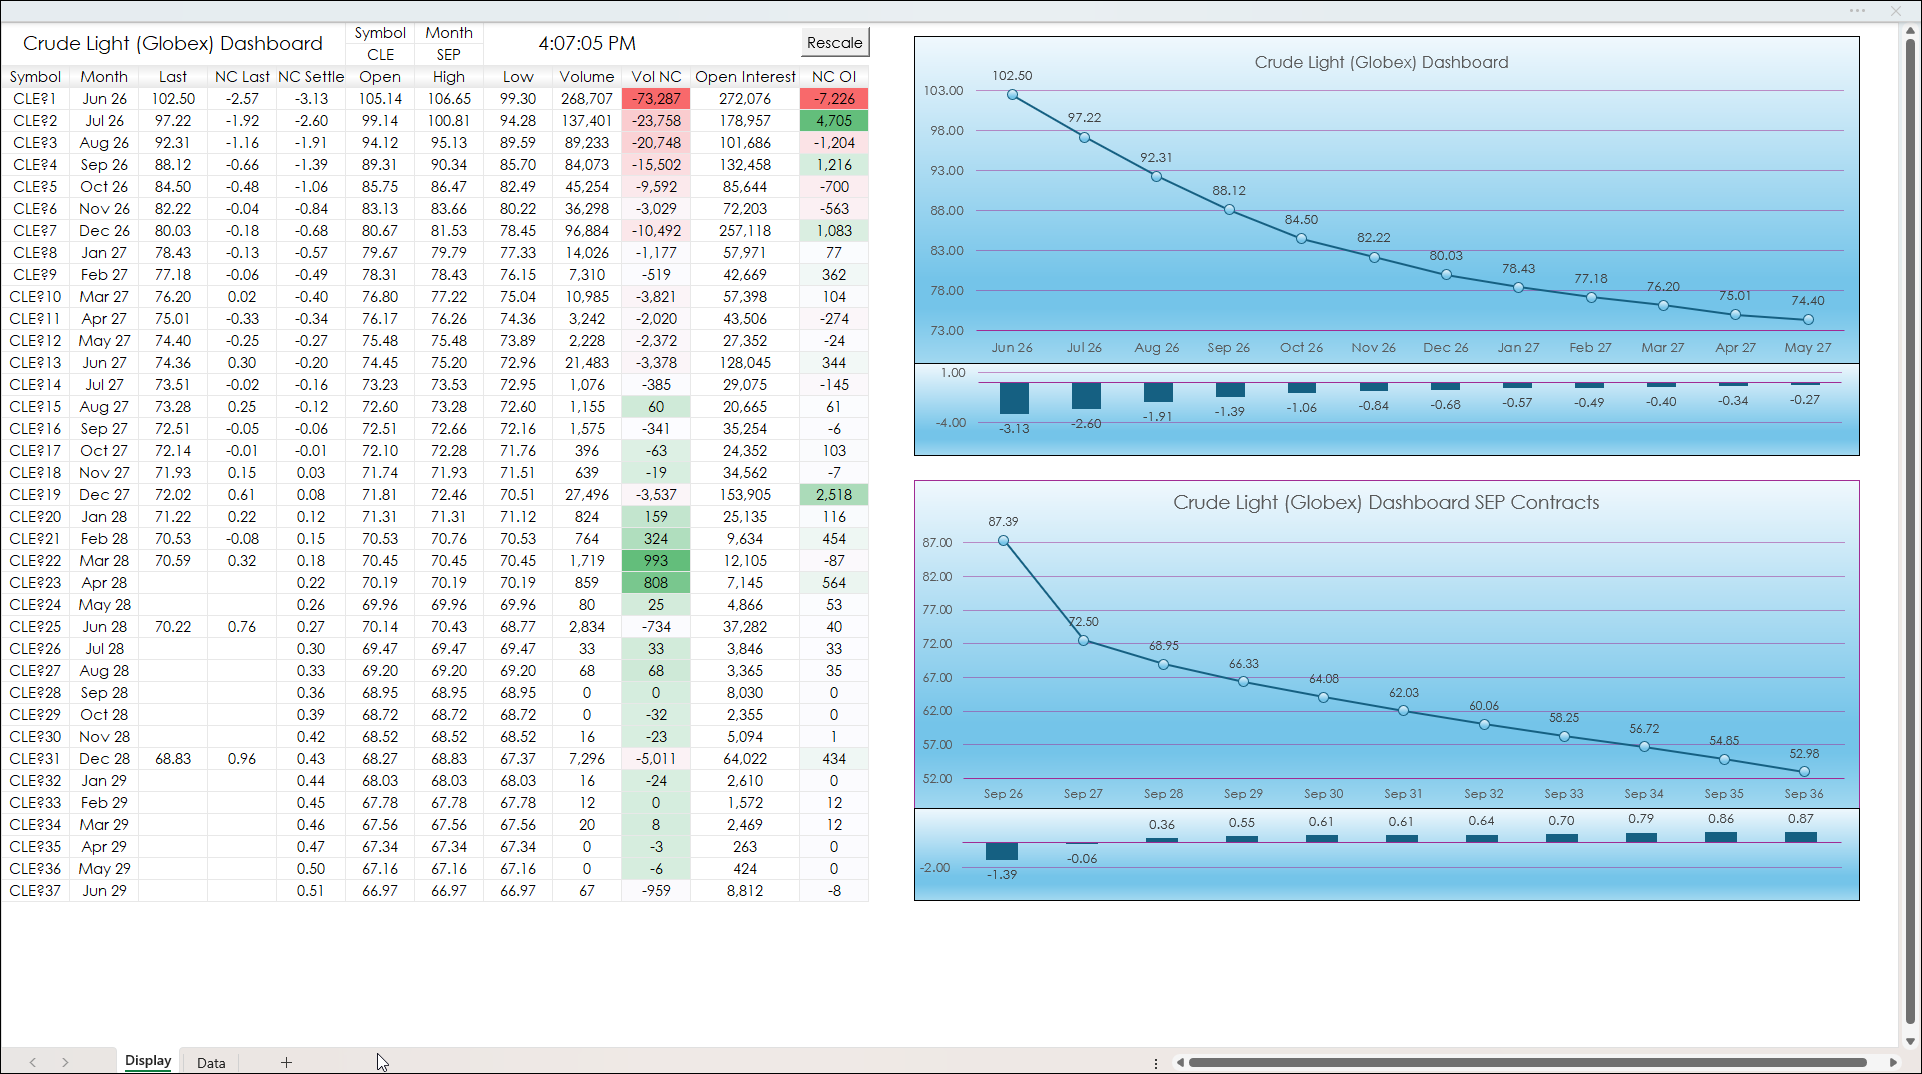
This post walks through the posted dashboard detailing the steps to create Forward Curve Charts by the first 12 contracts and by month.
Requirements: CQG Integrated Client or QTrader, exchange enablements for the CME Group, and Excel 365 (locally installed, not in the Cloud) or more recent.