This post builds upon the post: Excel Agriculture Dashboard Using the FILTER Function.
The original post built market quote display blocks using a data tab with specific row ranges employed for pulling in symbols. This post uses the entire set of rows on the data tab to search for symbols using a wild card technique for the markets by group and a second search for the specific month within the group.
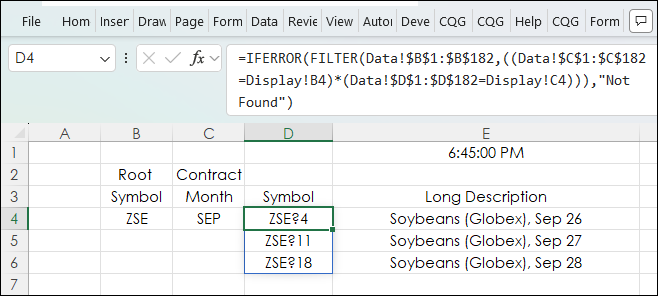
The symbols for each month within the group are pulled from the Data tab to the Display tab. For example, at the time of this writing, for symbol ZSE and the month SEP entered in the Display tab returns symbols for Soybeans (Globex), Sep 26, Soybeans (Globex), Sep 27, and Soybeans (Globex), Sep 28.
Above, "a wild card technique" is mentioned. CQG's version of wildcards are the symbol (ZSE) with (?) and the month number (i.e. 1) for the first month. Excel has a wild card feature. For example, ZSE* will find ZSE and ignore letters and number following ZSE. However, the post is using the FILTER function and if a wildcard such as ZSE* is used then the function looks for ZSE* and returns an error because none of the symbols are actually ZSE*.
The fix is to use symbols with the CQG wildcards, so they roll, but in another column remove the ? and number.
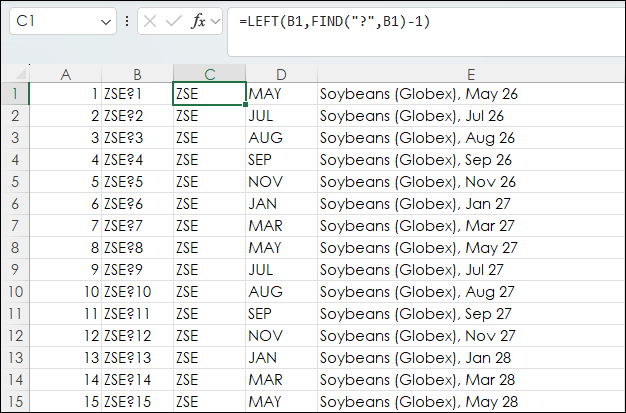
Column C is removing the ? and the number using:
=LEFT(B1,FIND("?",B1)-1)Column C is the wildcard version for the group and Column D is the contract month using column B.
=RTD("cqg.rtd", ,"ContractData",B1, "ContractMonth",, "T")On the Display tab the Filter function is used to find the symbol based on the root symbol in cell B4, B10, B16, etc., and the month in cell C4 , C10, C16, etc., from the Data tab.
=FILTER(Data!$B$1:$B$182,((Data!$C$1:$C$182=Display!B4)*(Data!$D$1:$D$182=Display!C4)
The Filter function is looking for the root symbol in column C and the month in column D and returns the symbol from column B.
In case the symbol is not found then the IFERROR function is used and returns "Not Found".
=IFERROR(FILTER(Data!$B$1:$B$182,((Data!$C$1:$C$182=Display!B4)*(Data!$D$1:$D$182=Display!C4))),"Not Found")
The Filter function is entered into one cell and "Spills" down the column. If the cells are not empty an error occurs.
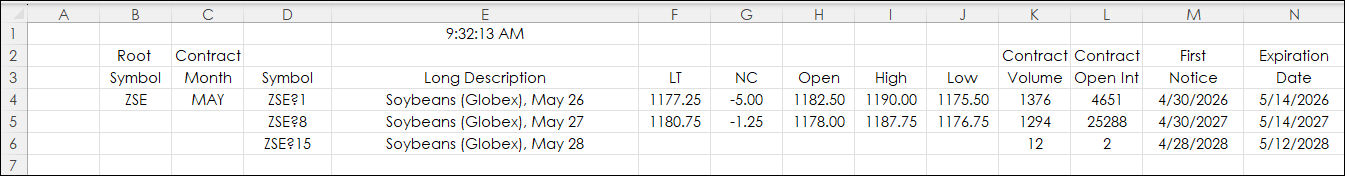
Column E is the RTD call for the Long Description. If the symbol is not found or a blank cell is shown, then a series of "IF Then" are used for all of the RTD calls. For example:
=IF($D$4="Not Found","",IF(D4="","",RTD("cqg.rtd", ,"ContractData",D4, "LongDescription",, "T")))Sometimes there are just two occurrences of the same month in the group and sometimes there are as many as four occurrences. The addition of the two "IF Then" produces a cleaner dashboard by displaying blank cells.
This is one group for ZCE:
The other RTD calls for market data use the same set of "IF Then" to return a blank cell instead of an error. For more details regarding calling RTD Market Data can be found here: RTD: The Fastest Way to Find Market Data Labels.
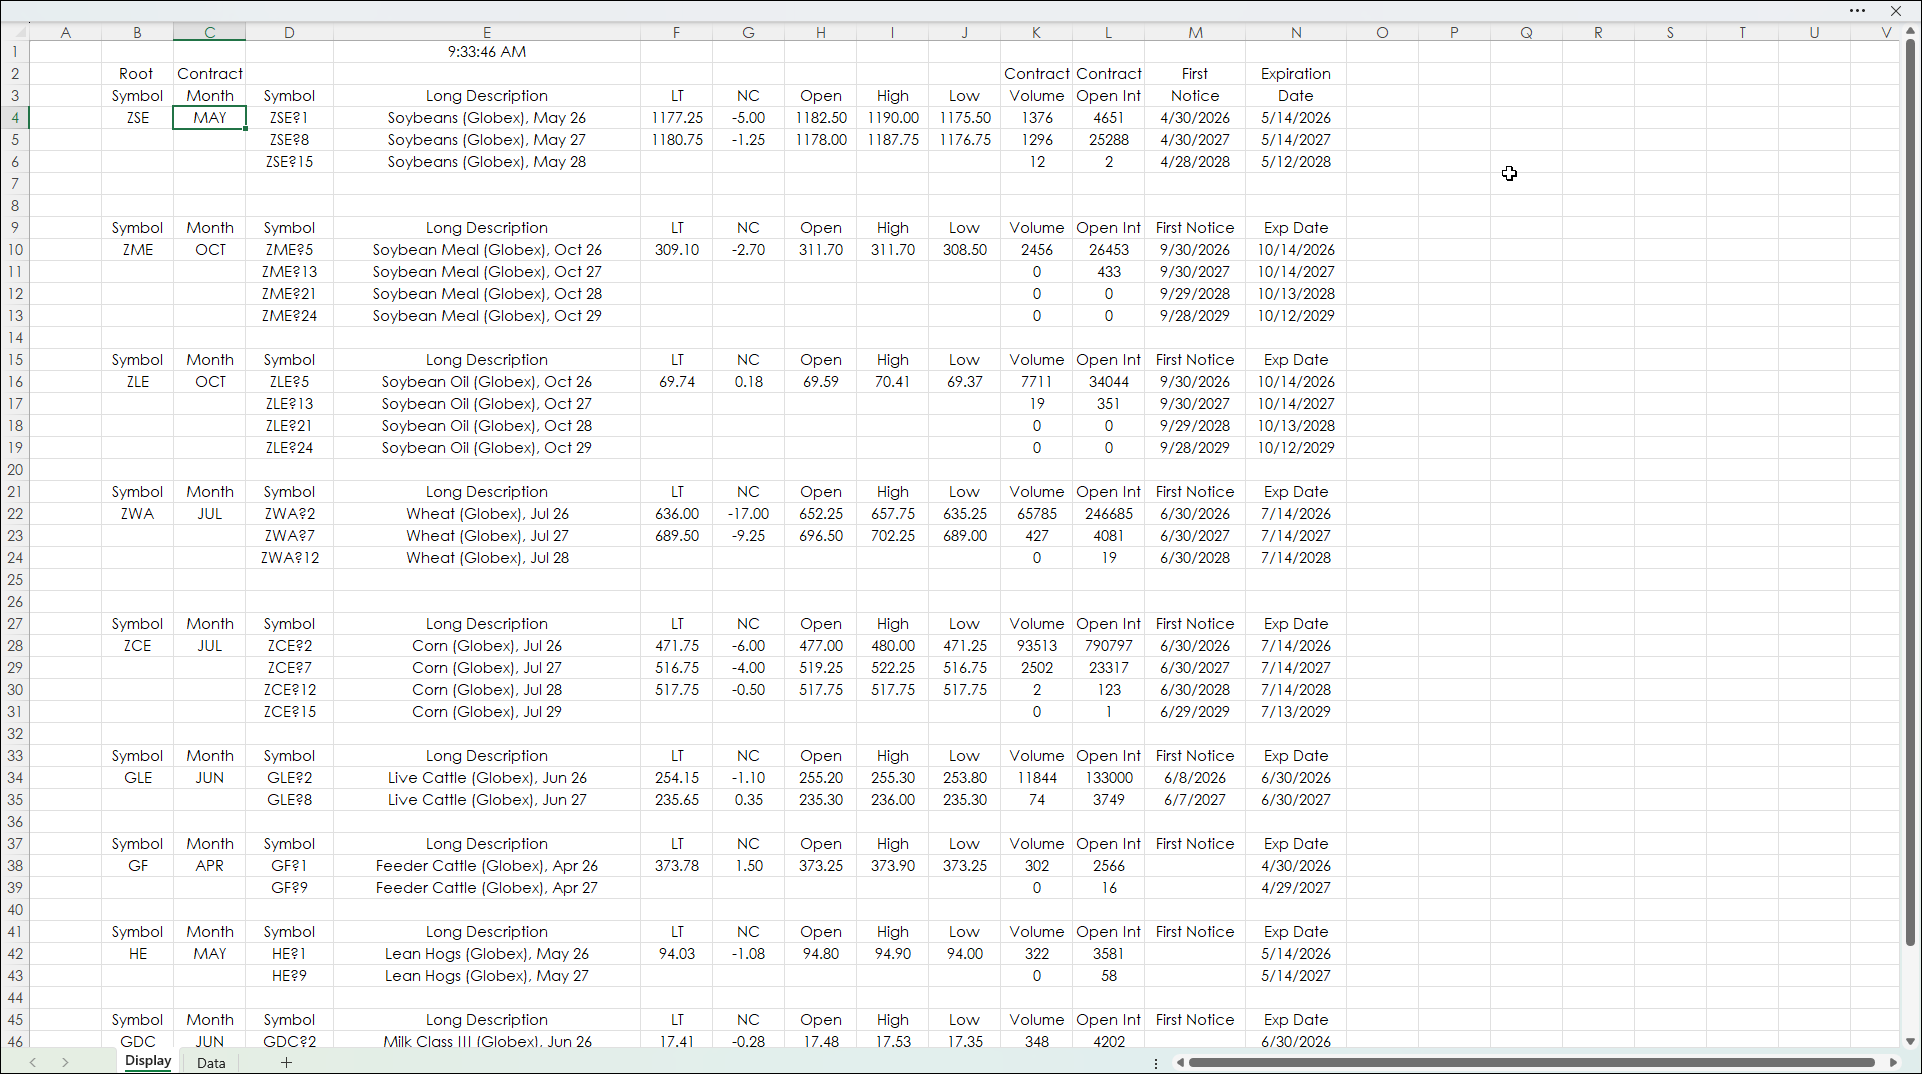
Here is the full dashboard.
This post presented the steps to using the Excel FILTER function based on two conditions.
Requirements: CQG Integrated Client or QTrader, exchange enablements for the CME Group, and Excel 365 (locally installed, not in the Cloud) or more recent.
This post was assisted by AI and reviewed by Thom Hartle.
Downloads