The CQG Statement Reports Add-In is installed with CQG IC and QTrader. This add-in works with CQG’s Statement Report generated from the Orders & Positions window.
Once you… more
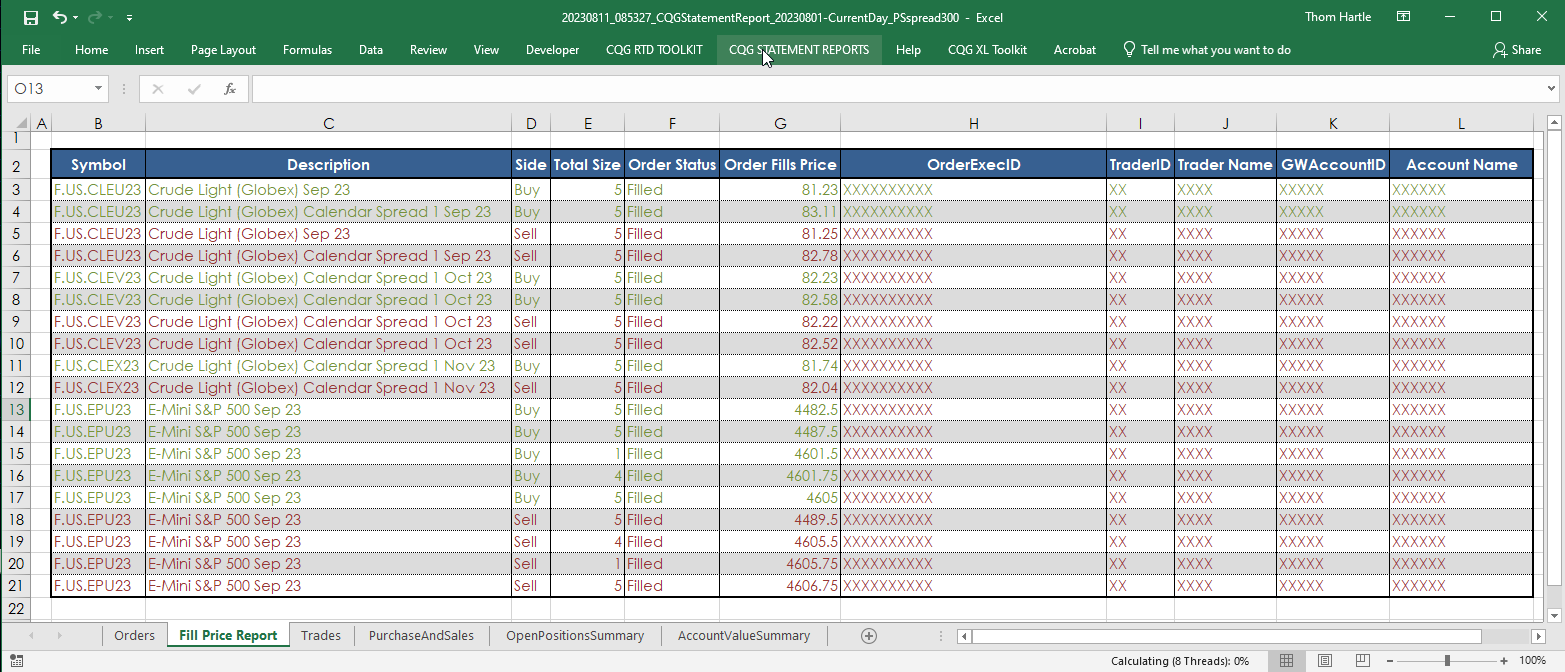
The CQG Statement Reports Add-In is installed with CQG IC and QTrader. This add-in works with CQG’s Statement Report generated from the Orders & Positions window.
Once you… more
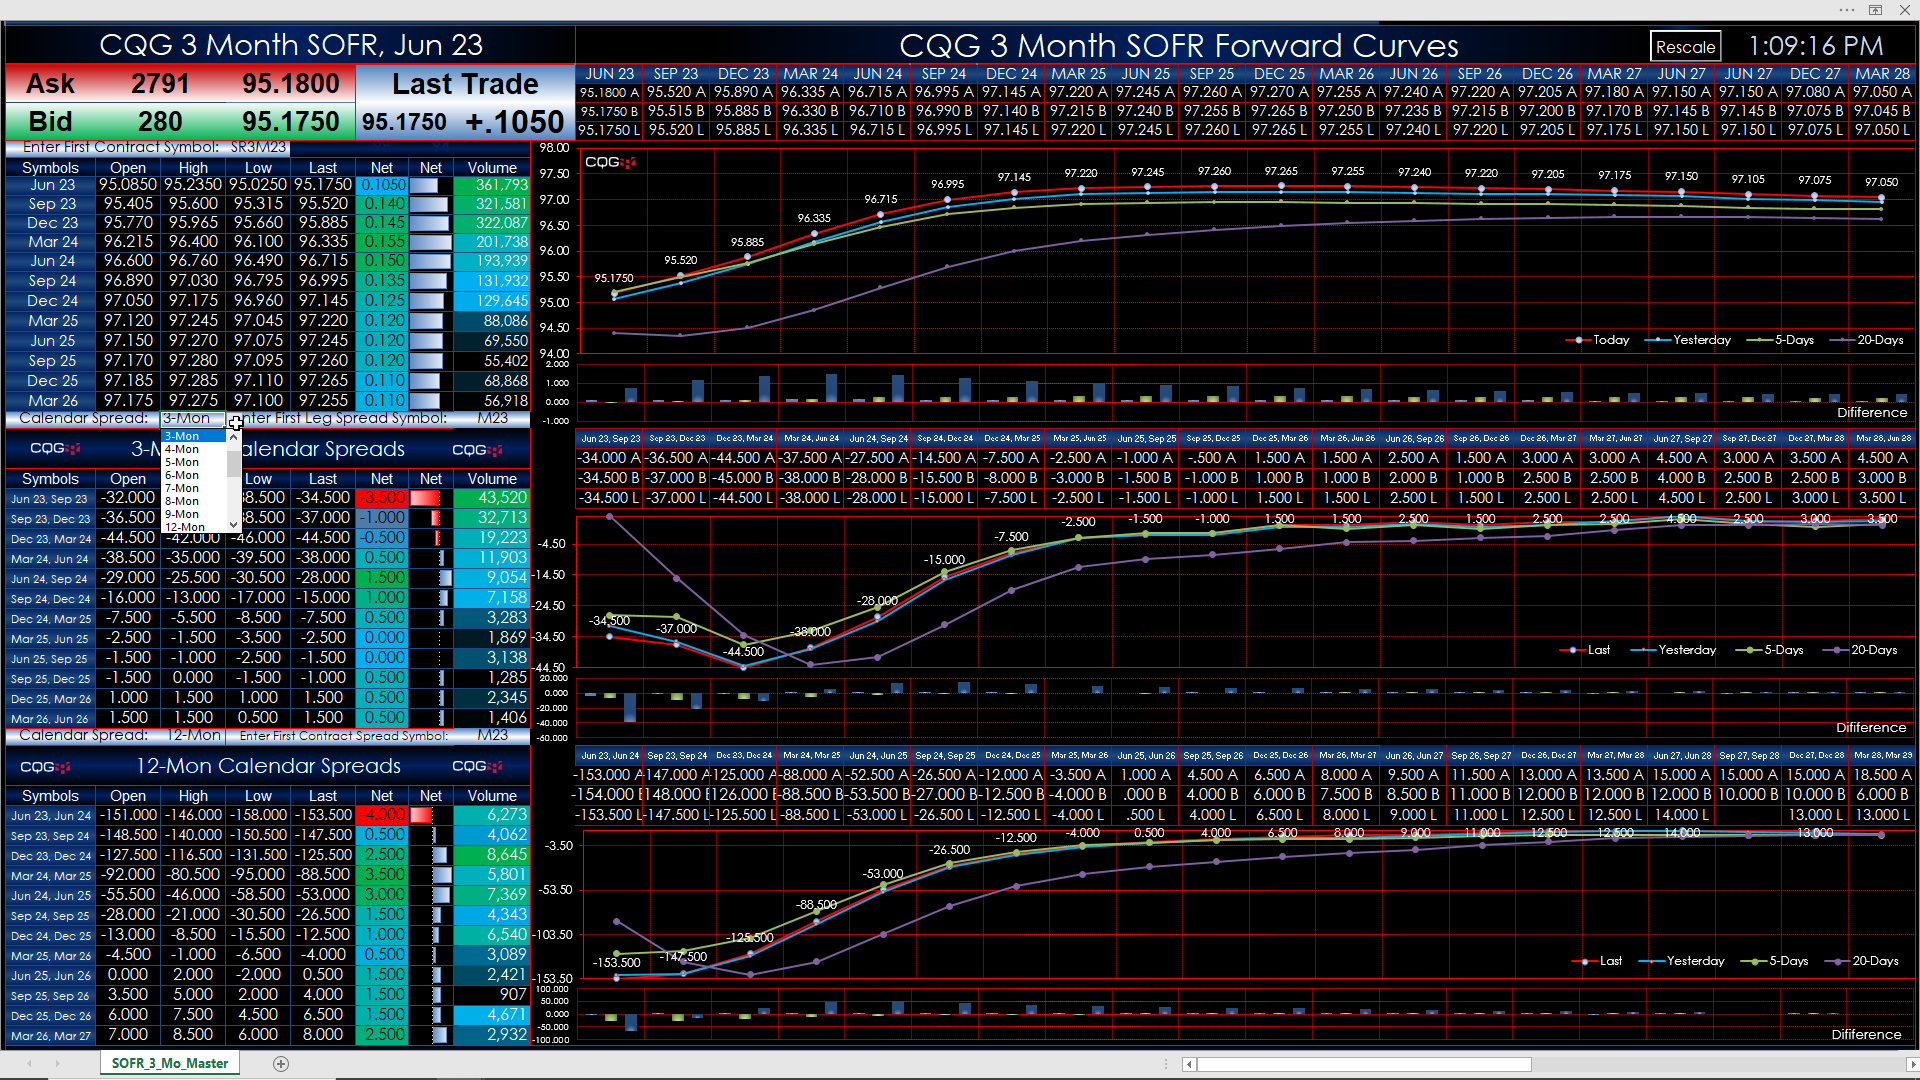
This Microsoft Excel® dashboard pulls in the 3-month SOFR market data traded on the CME Globex platform.
The Dashboard was updated to enable the user to enter in the symbol for the first… more
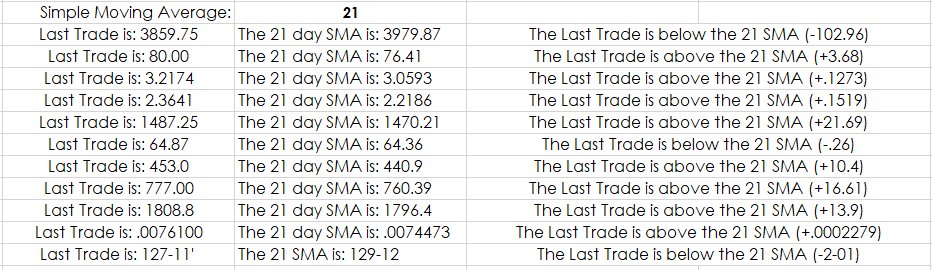
Microsoft® Excel has a Text function which is useful for combining text with market data. For example, you may want to have your Excel dashboard display in the same cell the percent net change… more
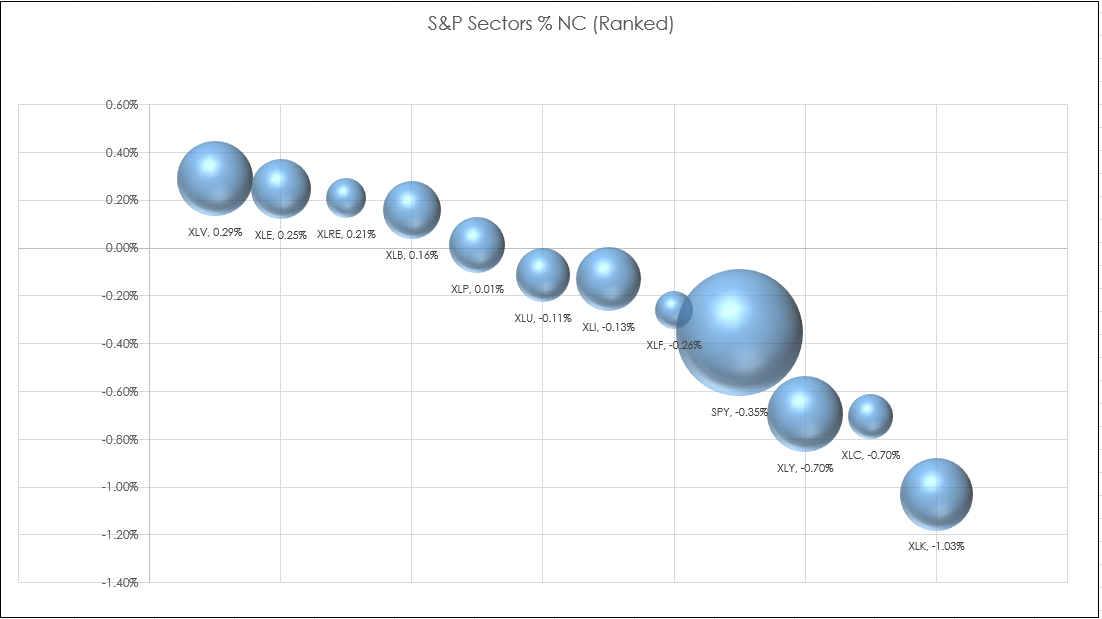
The Microsoft® Excel 3-D chart is different from the Excel Scatter Plot chart. The Scatter chart uses a fixed size for the chart data points. The 3-D chart accesses an additional column to set the… more
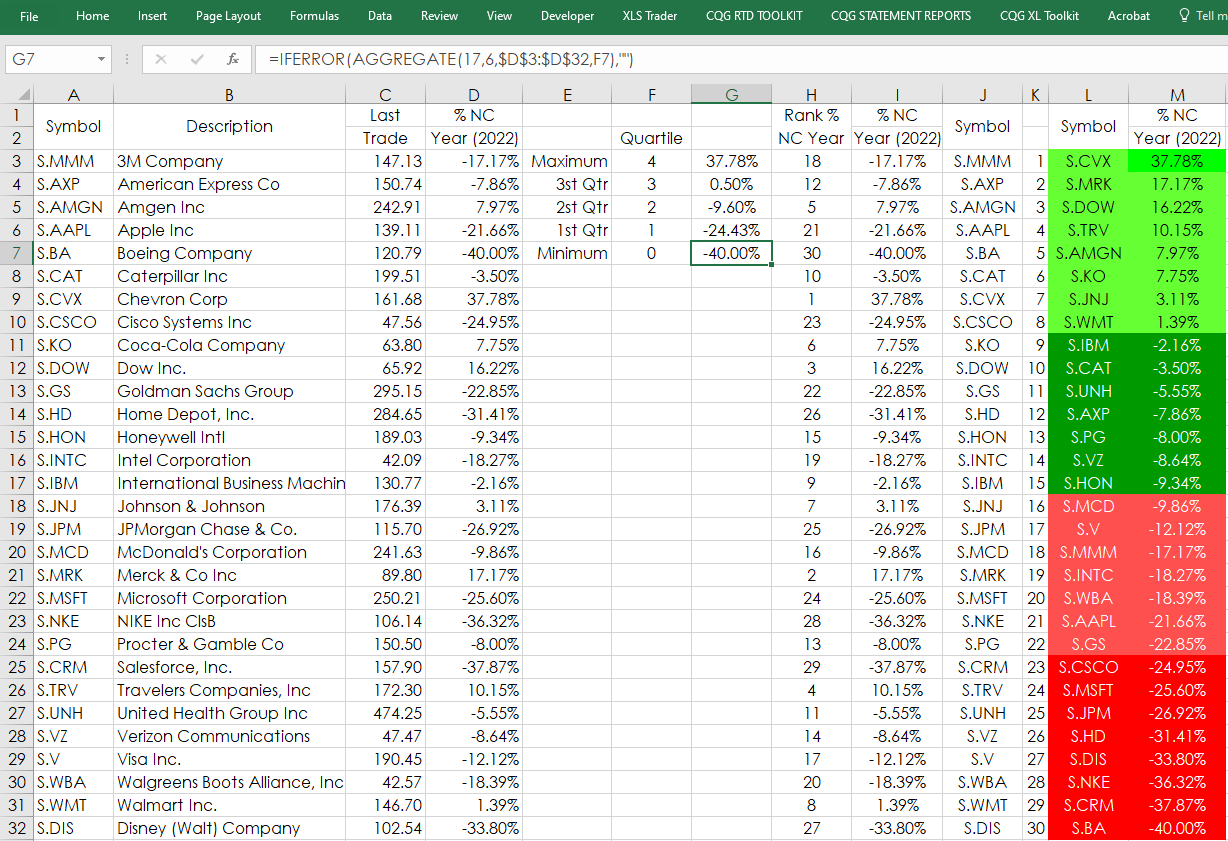
The Excel AGGREGATE function returns an aggregate calculation such as AVERAGE, COUNT, COUNTA, MAX, MIN, PRODUCT, etc., applied to a list of data while optionally ignoring hidden rows and errors.… more
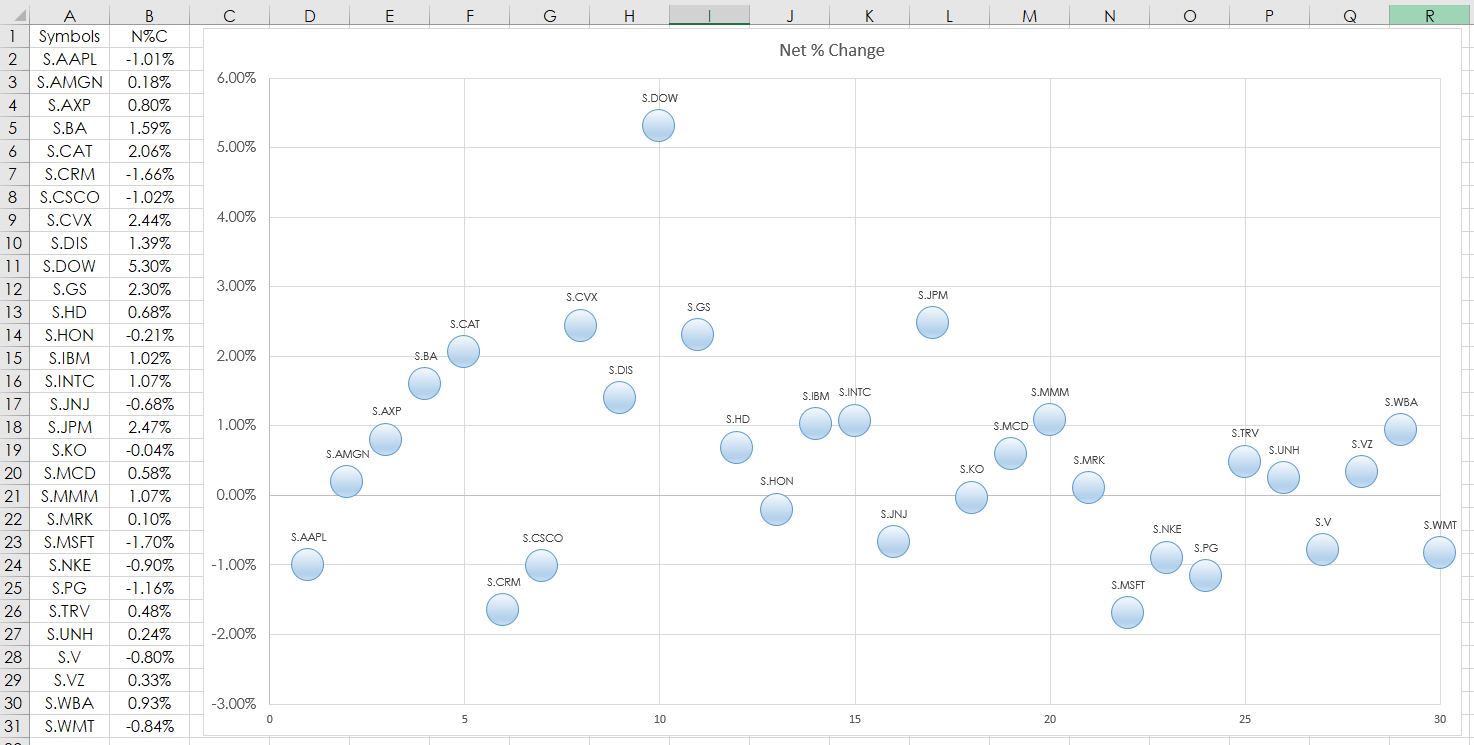
This post details using the Microsoft® Excel “Scatter Plot” Chart to track market performance. In this example, RTD formulas are used to pull in the percent net change of the 30 stocks that are in… more
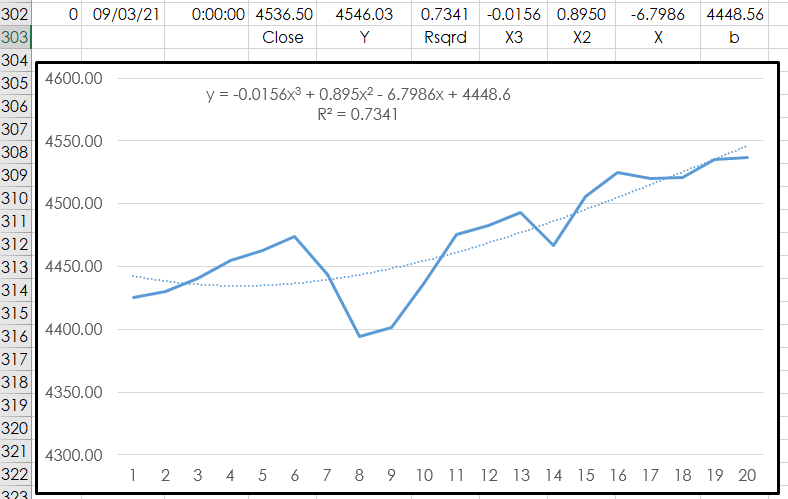
This article walks you through using Microsoft® Excel’s LINEST function to determine the three coefficients and y-intercept of a 3rd order polynomial function over the past 20 bars of closing… more
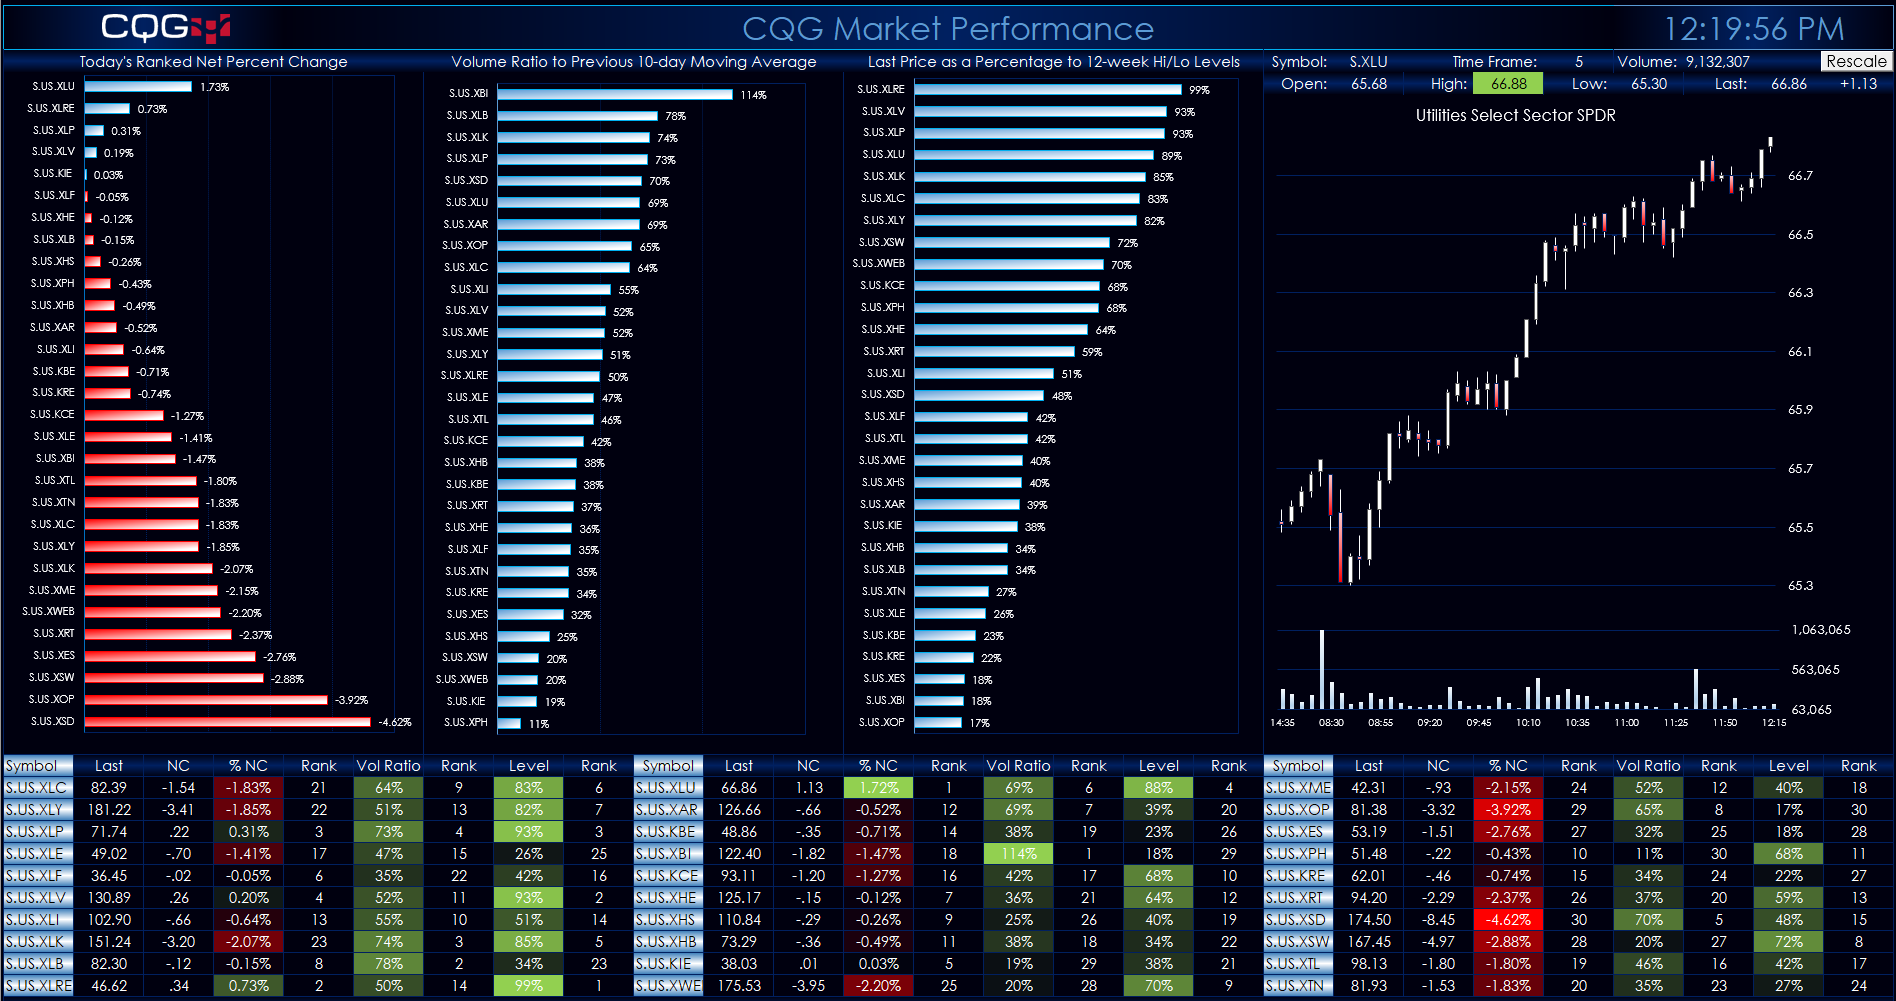
This Microsoft® Excel Dashboard comes frontloaded with 30 Sector and Industry symbols. However, you can enter in whatever symbols you like using the Symbols tab. The long description of the symbol… more
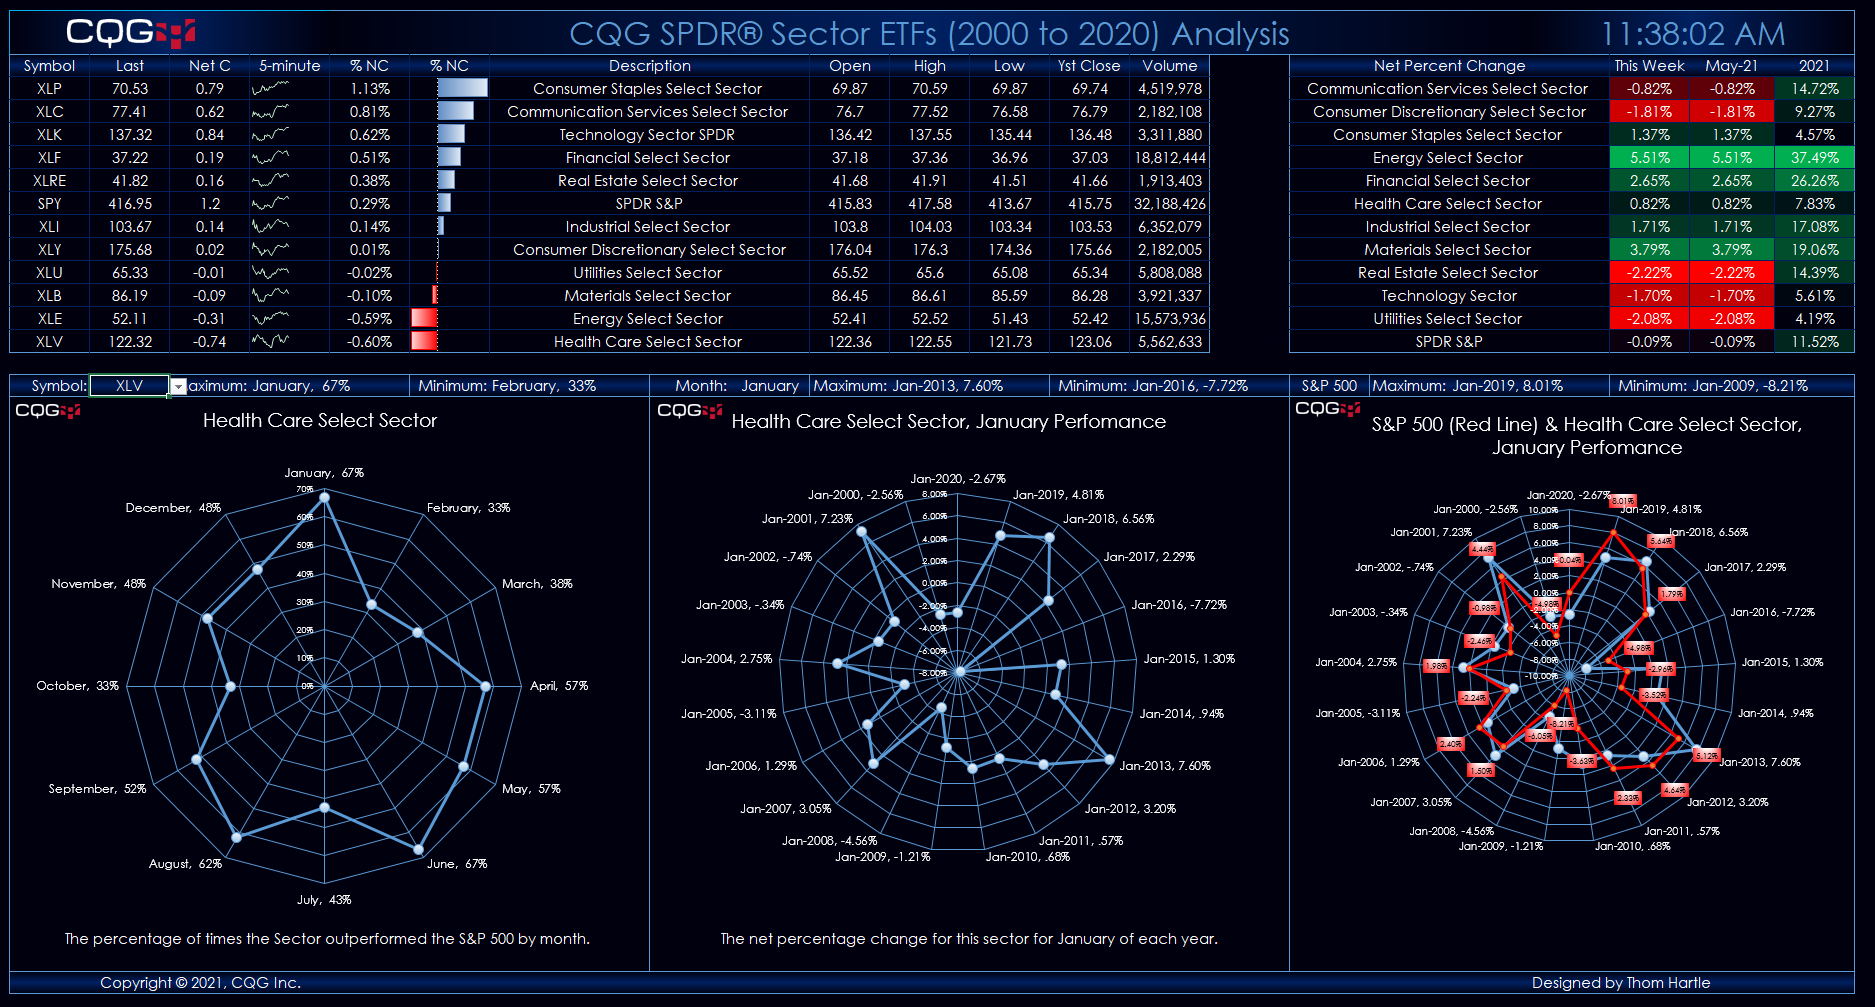
SPDR® Sector ETFs Analysis Dashboard This Microsoft® Excel dashboard provides analysis of S&P Sectors based on ETFs. The collection of ETFs are:
Symbol Description XLC Communication… more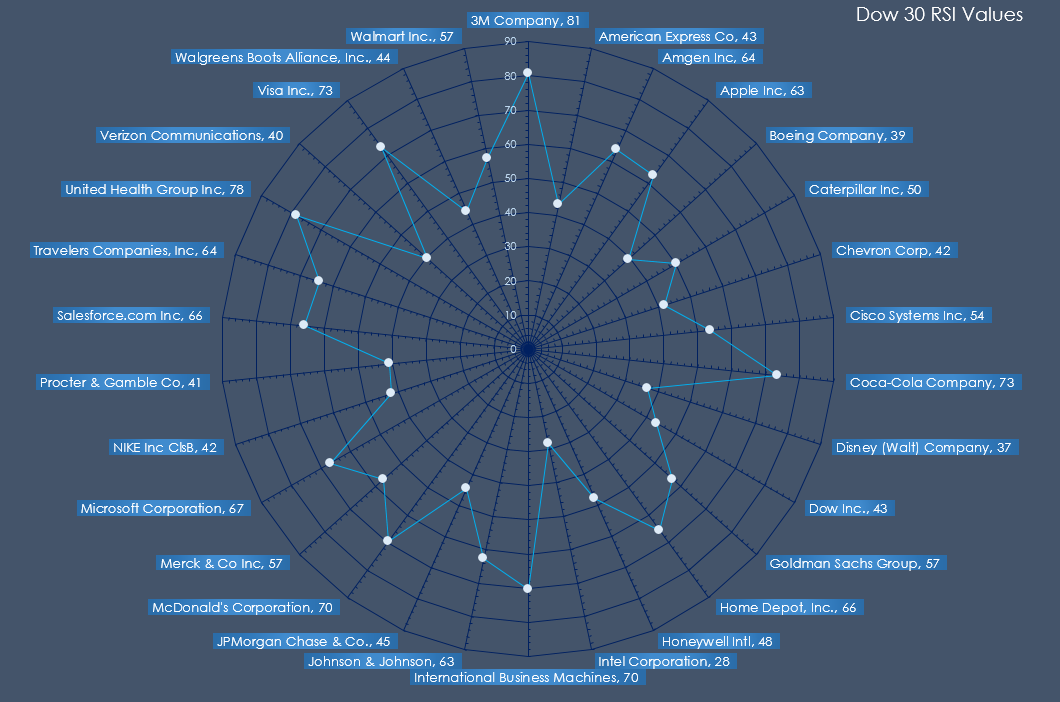
Microsoft® Excel offers the Radar Chart. This chart does not use the typical X-axis versus Y-axis. Instead, the radar chart is a graphic display of multivariate data in the form of a two-… more