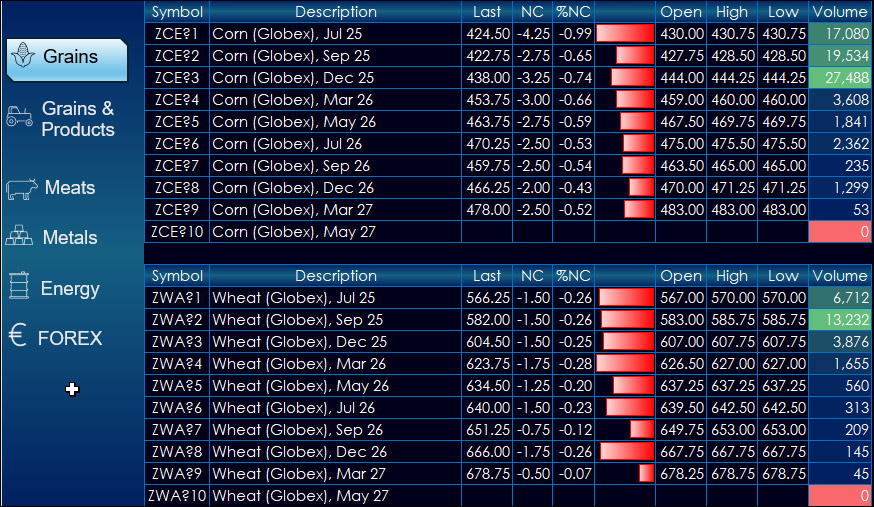
This dashboard provides market data for CME products. The dashboard uses a navigation bar instead of tabs.
The left-hand side provides market data for products. The right-hand side… more
This dashboard provides market data for CME products. The dashboard uses a navigation bar instead of tabs.
The left-hand side provides market data for products. The right-hand side… more
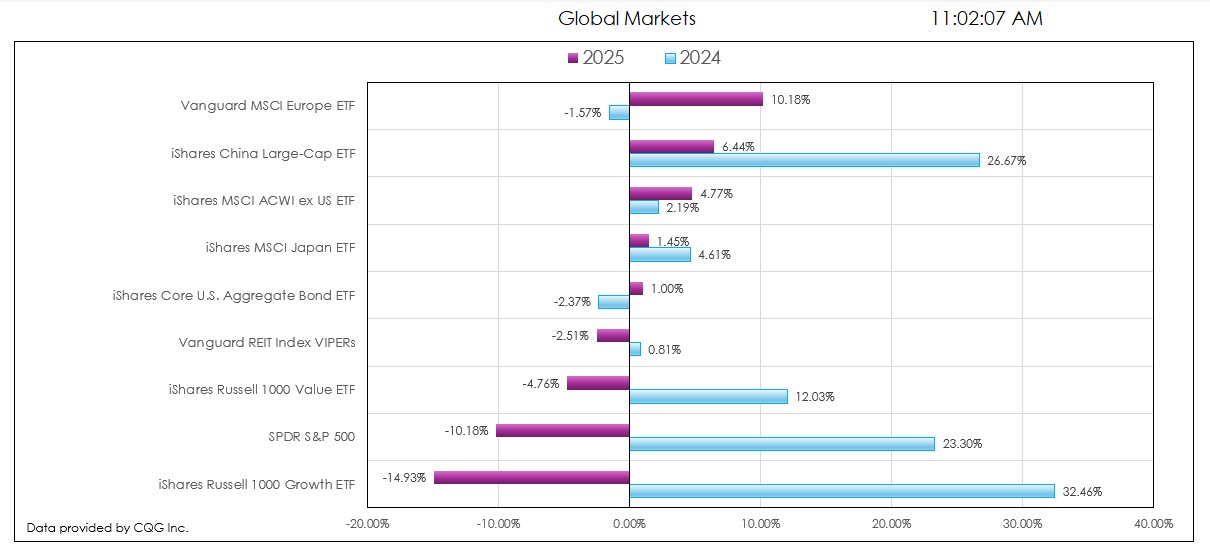
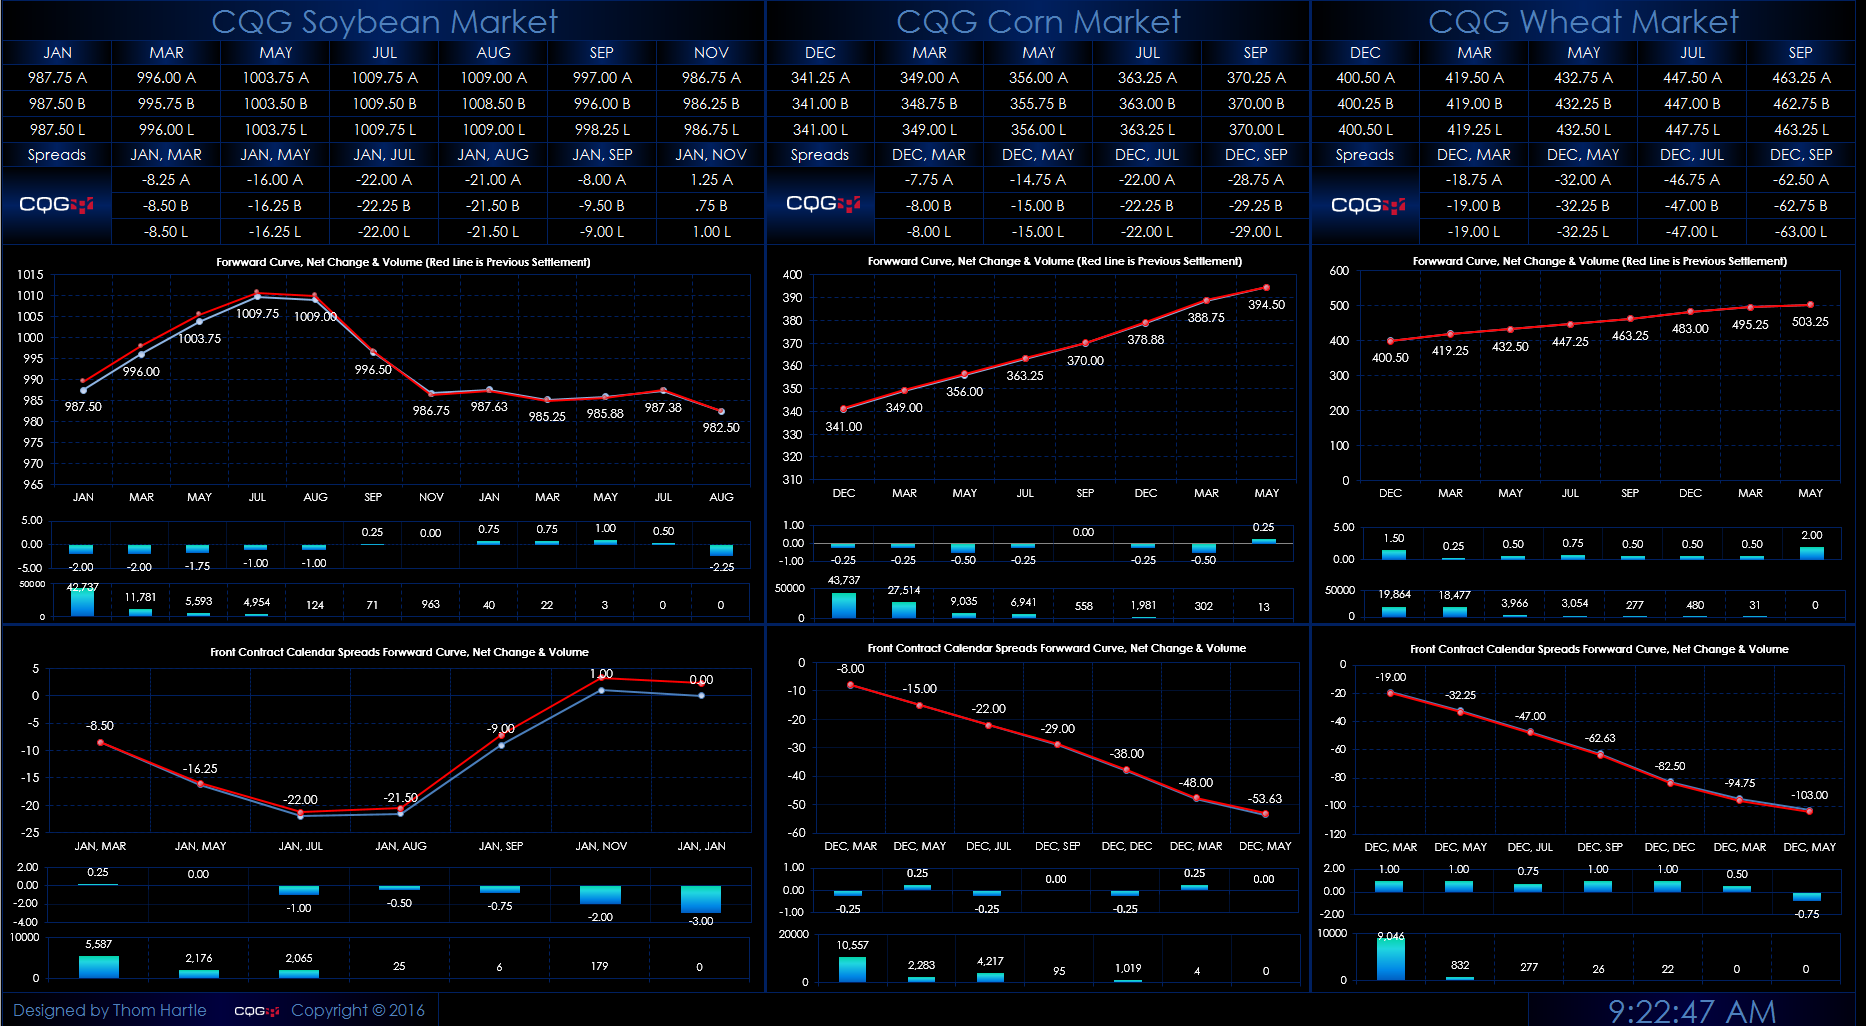
This post details the downloadable Excel Market Performance Dashboard's features and functions. The dashboard has seven tabs (the first is data and the other tabs display a chart and a table of… more
The forward curves dashboard displays futures contracts White Maize (symbol: WMAZ), Yellow Maize (symbol: YMAZ), Wheat (symbol: WEAT), Soybeans (symbol: SOYA), and Sunflower Seeds (symbol: SUNS),… more
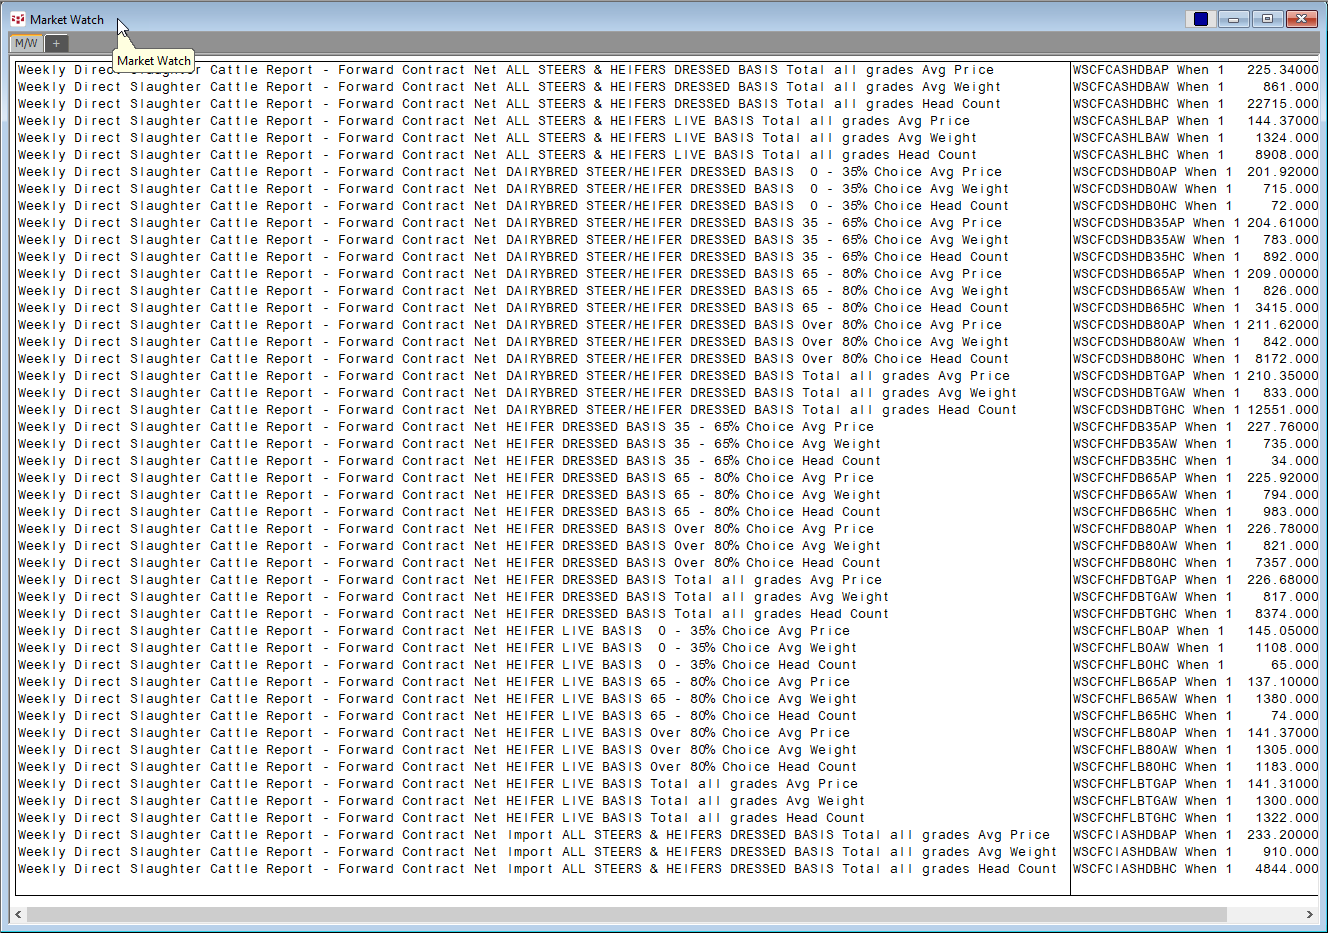
The CQG Data Quality Team has added over 1,000 USDA Cattle Market reports. The symbols are found under the USDA-WASDE group in the CQG Symbol Finder when searching for Cattle.
In… more
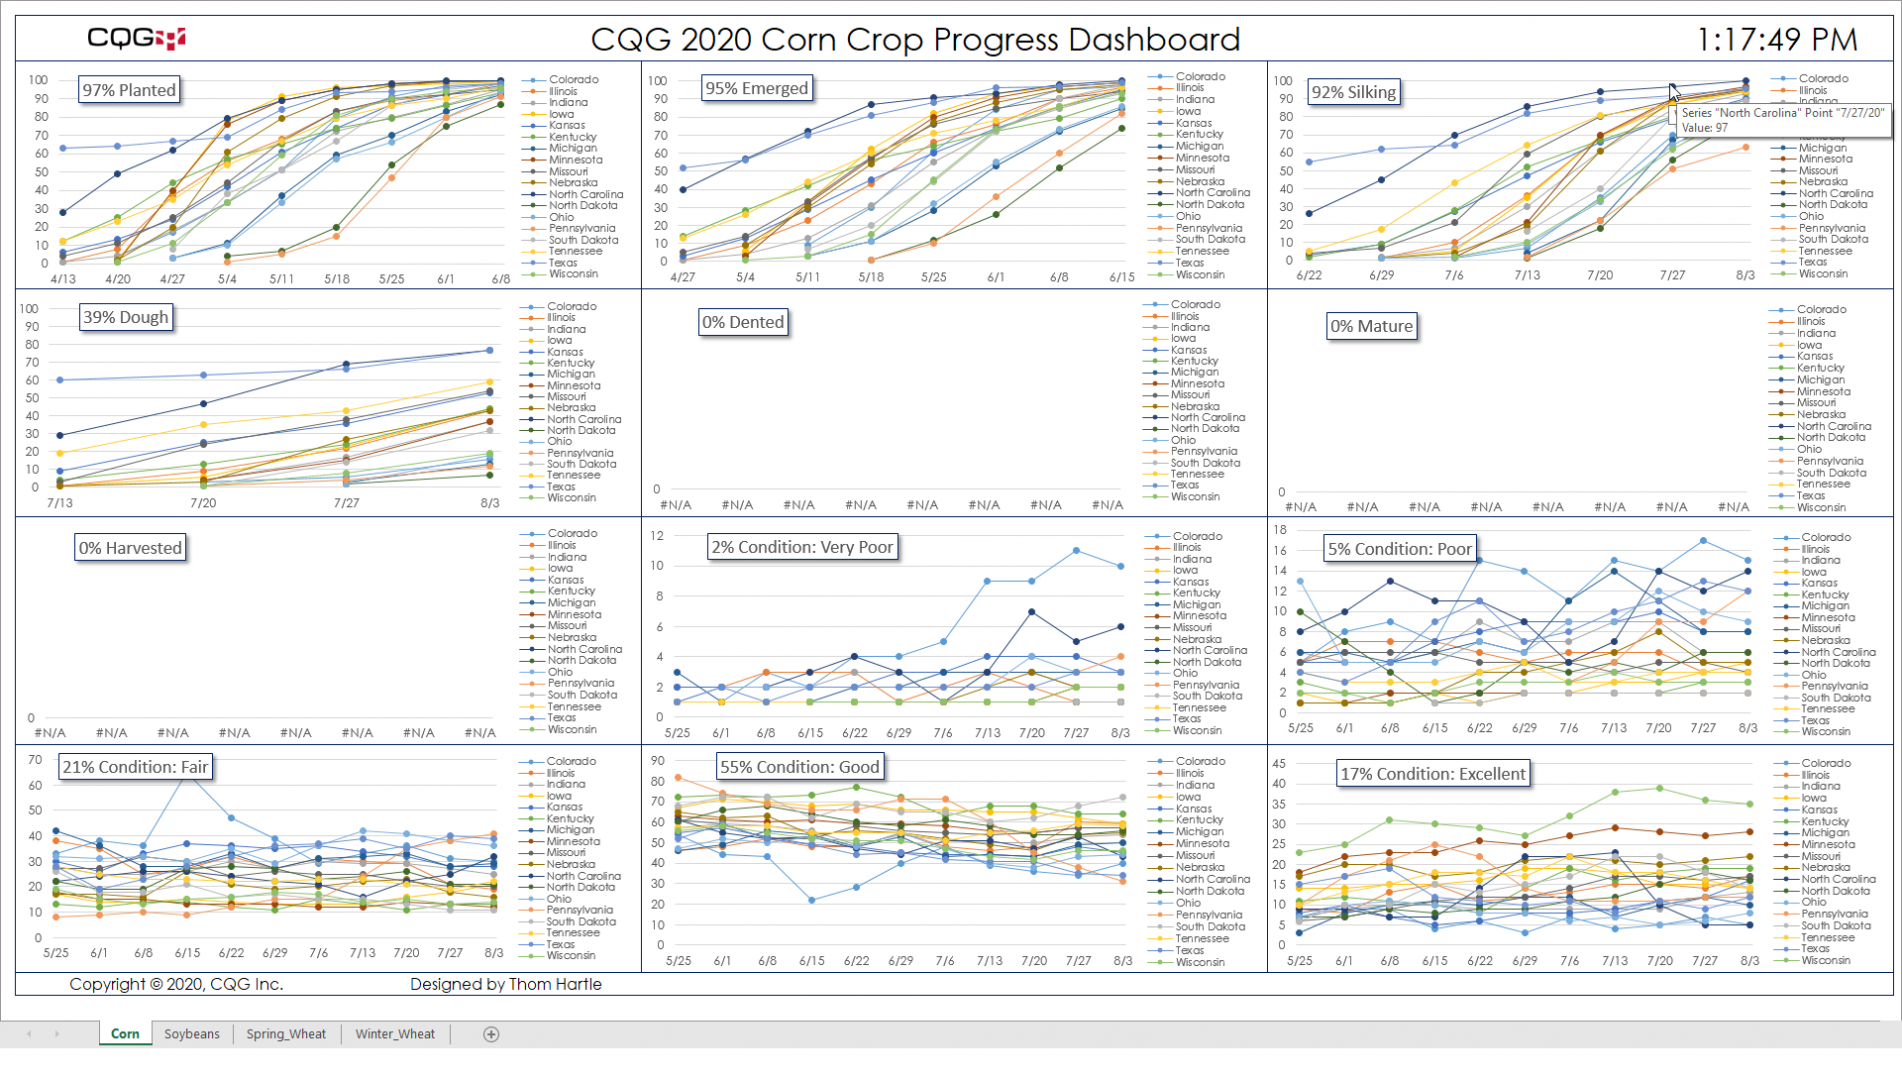
CQG has added the USDA Crop Progress weekly report to the USDA data offering. This weekly report is very important to traders and analysts in the agricultural markets. Published during the growing… more
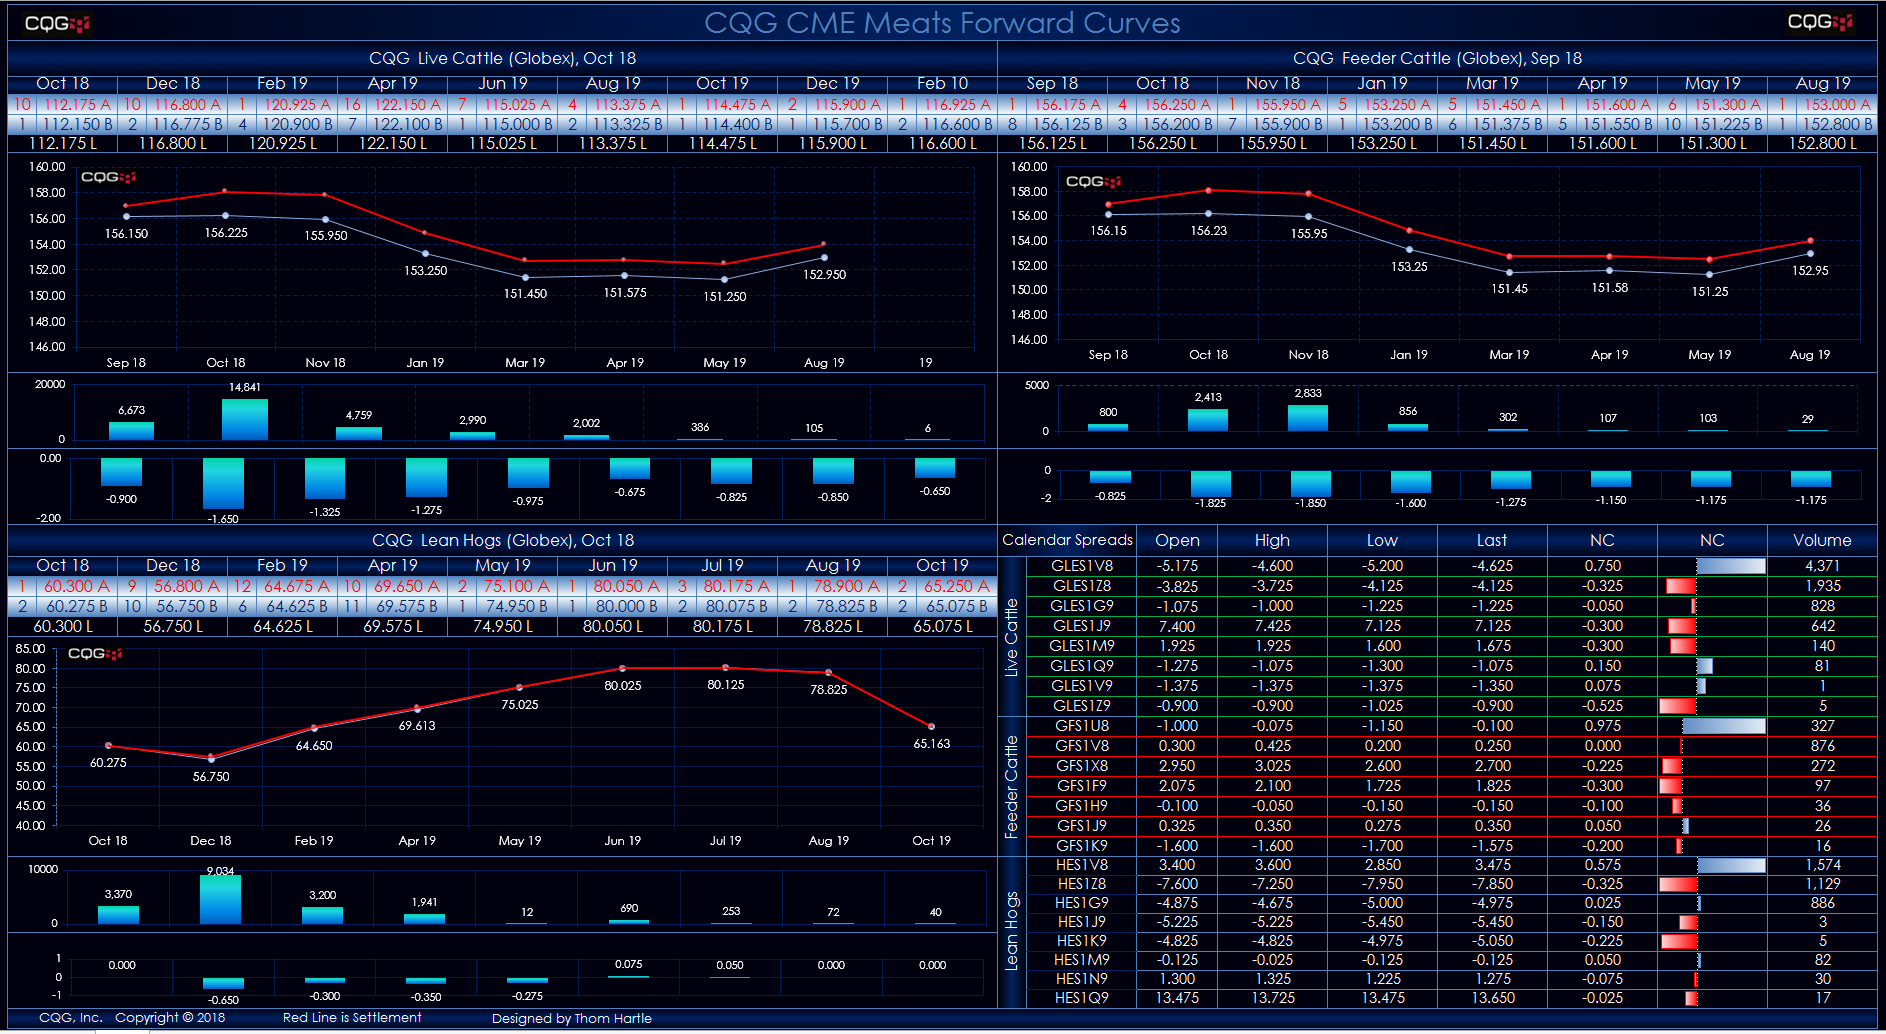
This Microsoft Excel® spreadsheet pulls in live cattle, feeder cattle, and lean hogs market data traded on CME Globex.
The forward curves display today's data. If the last price is… more
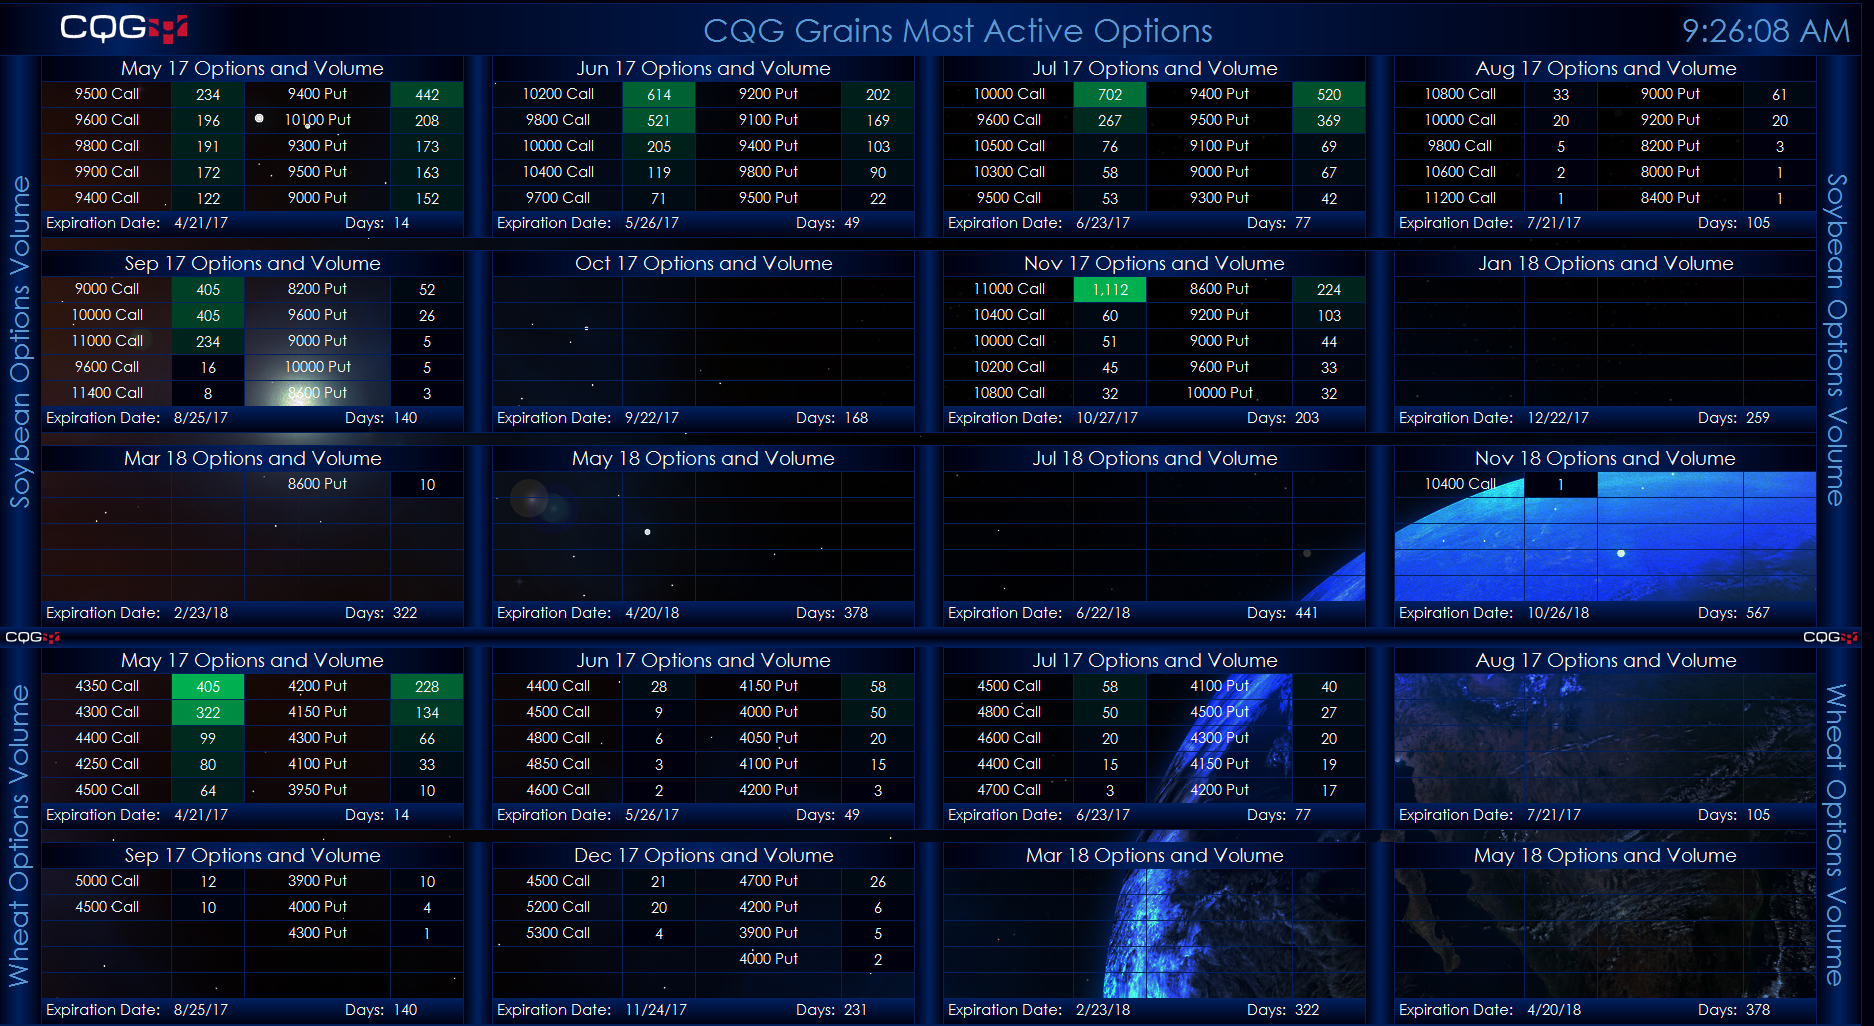
This Microsoft Excel® dashboard scans the options on soybeans, wheat, and corn (Globex) futures markets for volume. It displays strikes ranked by the volume traded for each expiry listed… more
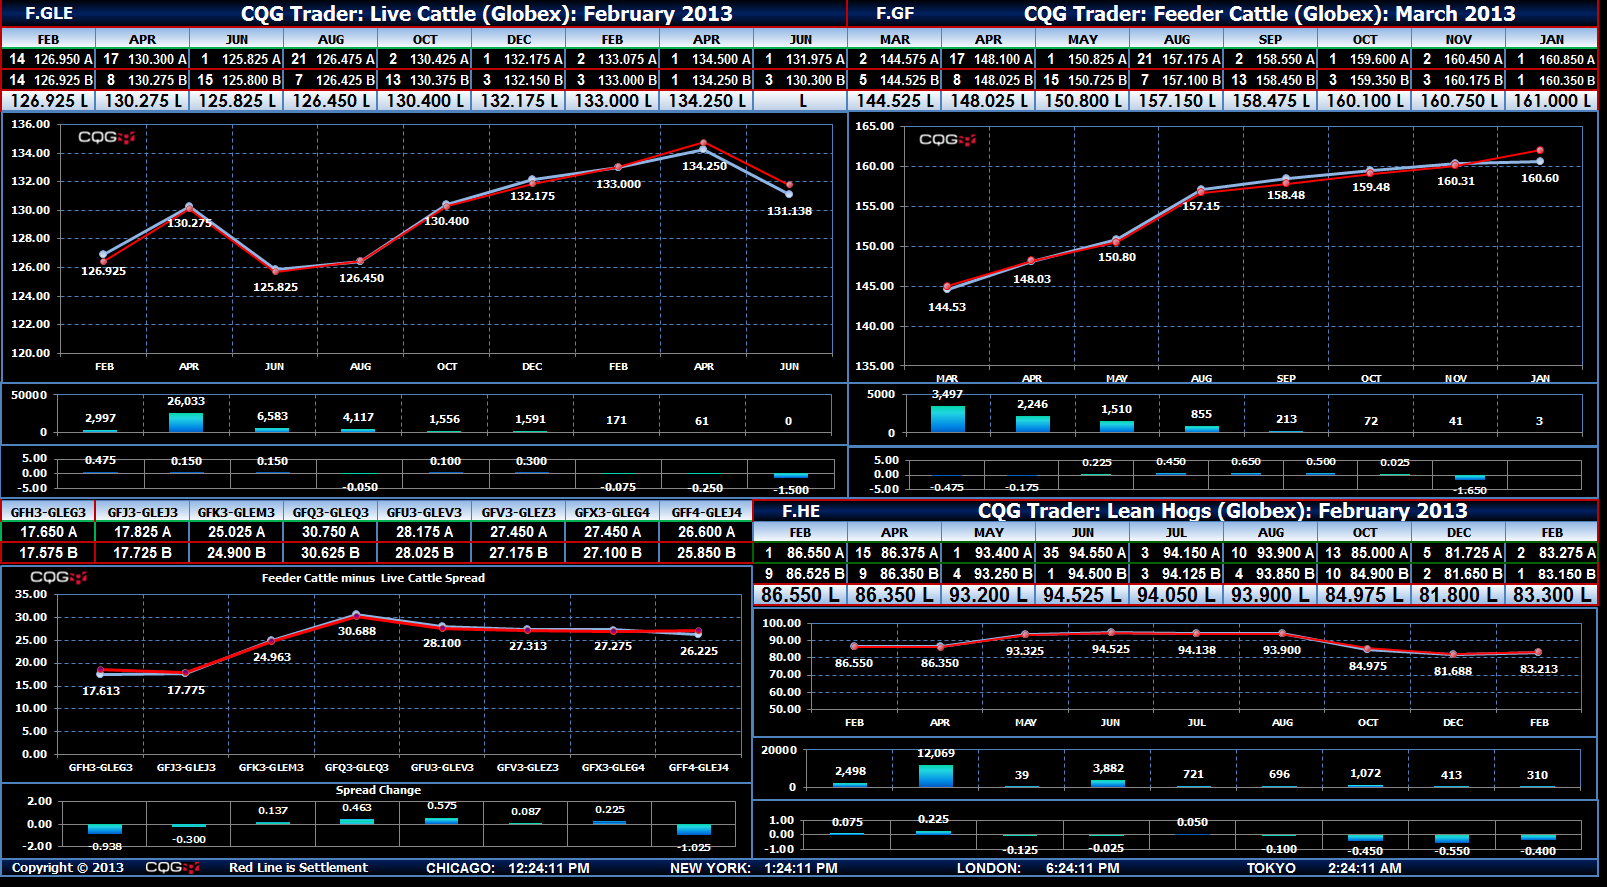
To access the RTD feature in CQG Trader, please contact your FCM. (CQG Trader RTD only works with 32-bit Excel).
This spreadsheet displays the current last, best bid, and best ask prices… more
To access the RTD feature in CQG Trader, please contact your FCM. (CQG Trader RTD only works with 32-bit Excel).
This spreadsheet displays the current last, best bid, and best ask prices… more