Maintain a global view of the price structure of the agricultural markets through Fastmarkets AgriCENSUS data.
Fastmarkets AgriCENSUS is an independent price reporting agency (PRA) that… more
Maintain a global view of the price structure of the agricultural markets through Fastmarkets AgriCENSUS data.
Fastmarkets AgriCENSUS is an independent price reporting agency (PRA) that… more
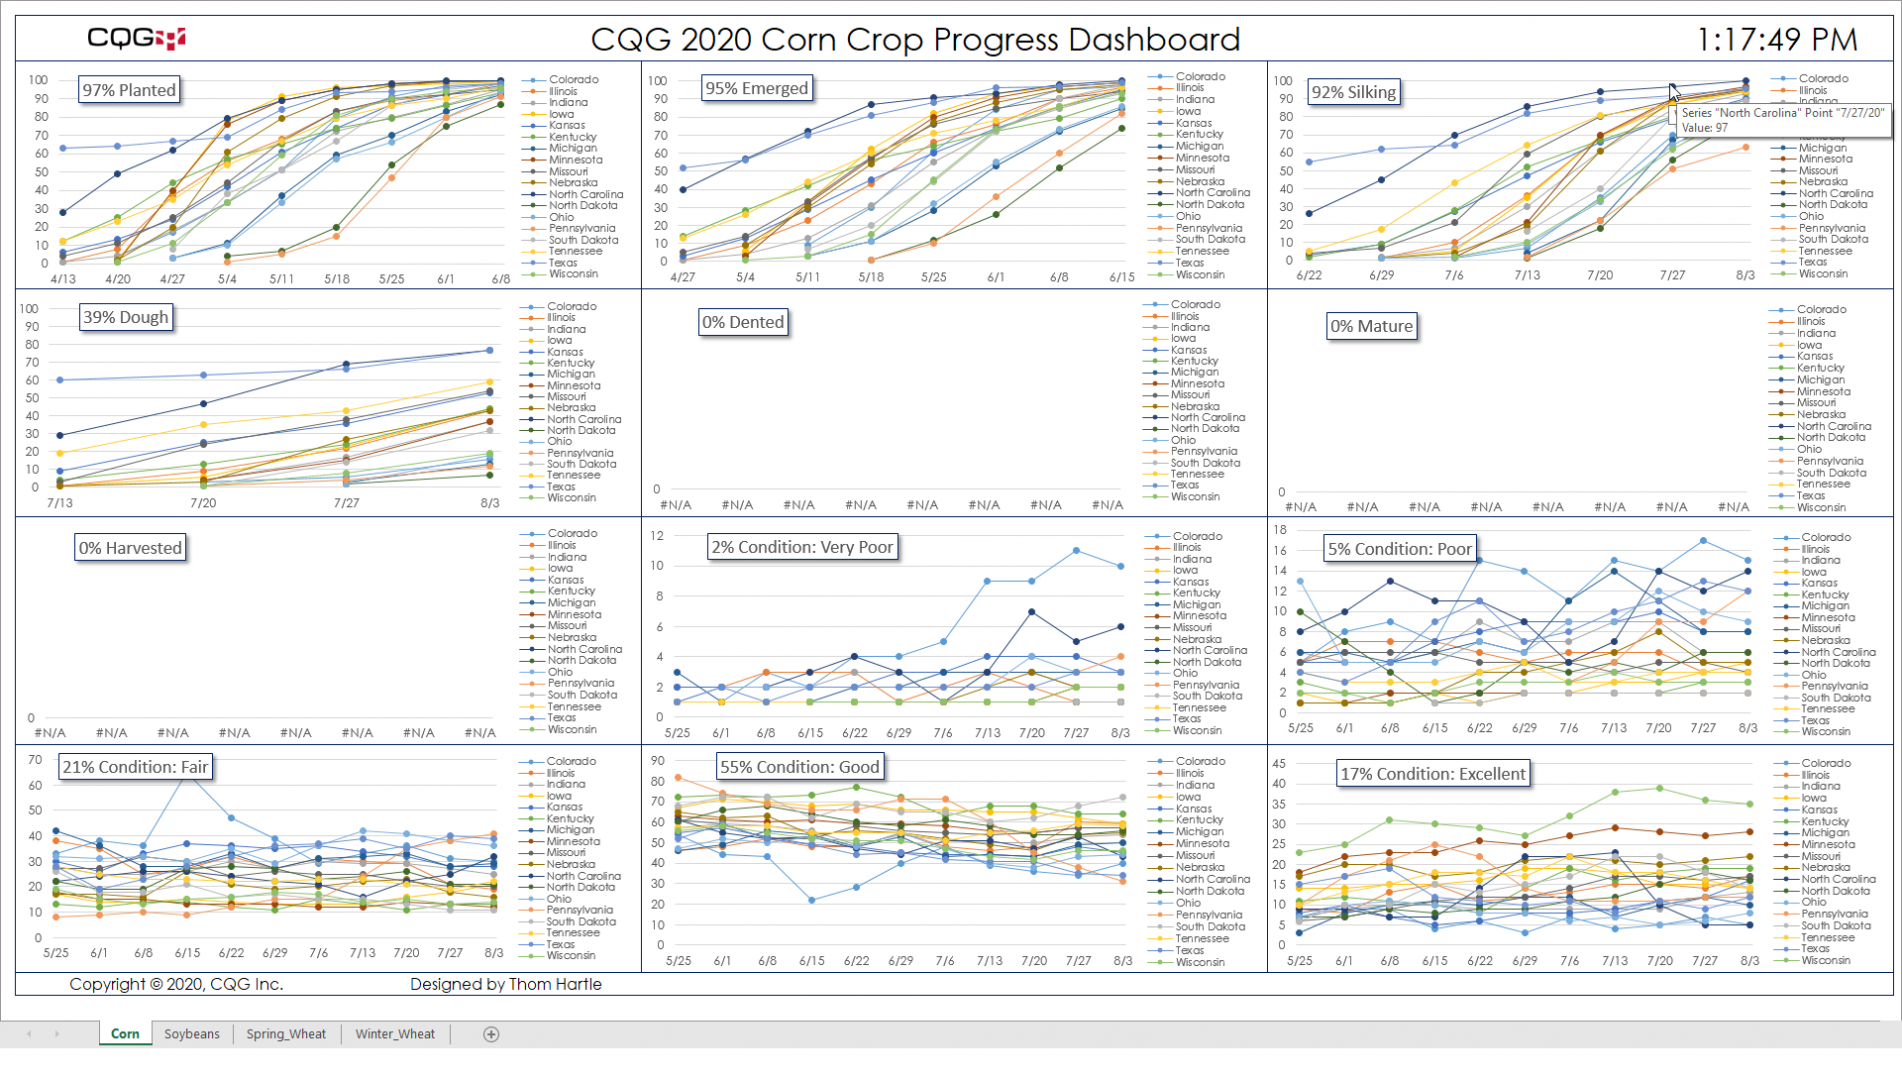
CQG has added the USDA Crop Progress weekly report to the USDA data offering. This weekly report is very important to traders and analysts in the agricultural markets. Published during the growing… more
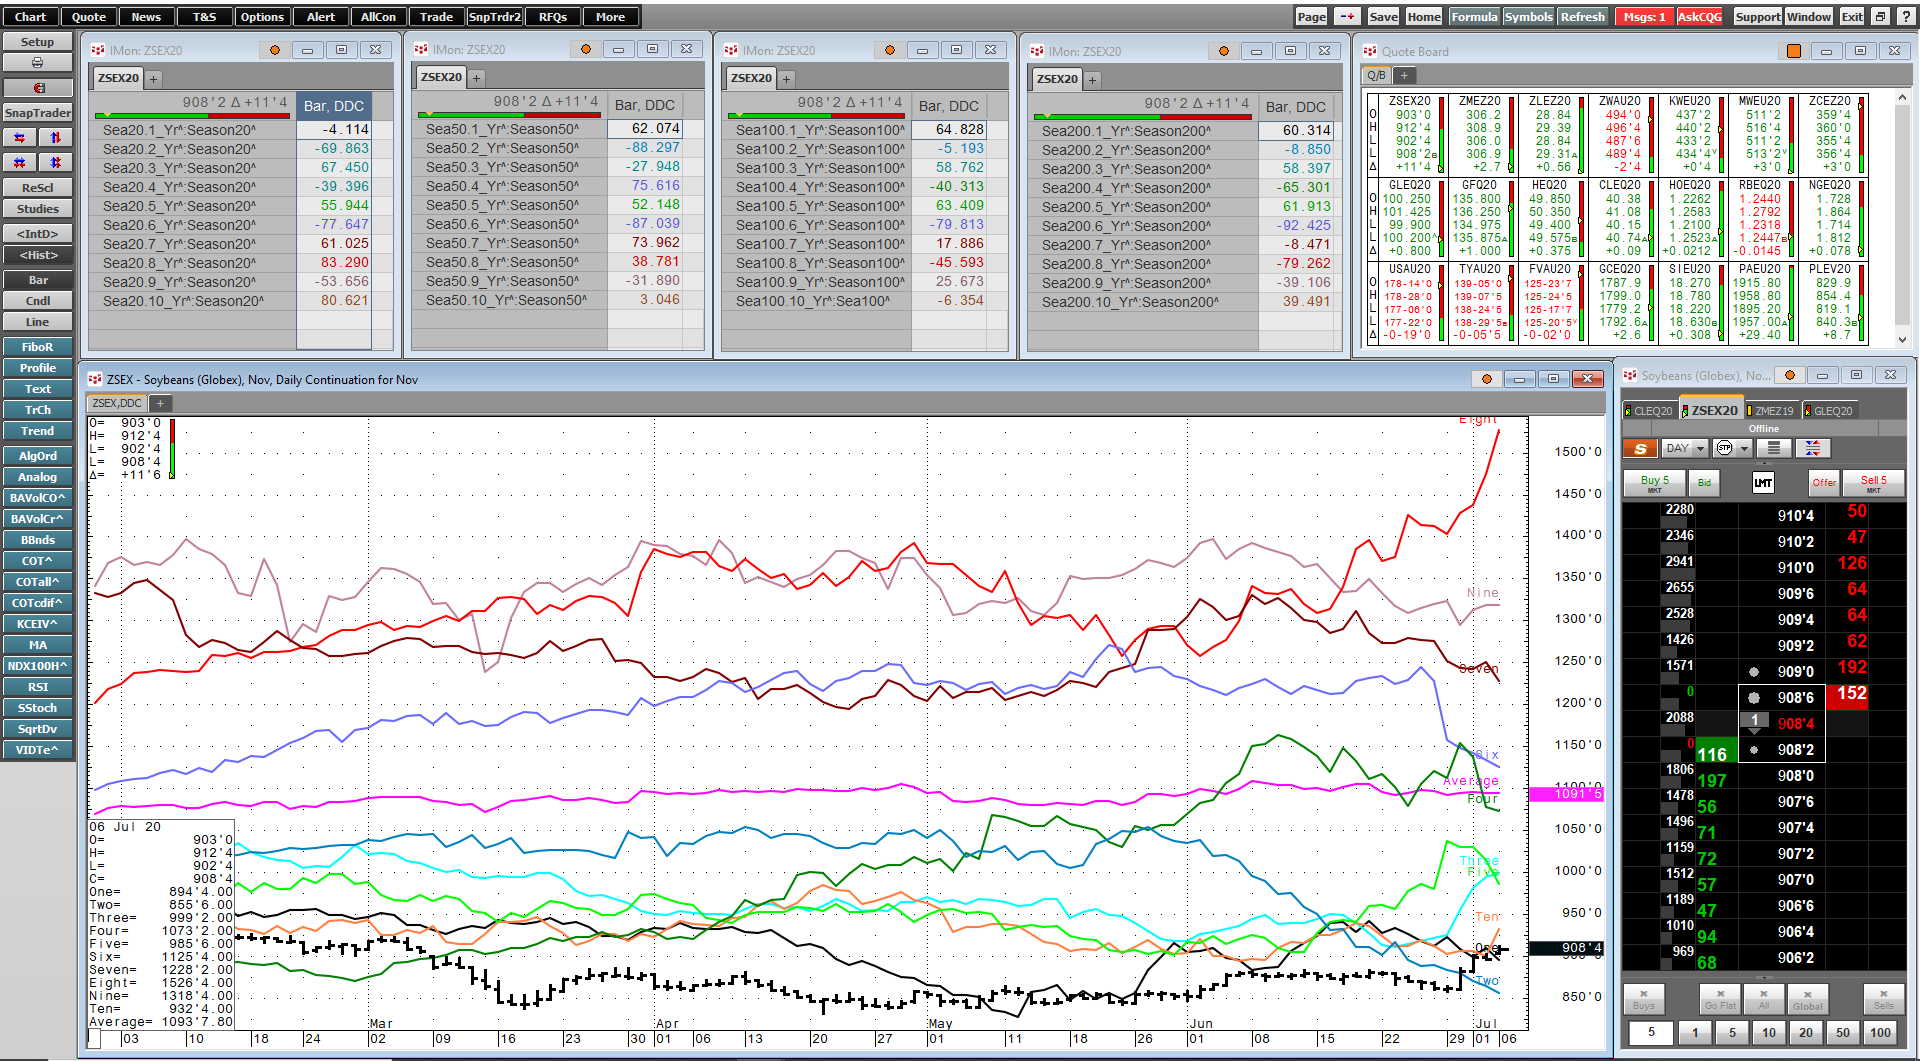
CQG’s Integrated Client and QTrader Version 2020 offers a new study called the Seasonal Study. This study is very popular with analysts and traders in the agricultural markets because of the… more
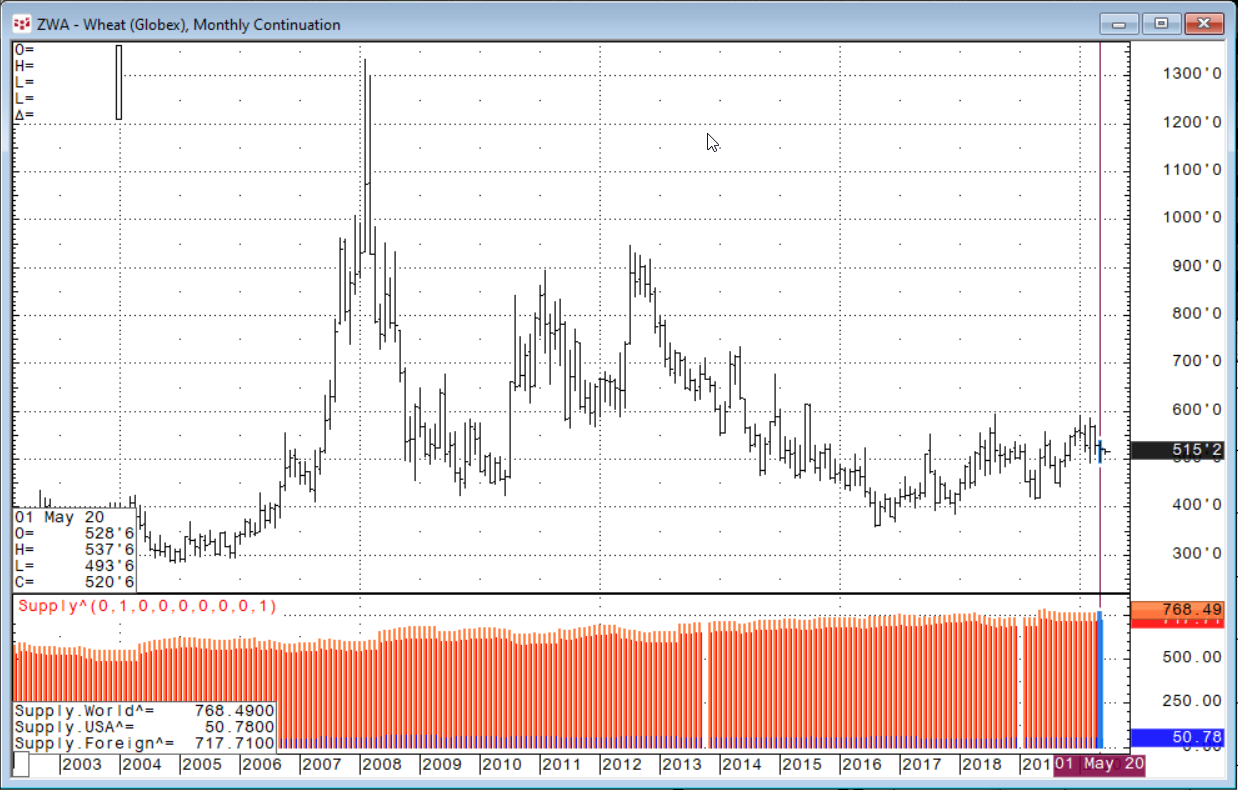
United States Department of Agriculture-World Agriculture Supply and Demand Estimates reports are a critical component to gaining insight into both the international and domestic demand and supply… more
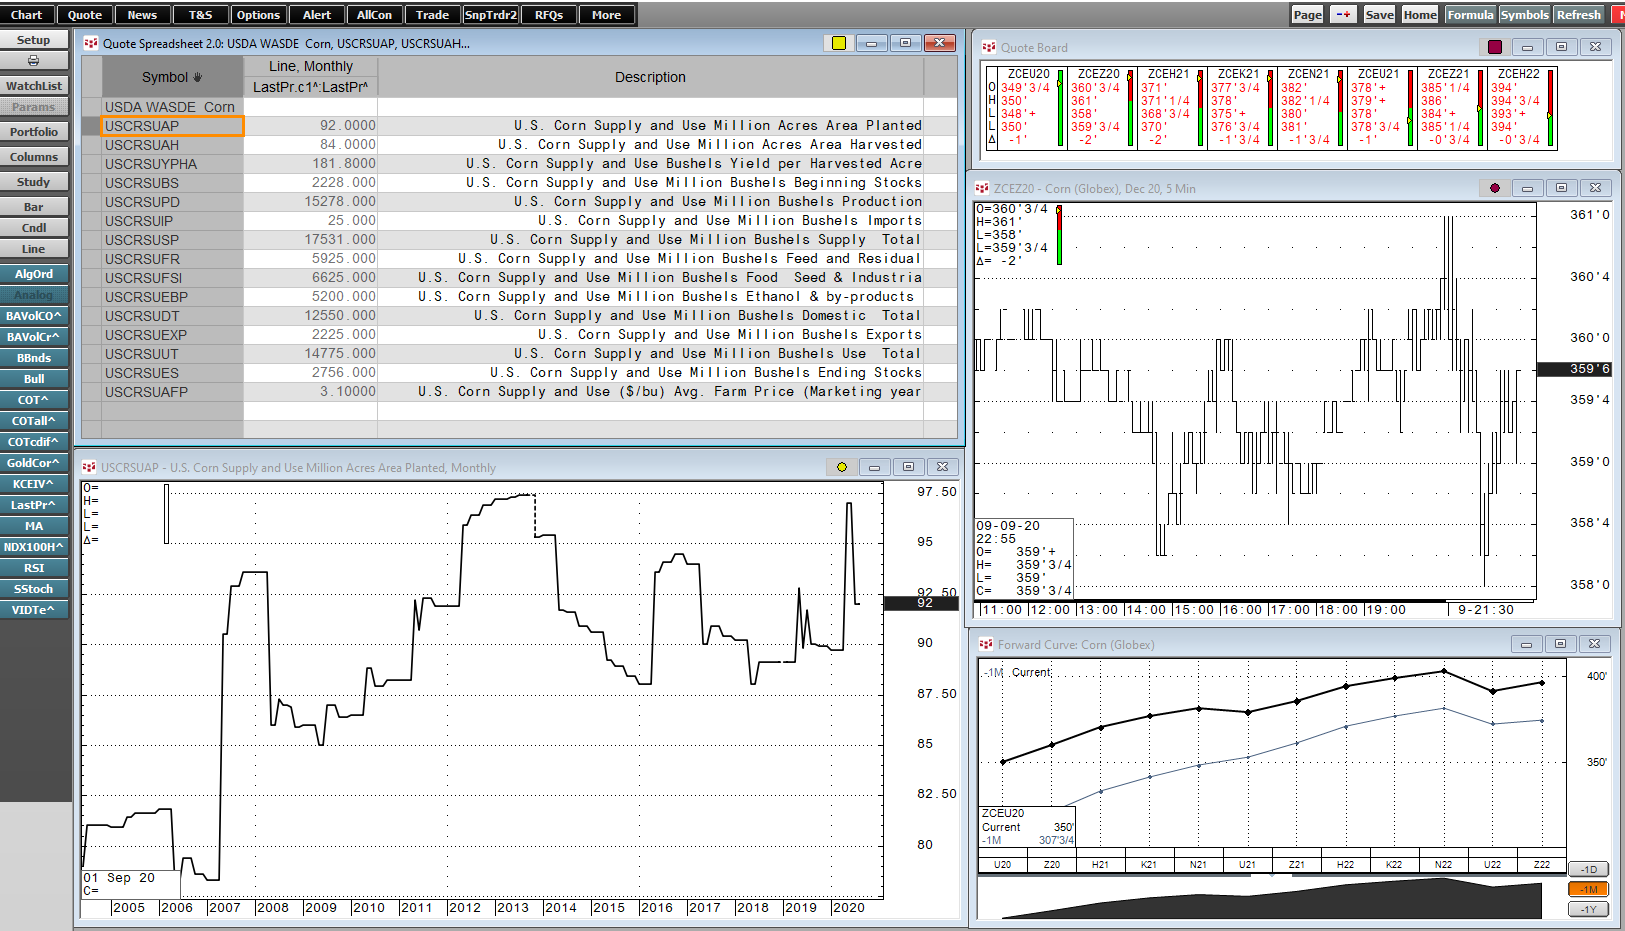
CQG has added the World Agricultural Supply and Demand Estimates (WASDE) data to the data feed. Published monthly by the United States Department of Agriculture (USDA), the World Agricultural… more
CQG has added United States Department of Agriculture (USDA) data and the World Agricultural Supply and Demand Estimates (WASDE) data to the data feed. Look for the data under the Exchanges list… more
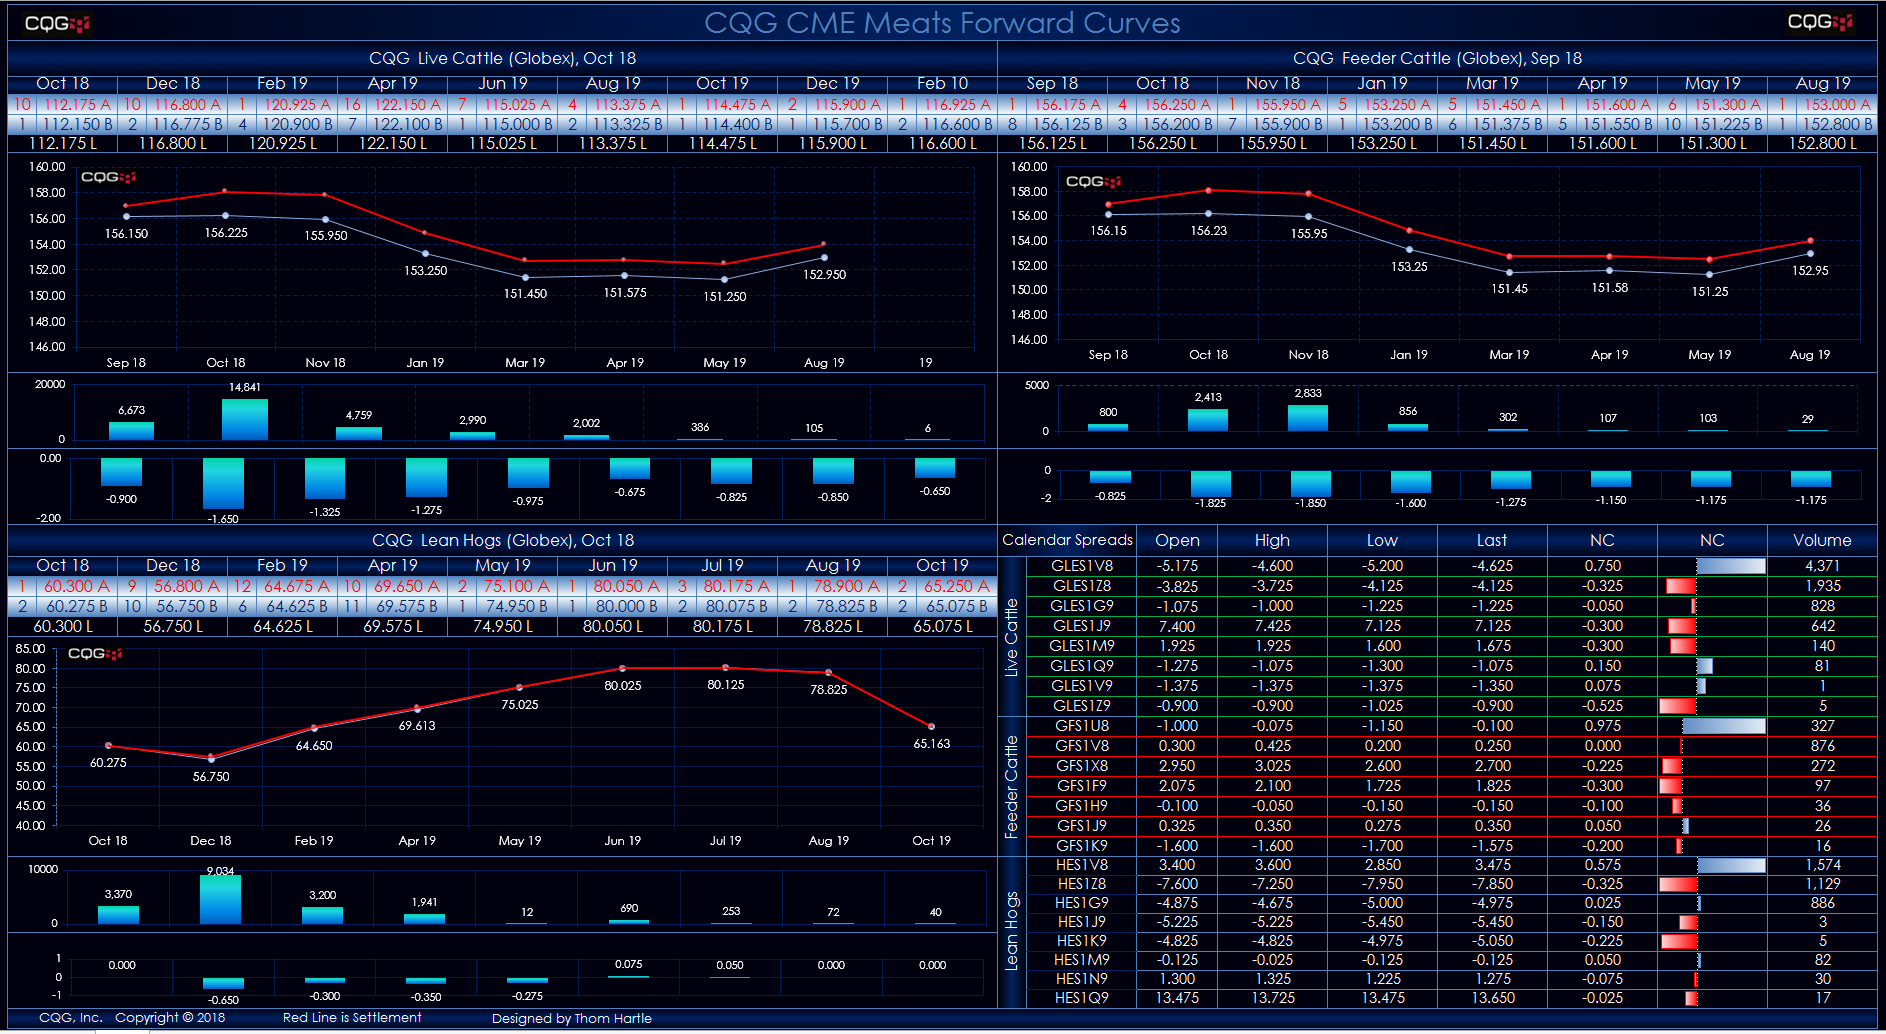
This Microsoft Excel® spreadsheet pulls in live cattle, feeder cattle, and lean hogs market data traded on CME Globex.
The forward curves display today's data. If the last price is… more
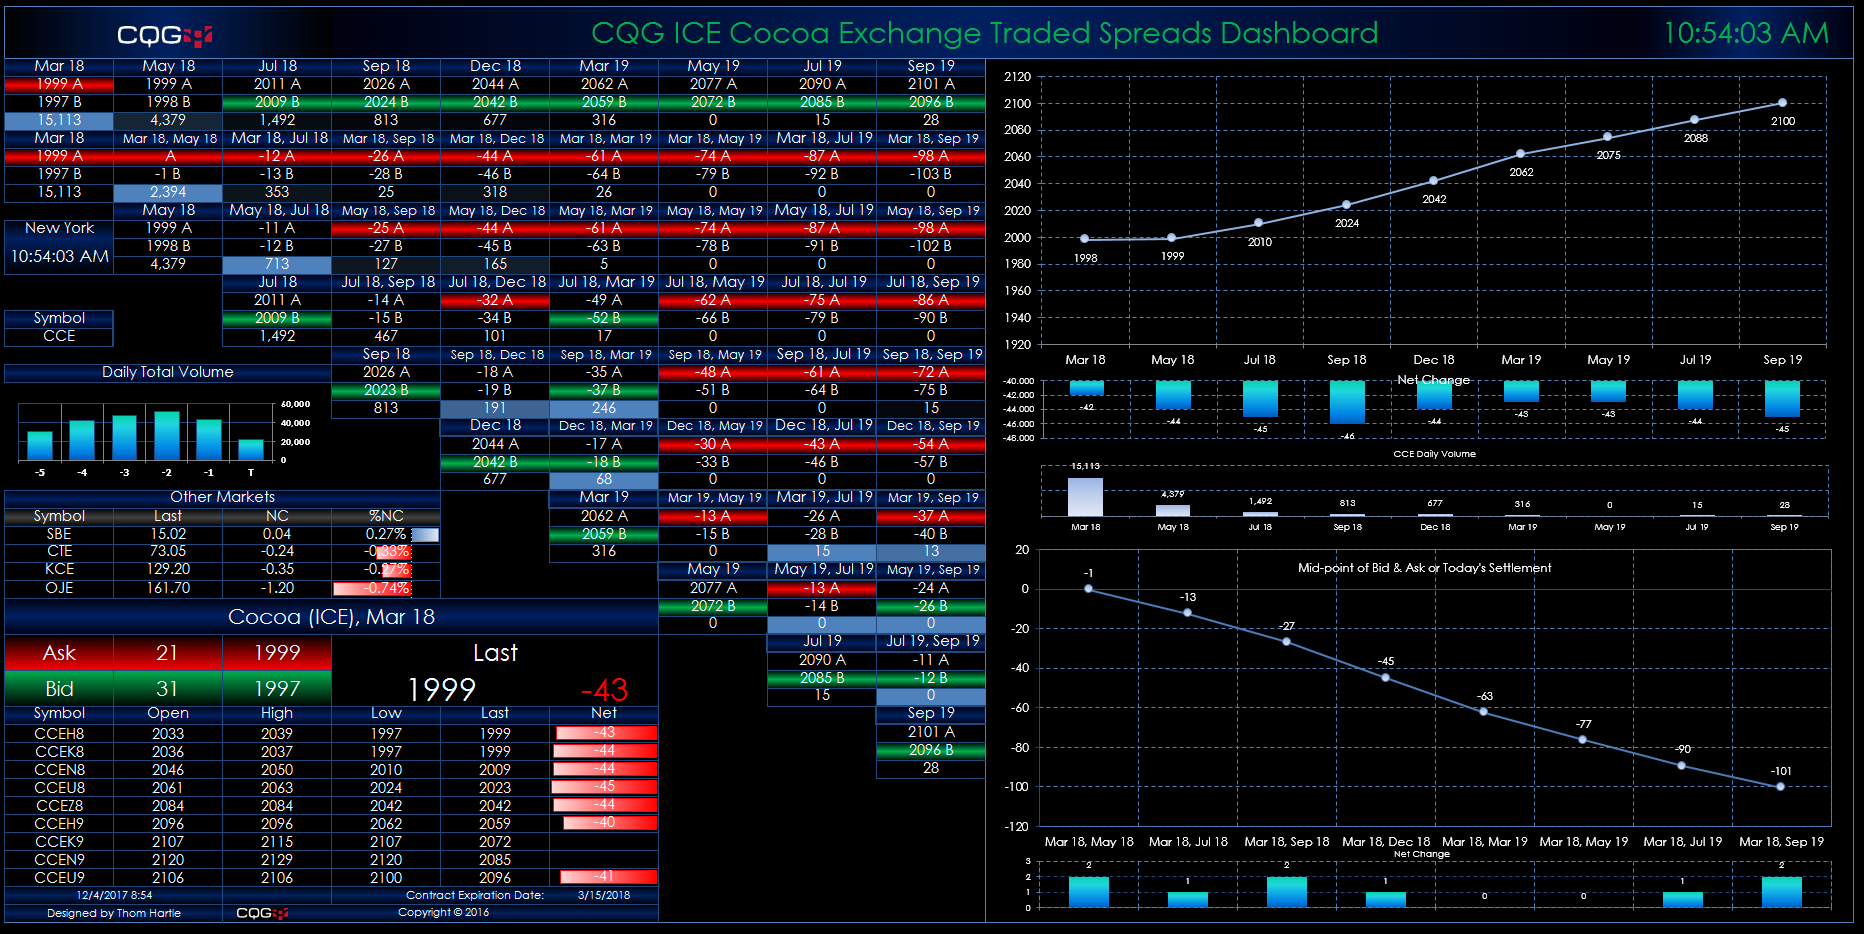
This Microsoft Excel® dashboard displays market data for cocoa spreads traded on the ICE platform using a matrix-style format. The outrights are along the top row and at the start of each row. The… more
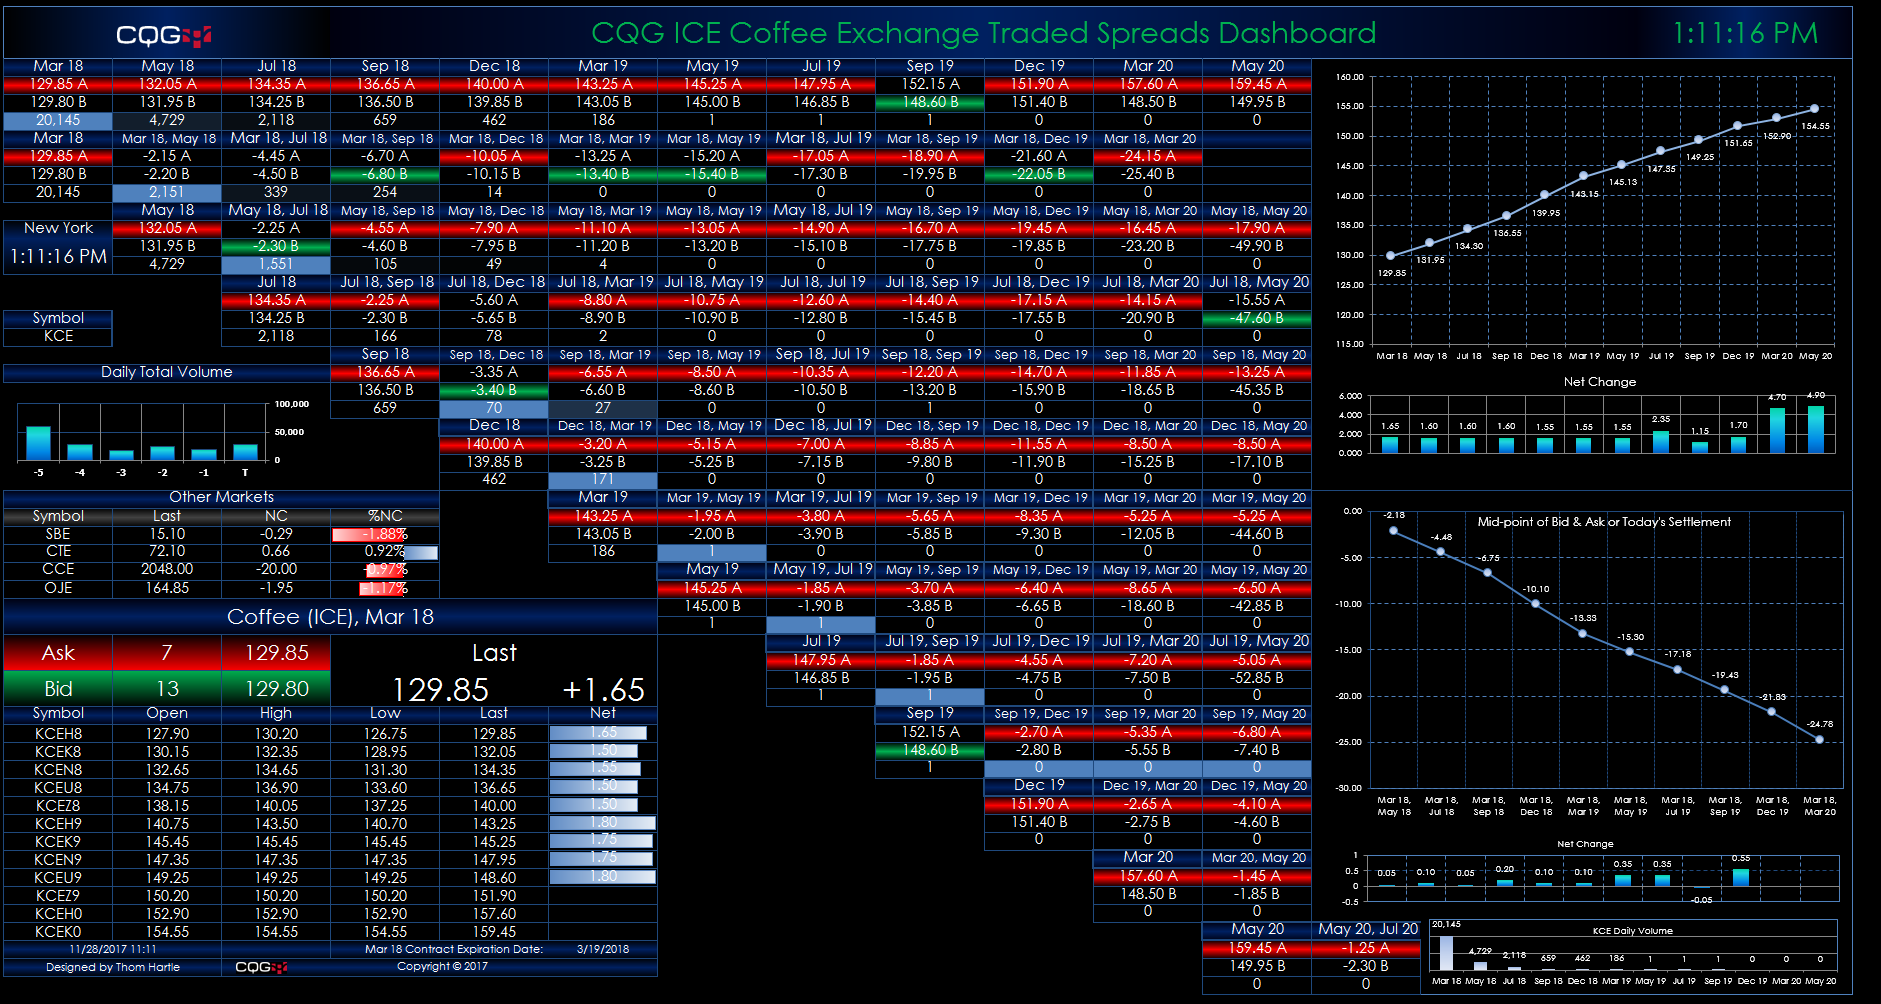
This Microsoft Excel® dashboard displays market data for coffee spreads traded on the ICE platform using a matrix-style format. The outrights are along the top row and at the start of each row.… more
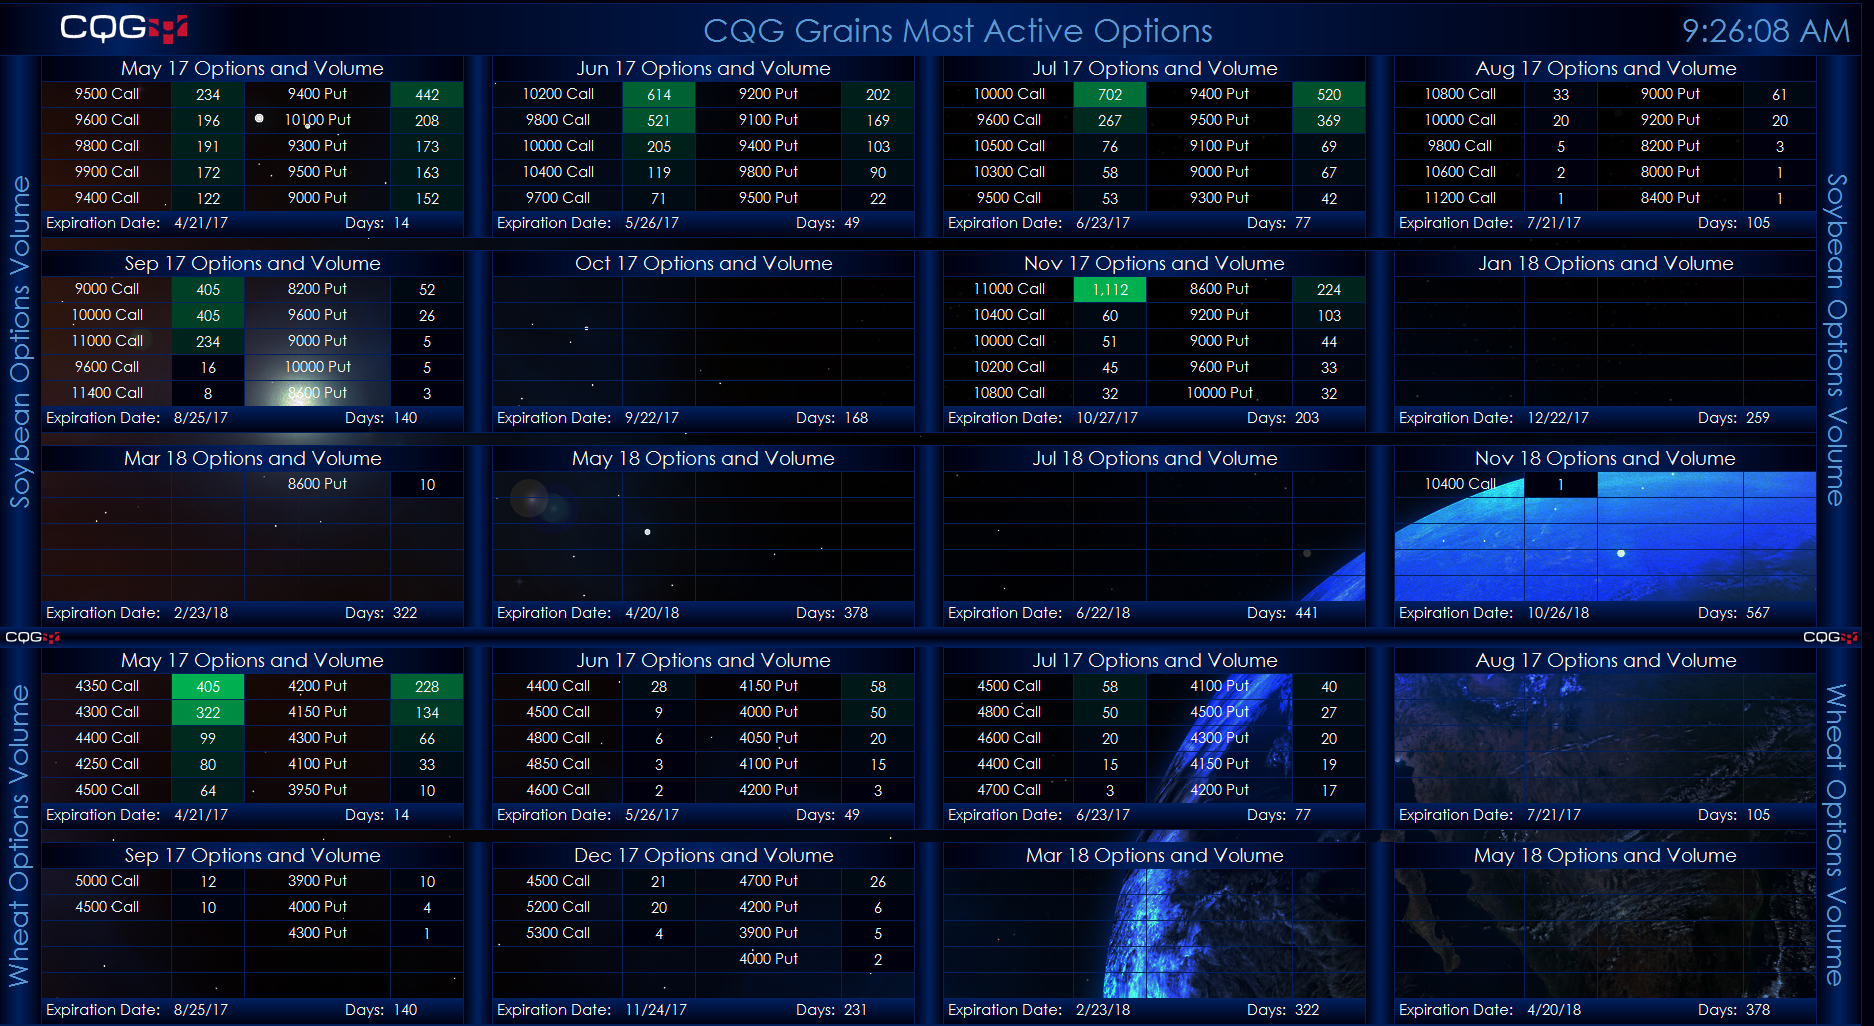
This Microsoft Excel® dashboard scans the options on soybeans, wheat, and corn (Globex) futures markets for volume. It displays strikes ranked by the volume traded for each expiry listed… more