If you track the performance of ETFs you may be interested in evaluating the performance of the stocks that are held by the ETF, such as the Invesco QQQ ETF, which tracks the Nasdaq-100 Index. Two… more
Workspaces
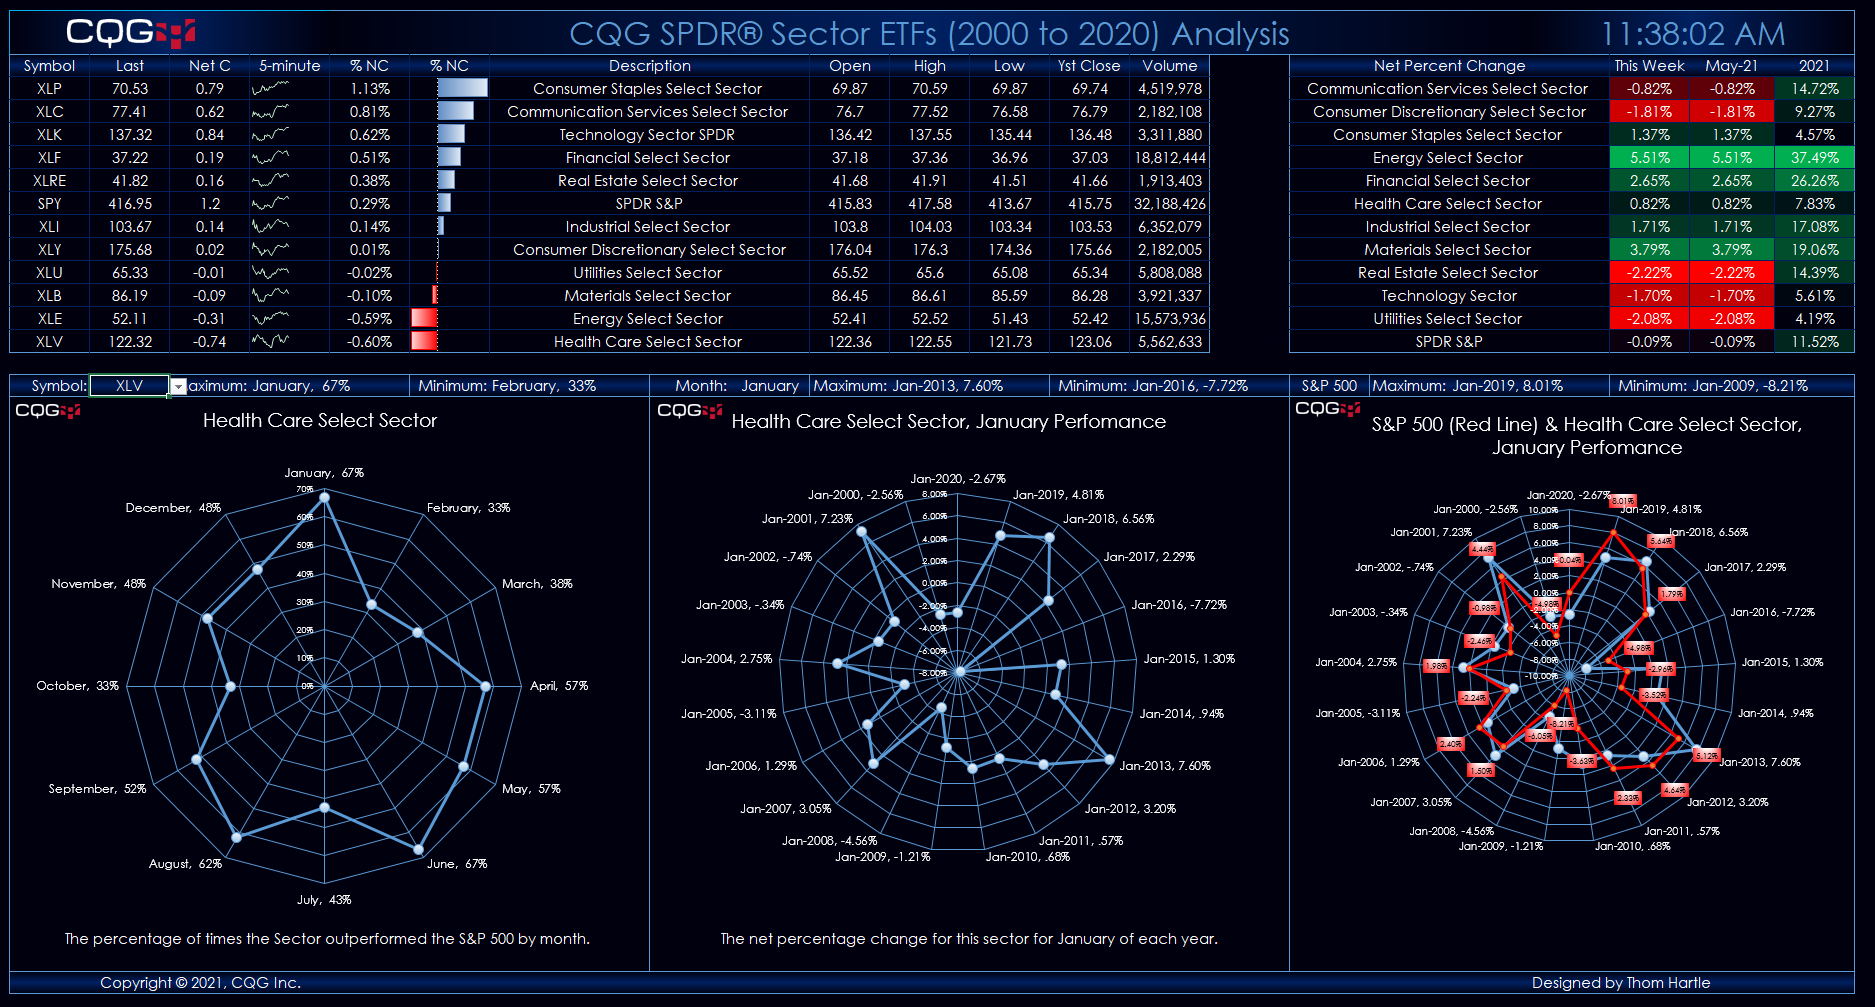
SPDR® Sector ETFs Analysis Dashboard This Microsoft® Excel dashboard provides analysis of S&P Sectors based on ETFs. The collection of ETFs are:
Symbol Description XLC Communication… more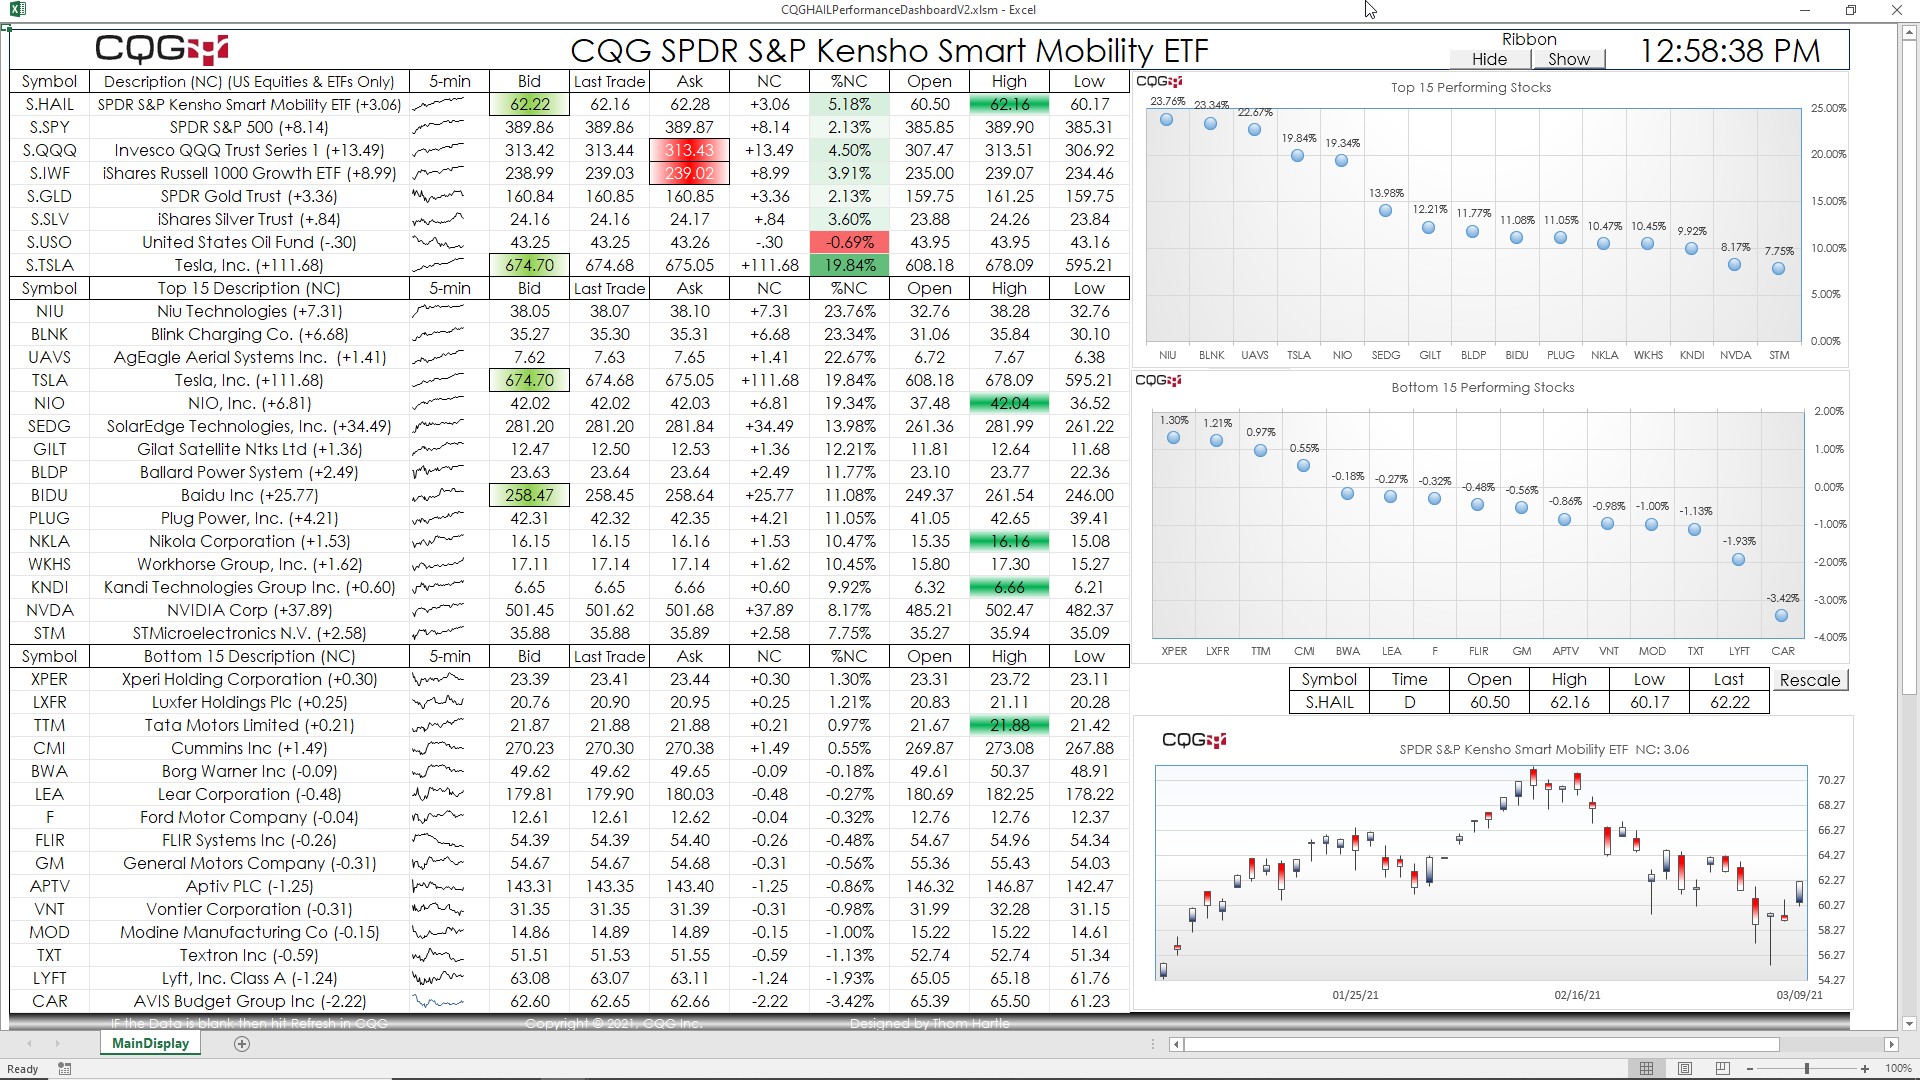
Traders and investors have a multitude of opportunities for theme investing. That is, ETFs are structured to invest in companies that are part of an industry, such as Biotech, Internet, Aerospace… more
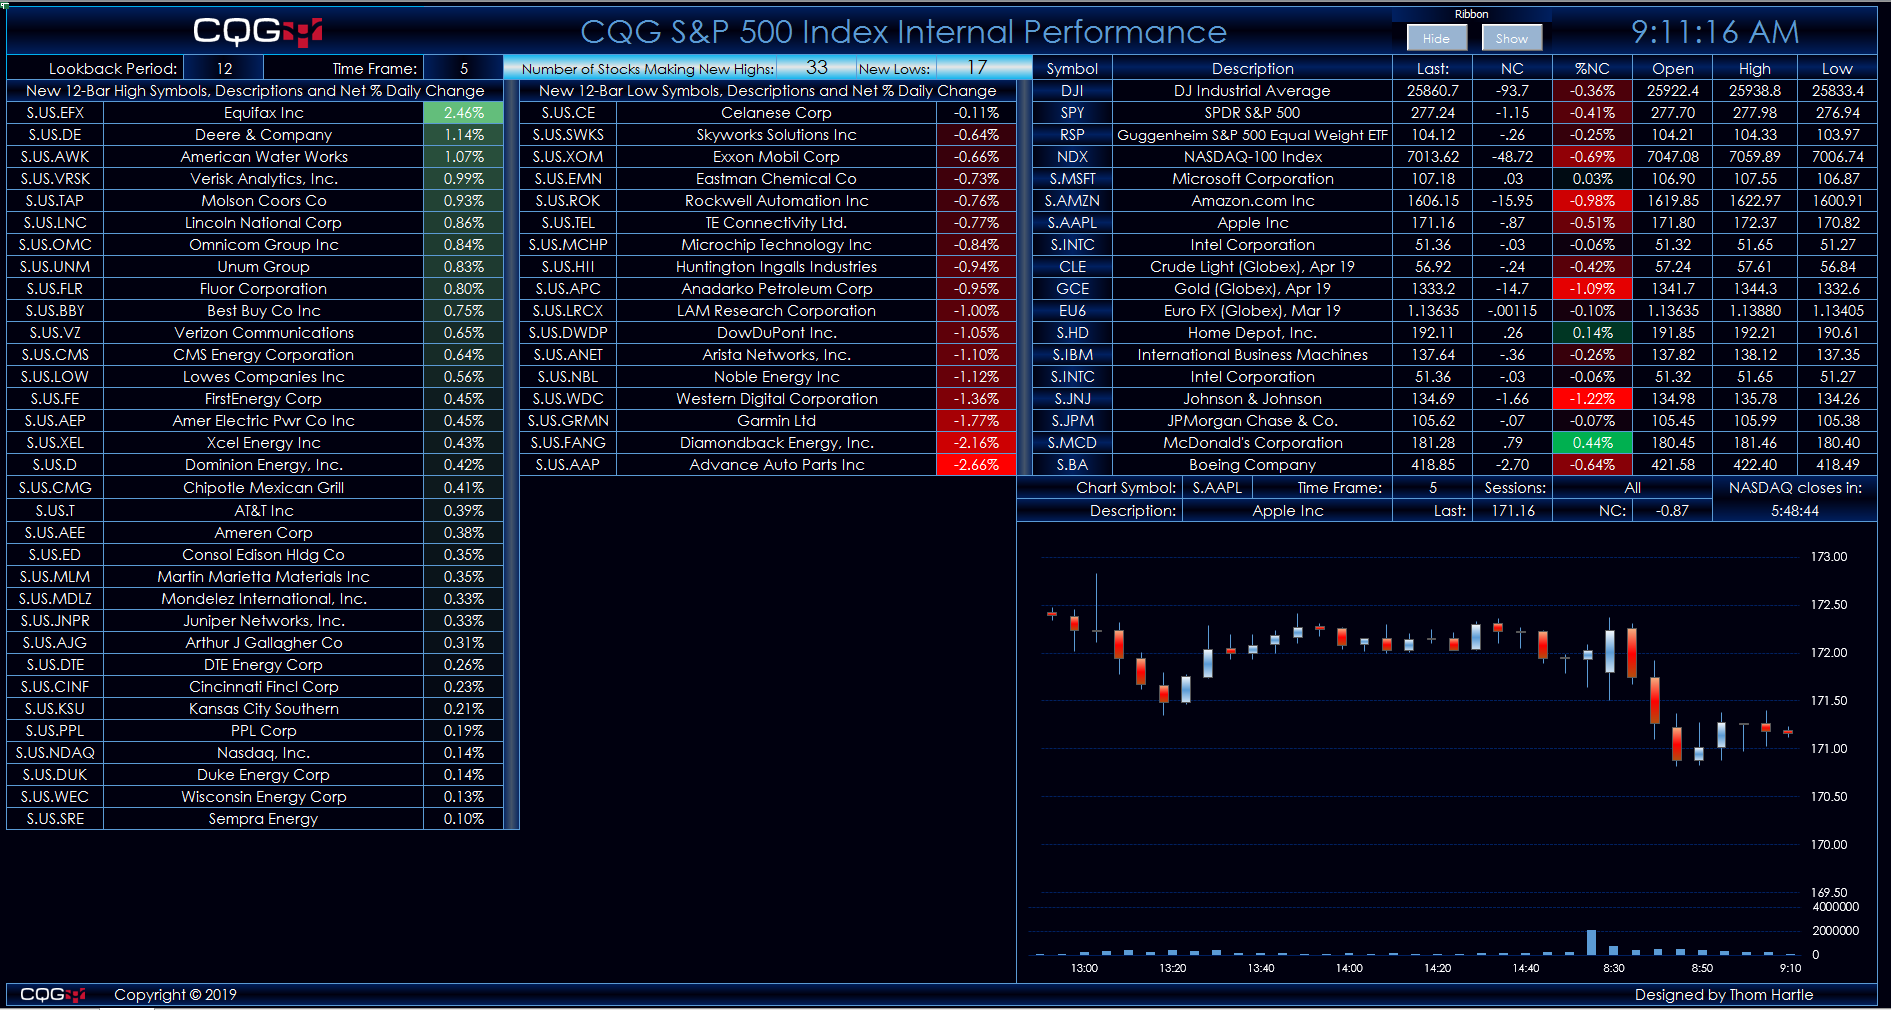
This Microsoft Excel® dashboard tracks the 506 stocks in the S&P 500 index using CQG’s Level function. The Level function plots two lines, which identify the highest and lowest price levels… more
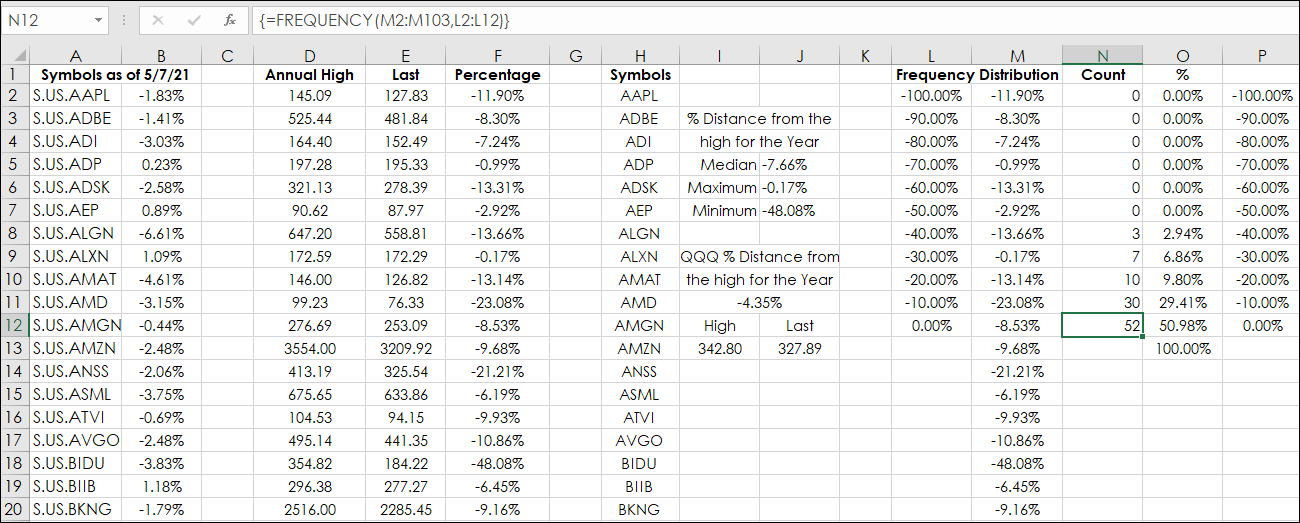
This Microsoft Excel® dashboard tracks the 104 stocks in the Nasdaq-100 index using CQG’s Level function. The Level function plots two lines, which identify the highest and lowest price levels… more
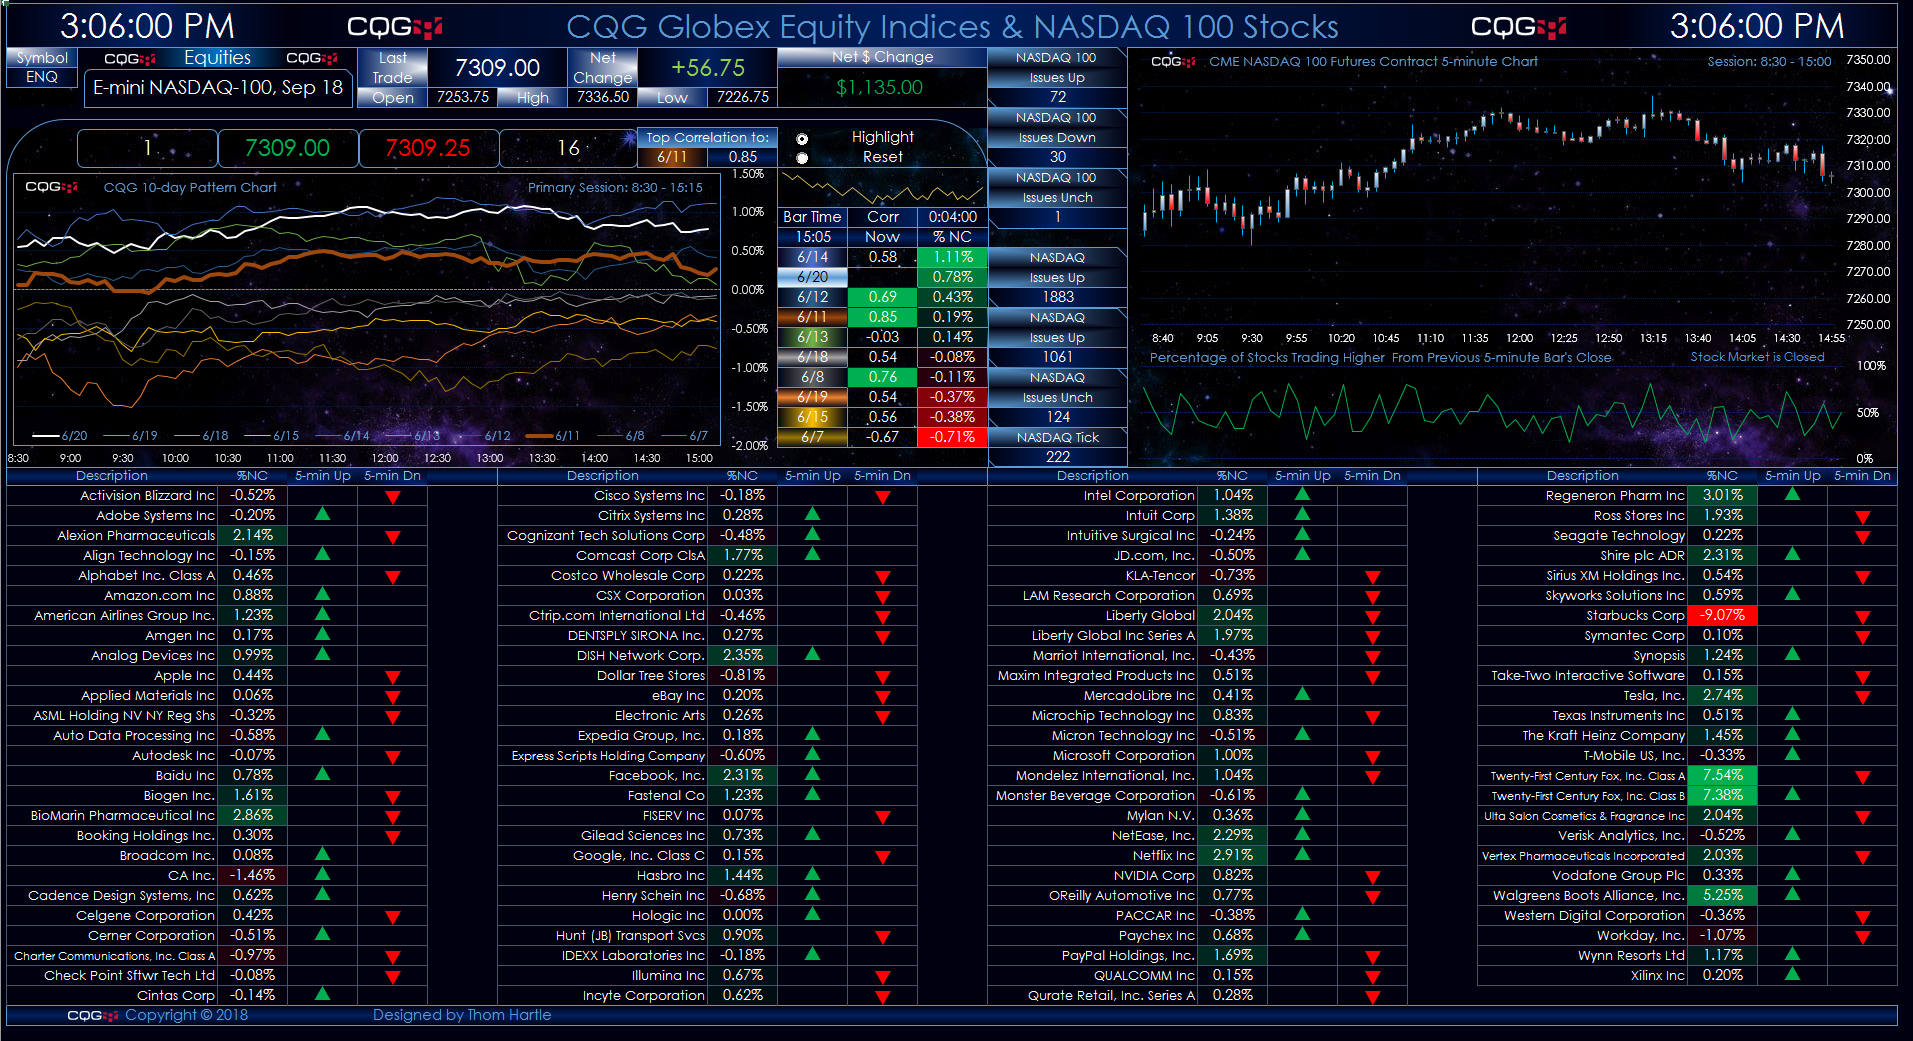
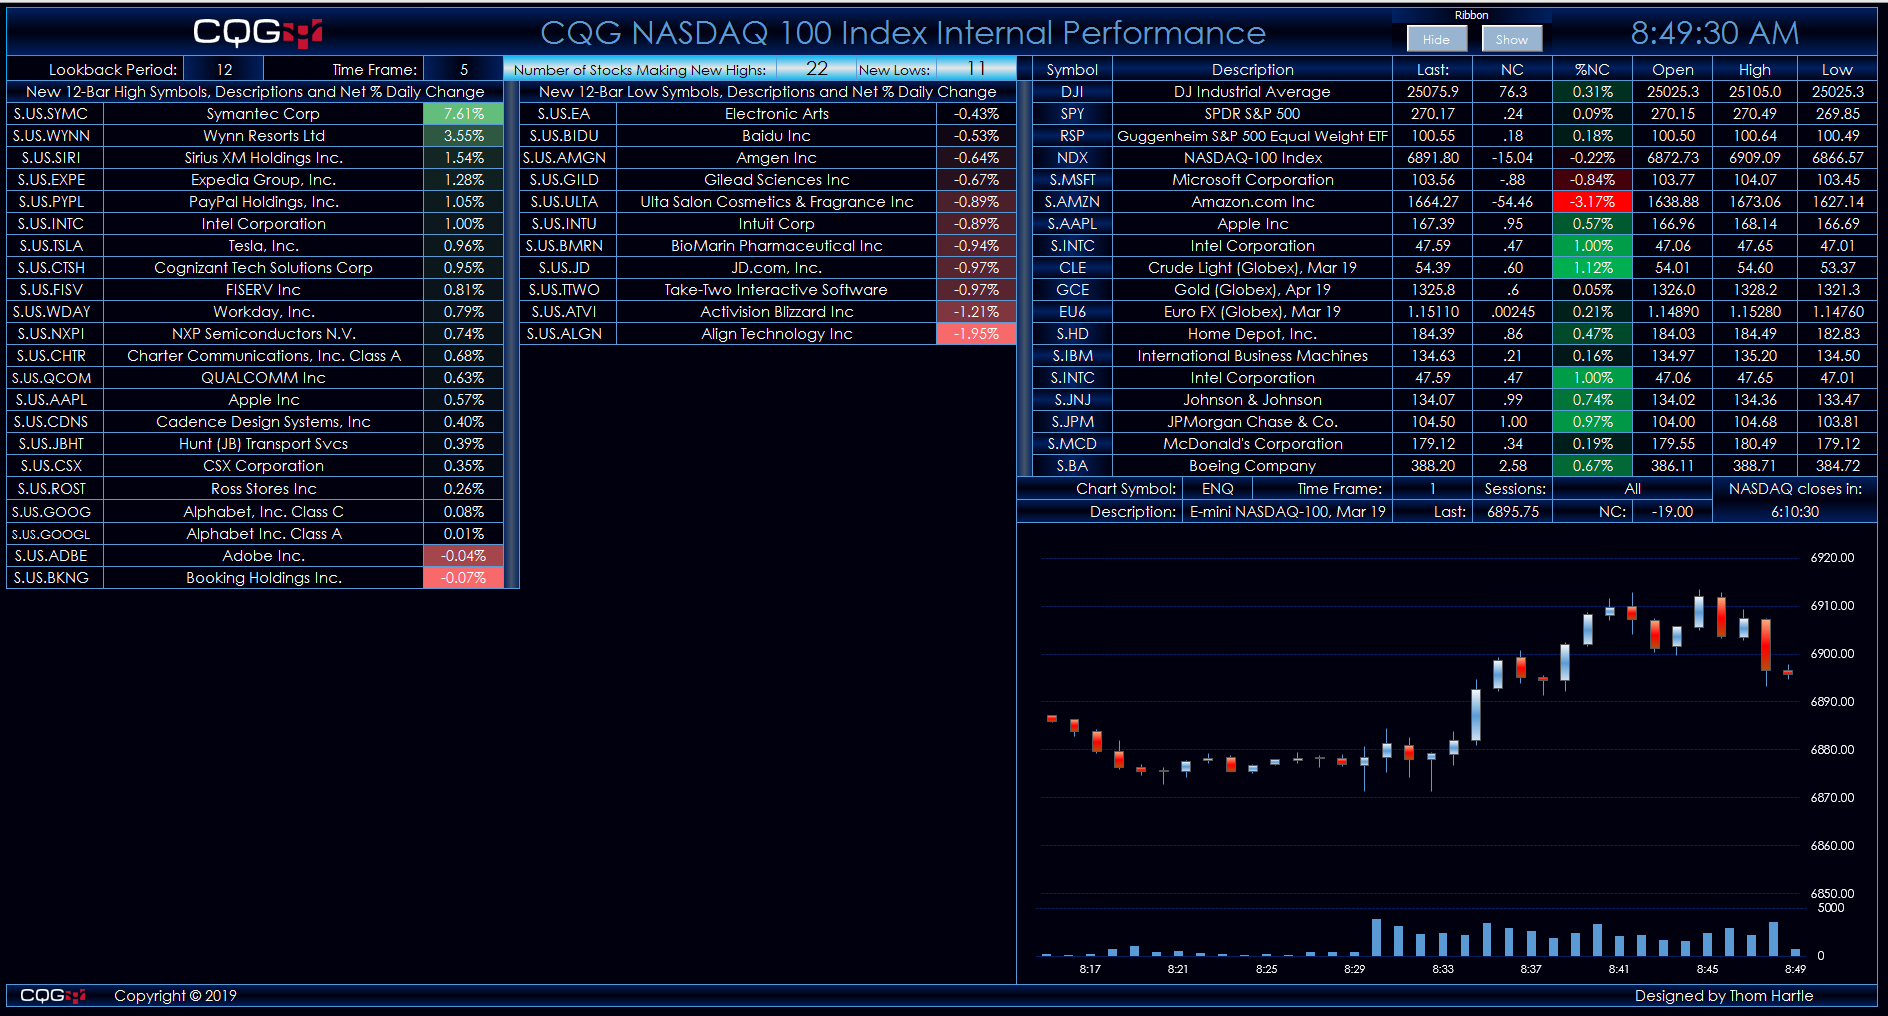
This Microsoft Excel® dashboard presents two charts of the Nasdaq-100 futures contract and market data for the one hundred stocks that are constituents of the Nasdaq 100 Index.
… more
This Microsoft Excel® dashboard displays the cash indices available from the Hang Seng Indexes Company.
The quote displays are divided into four sections. The first section is the cash Hang… more

This macro-enabled Microsoft Excel® spreadsheet tracks the holdings of the Invesco S&P 500® Equal Weight Technology ETF (symbol: RYT). This ETF seeks to replicate, before fees and expenses,… more
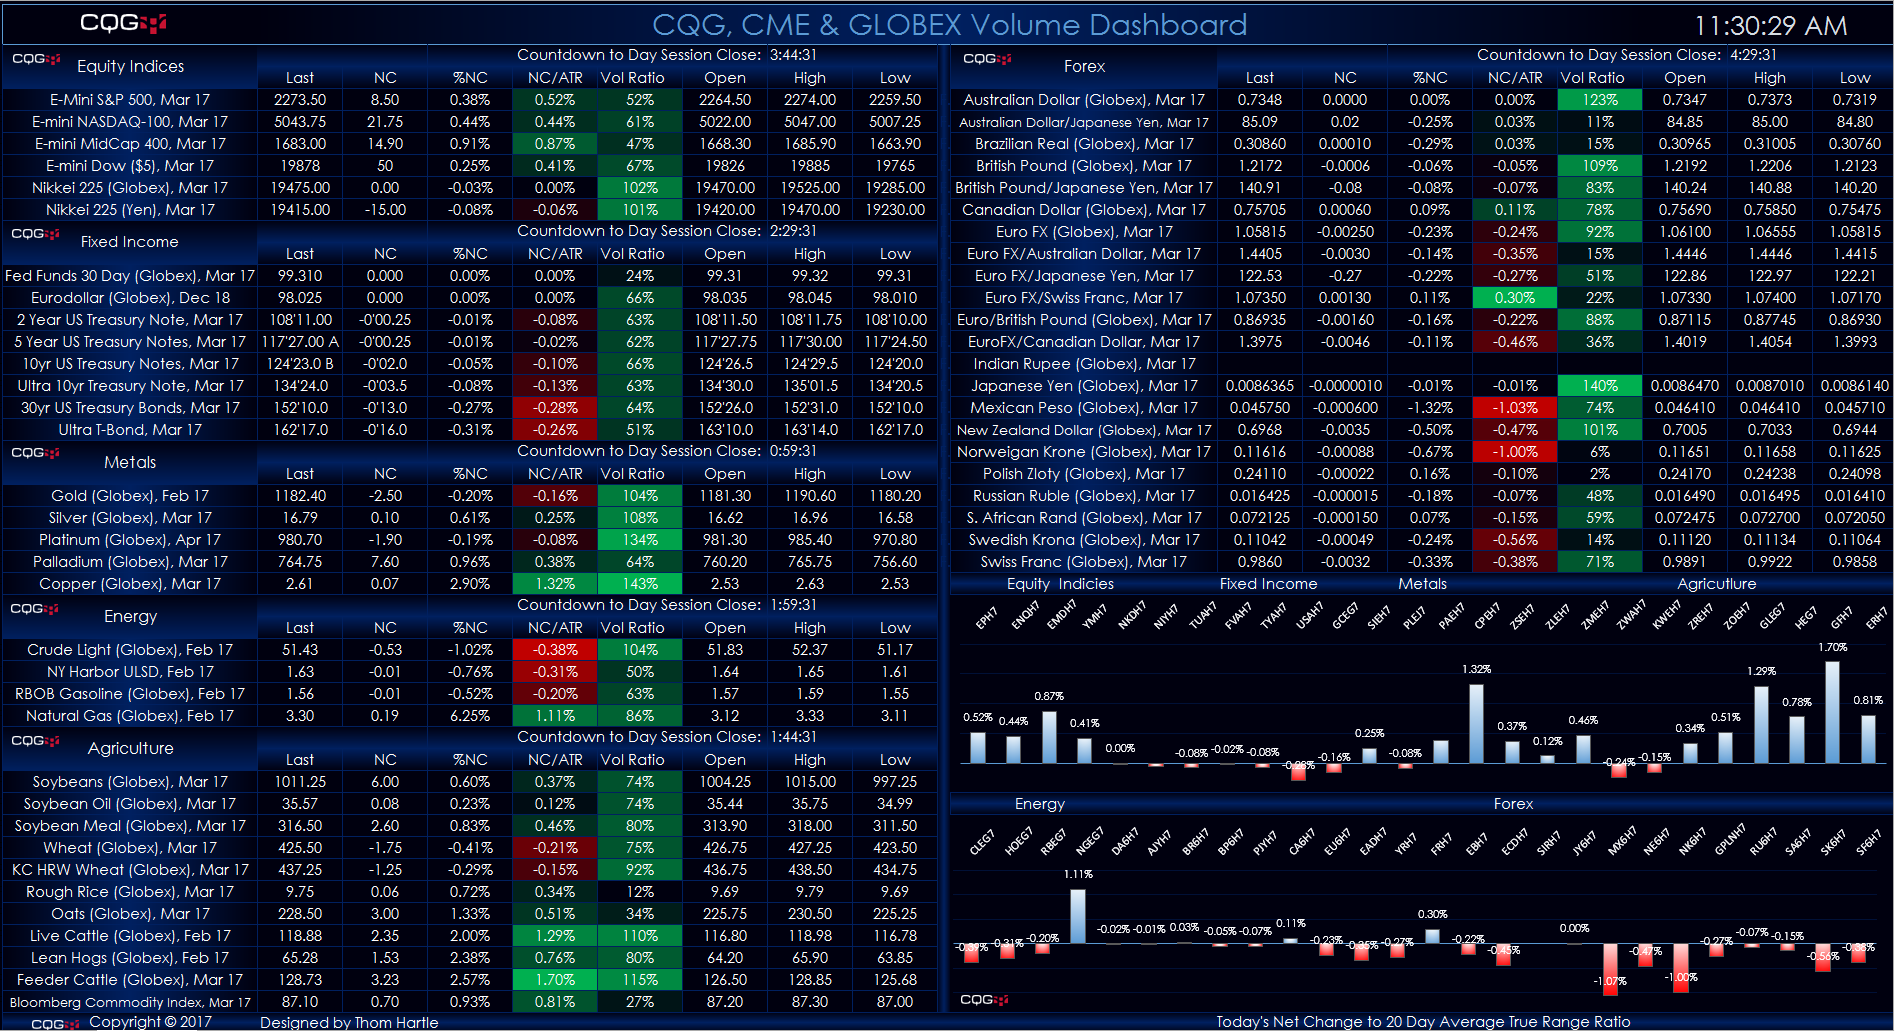
This Microsoft Excel® dashboard displays key market information for contracts traded on the CME Exchange and the Globex platform. The markets are grouped by these products:
Equity Indices… more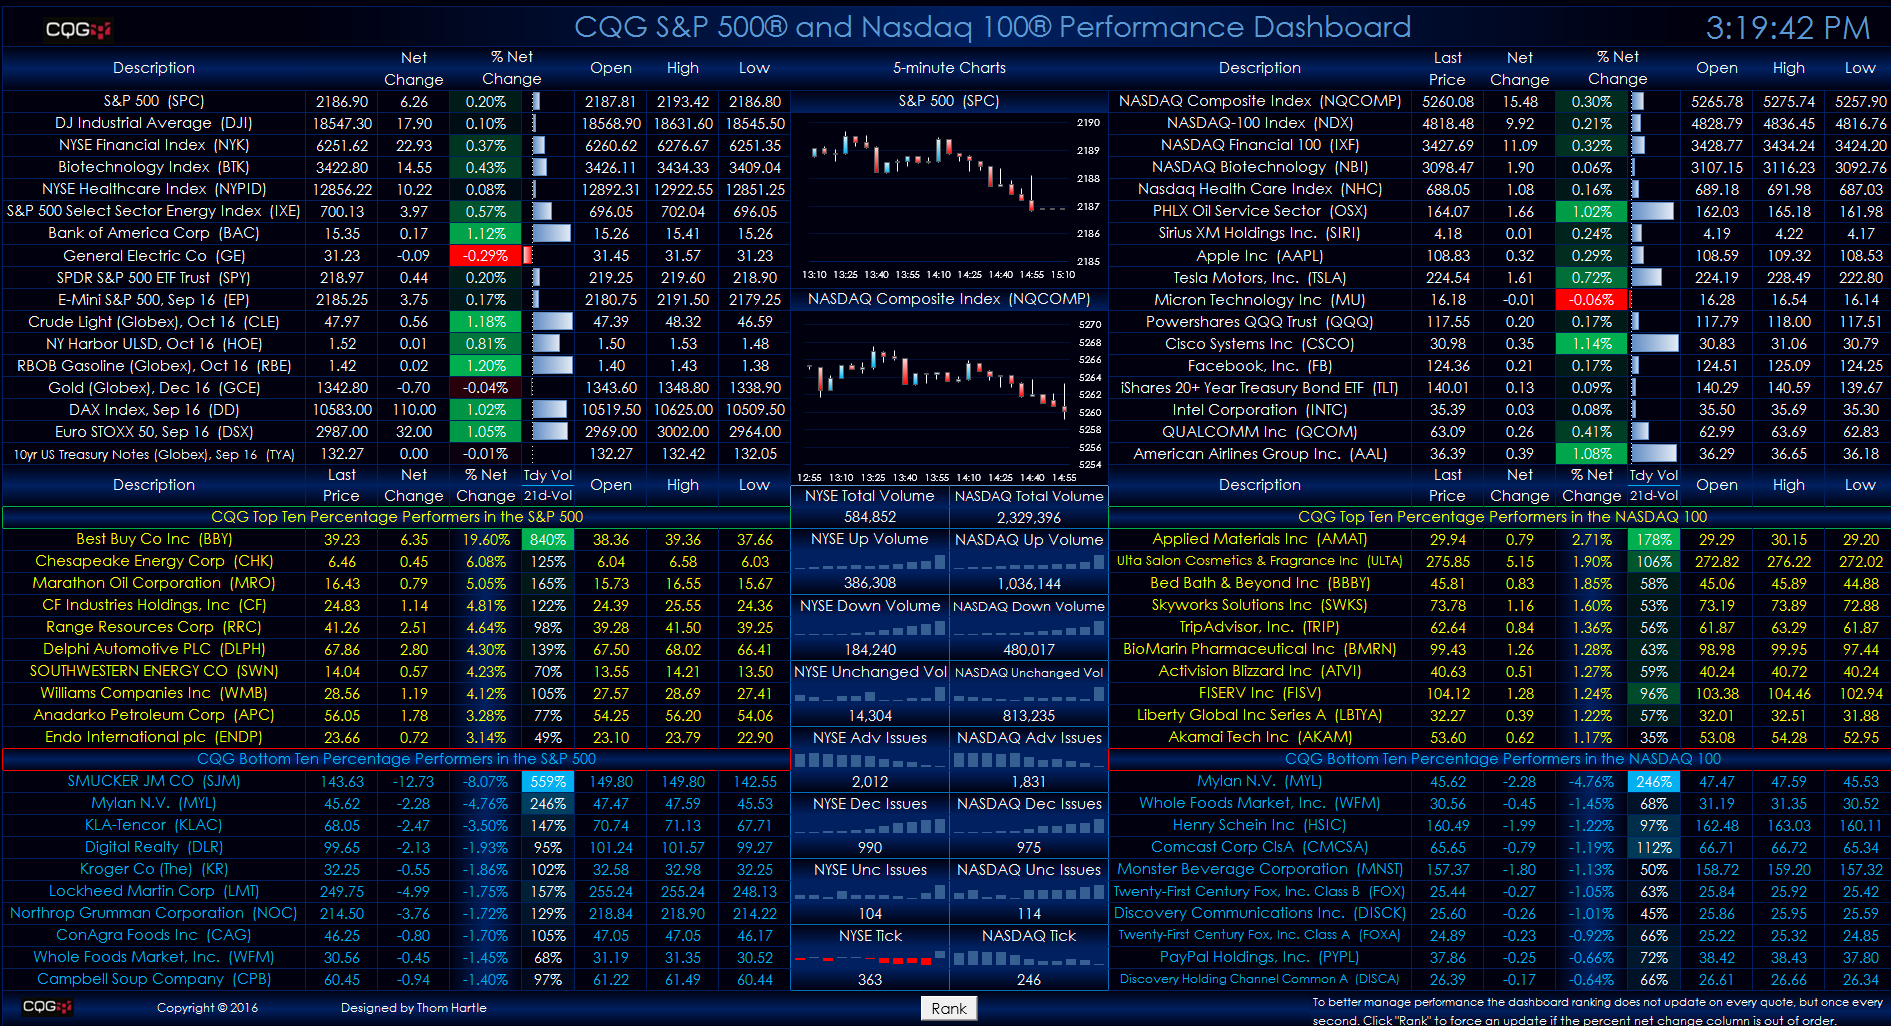
This Microsoft Excel® dashboard offers a two-window view for tracking market performance. The top half displays market data using symbols such as indices, stocks and futures that the user… more