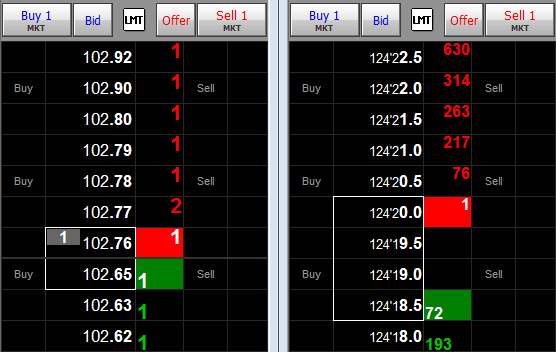
Watch this video to learn about the DOMTrader's features in CQG QTrader, including logging in to the demo vs. trading accounts, understanding each of the drop-down menus, placing and canceling… more
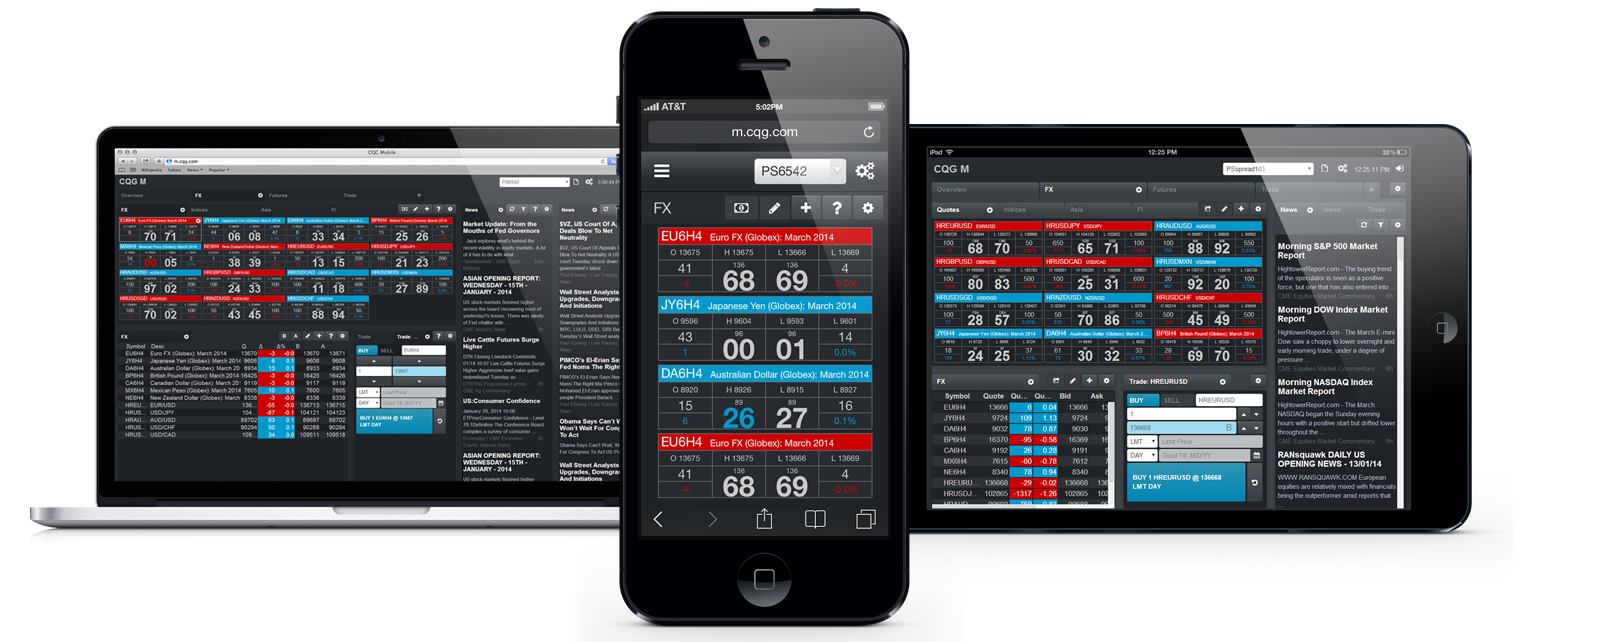
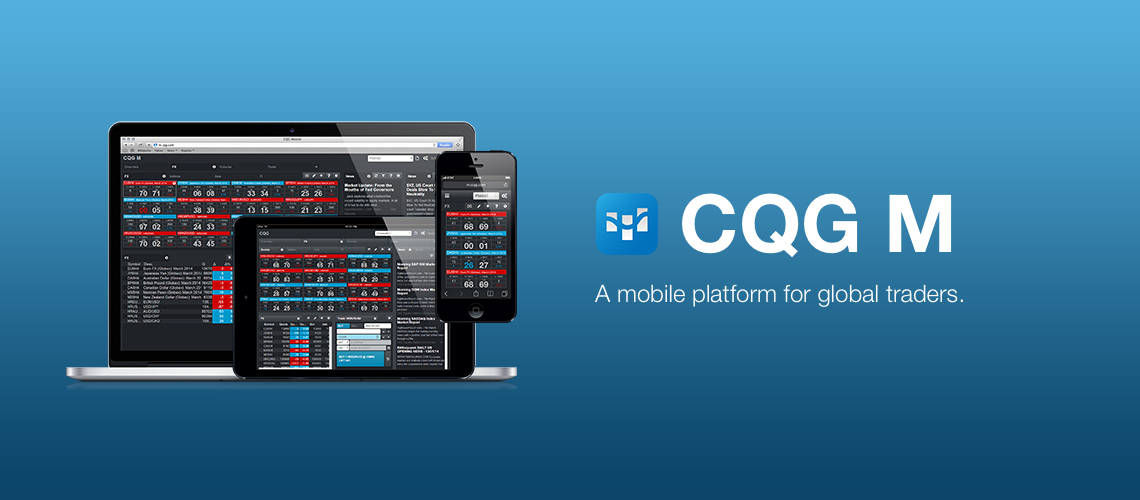
Marcus Kwan introduces CQG M, an HTML5-based mobile app that delivers market data and electronic trading on phones, tablets, PCs, and Macs.
Core Functionality Always at Hand… more
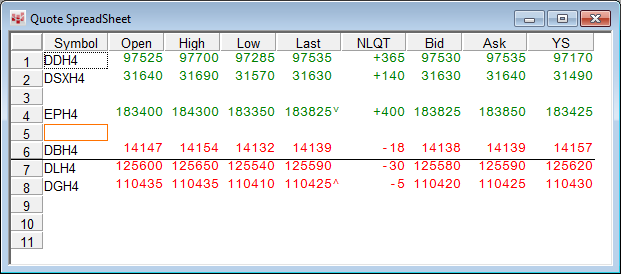
If you use Windows® 7 and have upgraded to Office 2013, you may have noticed that price updates in your CQG-powered Excel dashboards now look like little slot machine quotes with prices rolling… more
CQG's roots are in the world of market action data. The premise was that traders needed clear and informative market charts on various time frames and would use studies in conjunction with the… more
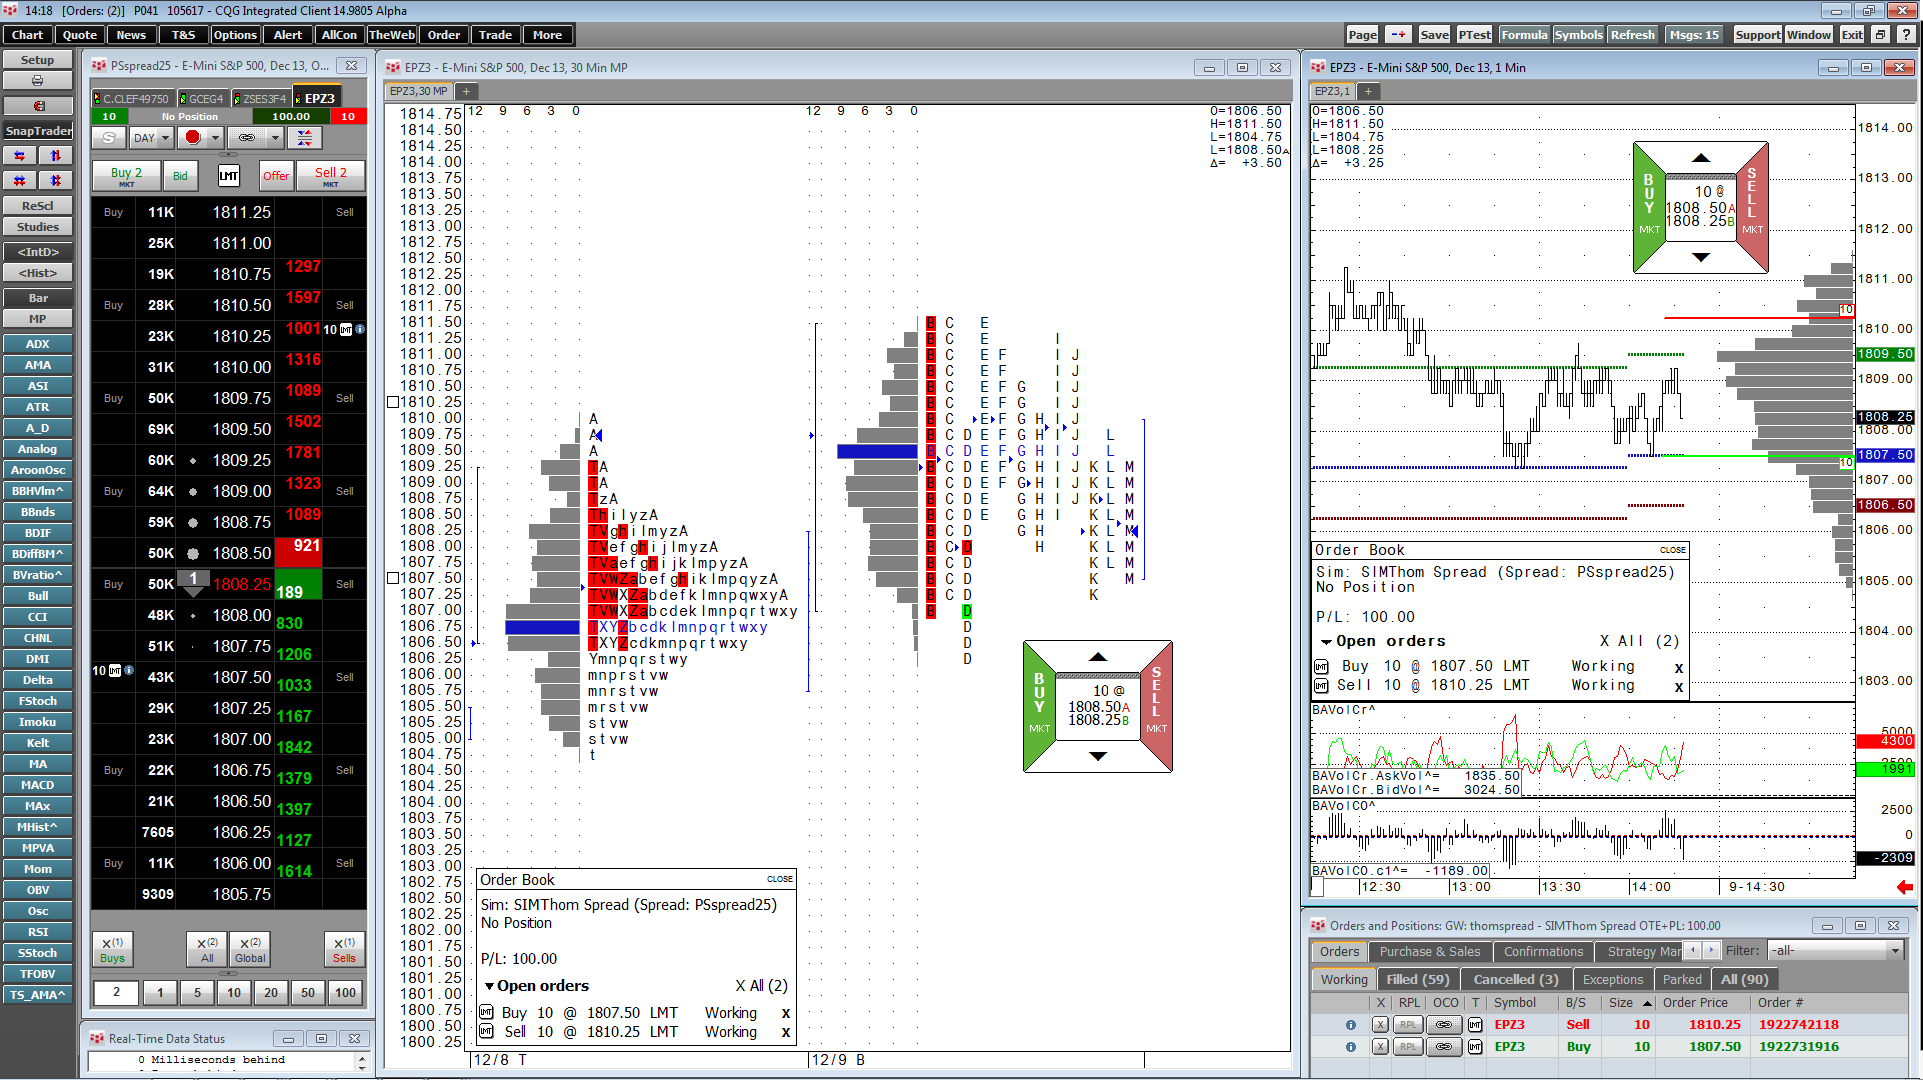
CQG Product Specialist Doug Janson covers two of the most underutilized features in CQG: DOM study values and Signal Evaluator.
DOM study values allow overlay study values to be placed into… more
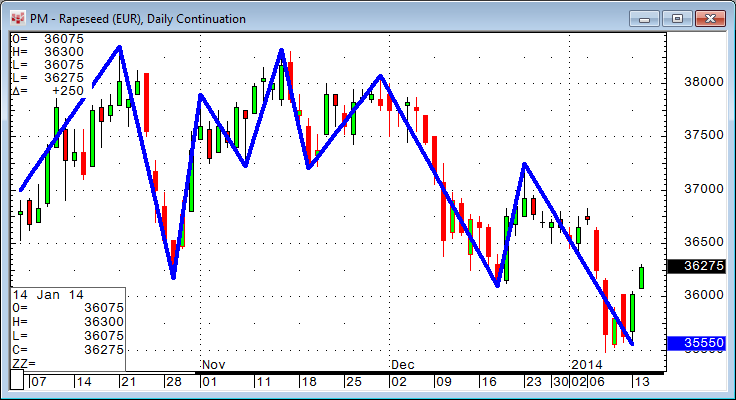
In this article, we measure the price action between a significant high and a significant low identified by CQG's ZigZag study. The ZigZag study is a useful graphical tool that connects… more
ICE, CQG, and Alexander Trading presented Tom Alexander, veteran trader and trading mentor, as he discussed the importance and key elements of a trading plan and why he believes Market Profile is… more
Denver, CO and Singapore, December 4, 2013 - CQG, Inc. today announced at FIA Asia the continued expansion of its product offering with the addition of CQG M, which provides traders with market… more
Denver, CO and Singapore, December 4, 2013 - CQG, Inc. today announced at FIA Asia the continued expansion of its product offering with the addition of CQG M, which provides traders with market… more
