In this article, we measure the price action between a significant high and a significant low identified by CQG's ZigZag study. The ZigZag study is a useful graphical tool that connects significant turning points together. The study draws a line between highs and lows based on the parameters that you set. In this way, it highlights only the price swings between highs (peaks) and lows (troughs) based on user-set parameters. It provides an especially clear picture of an instrument's trend as the price action moves from a high to a low and back.
The ZigZag study parameter for setting the number of highs or lows required to identify a significant high or low is called peak strength. To best understand this parameter, let's review the following chart and focus on the first half of November.
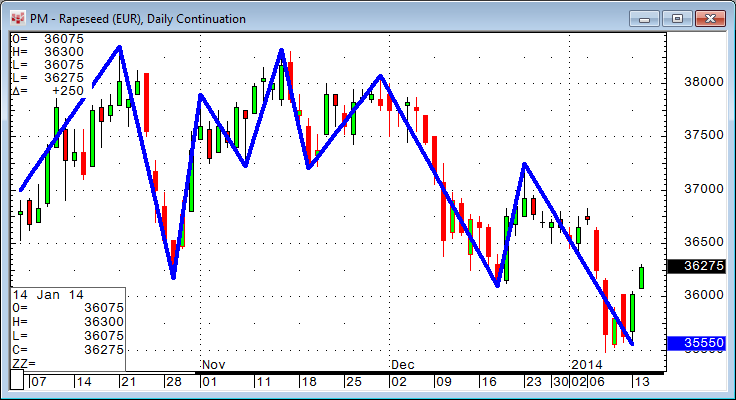
Here, the peak strength for the ZigZag study is set to 5. On November 1, that high is the highest high in the last five bars, and the line is plotted to that high. Then, on November 8, that low is the lowest low in the last five bars, so the ZigZag line is plotted to that low. Then, when the high of November 1 is surpassed, that high is the highest high over the last five bars. The market continues to trend upward and peaks on November 14, and the ZigZag study line plots to that high.
One thing to keep in mind is the peak is always correct "afterwards." We don't know if a high is the final high until a low is established, and a low is identified only if it is the lowest low in five bars back. So the ZigZag study will adjust as new prices appear on the chart.
What would be of help is to have a study that identifies the amount of price swings between the peaks and troughs identified by the ZigZag study. The remainder of this article walks you through the development of such a study.
As the first step, we need to identify the ZigZag highs. This is simple code determining that the ZigZag value is higher than the bar before and after (positive offset):
ZZ(@,5,0.0) > ZZ(@,5,0.0)[-1] AND ZZ(@,5,0.0) > ZZ(@,5,0.0)[1]
It is important to use the same coding parameters that are used for the ZigZag study on the chart. The peak strength setting we are using is 5. There are two additional parameters in the formula, ATR Factor and Offset, which here are set to 0. These two parameters are discussed at the end of the article.

Now we are able to trigger the peaks correctly, but we want to know the price levels of the highs and lows instead of their positions. This is done using the WHEN function, one of the most powerful functions in CQG:
High(@) WHEN (ZZ(@,5,0.0) > ZZ(@,5,0.0)[-1] AND ZZ(@,5,0.0) > ZZ(@,5,0.0)[1])
Because we want to calculate with the value at the end, we put it directly into a variable:
HI:= High(@) WHEN (ZZ(@,5,0.0) > ZZ(@,5,0.0)[-1] AND ZZ(@,5,0.0) > ZZ(@,5,0.0)[1]);
Now we apply the same principle for the lows:
LO:= Low(@) WHEN (ZZ(@,5,0.0) ZZ(@,5,0.0)[-1] AND ZZ(@,5,0.0) ZZ(@,5,0.0)[1]);
To verify that the calculations are correct, we can put both codes into separate curves of our custom study:

As you can see here, the high curve changes with every new high, and the low curve changes with every new low. We can use that observation to create the last piece of logic that is needed in our code:
IF(LO > LO[-1], LO-HI, IF(HI>HI[-1],HI-LO, none) )
If the LO changes (i.e., it is unequal to its value one bar before), the code calculates the LO value minus the HI value. If the HI changes, the code calculates the HI value minus the LO value. If nothing changes, the output shall be none (not zero). These are two if-then statements encapsulated together.
The simple if-then logic is: IF(1 > 0, 1, 0)
IF(here is the test, calculation if test is true, calculation if test is false)
To get to an encapsulated if-then, you need to substitute the calculation if test is false portion with the next test. This can be done multiple times:
IF(here is the test, calculation if test is true, IF(here is the test, calculation if test is true, calculation if test is false))

As these are single values, I would prefer value points appear as plus signs instead of using a line.

Hovering the mouse cursor over the plus signs reveals the exact value of each calculated point; that is the amount of price change between highs and lows identified by the ZigZag study.
In order to make the code more flexible for further use, I would replicate all the parameters from the original ZigZag study inside my custom study as well.


The final code looks like this:
HI:= High(@) WHEN (ZZ(@,PeakStrength,ATRfactor) > ZZ(@,PeakStrength,ATRfactor)[-1] AND ZZ(@,PeakStrength,ATRfactor) > ZZ(@,PeakStrength,ATRfactor)[1]);

LO:= Low(@) WHEN (ZZ(@,PeakStrength,ATRfactor)  ZZ(@,PeakStrength,ATRfactor)[-1] AND ZZ(@,PeakStrength,ATRfactor)  ZZ(@,PeakStrength,ATRfactor)[1]);

IF(LO > LO[-1], LO-HI, IF(HI>HI[-1],HI-LO, none) )
Using the ZigZag study is only an example. The conditions that determine the highs and lows of the chart can be any other method that suits your needs.
Finally, the ZigZag study has additional parameters: ATR Factor and Offset. Here are the explanations from CQG Help:
Peak Strength is used to find possible peaks. It determines the number of highs or lows that must be present before and after a particular price to define it as a peak. When a peak has been found, the ATR Factor is used to determine whether the found peak has had a significant price change using the following conditions:
When the price goes down: If high > swingPrice + ATR_Factor * (TrueRange)
When price goes up: low swingPrice + ATR_Factor * (TrueRange)
where TrueRange is calculated as MovingAverage(High-Low, 7) and swingPrice contains price when swing has been started or continued.
- Peak Strength: The peak strength determines the number of highs or lows that must be present before and after a particular price to define it as a peak.
- ATR Factor: The average true range factor determines how far the price has to be up or down to be considered a new high or low.
- Offset: The current bar cannot be accurately included in the ZigZag study because the study is dependent on future information. This parameter allows you to offset the time series.