CQG's market data information breaks down into two types of data: One is study data that can be seen on a chart, such as the high of a market from last week. The other is a label data, which is seen in quote displays, such as the open, high, low, and close of a contract. There is very limited historical data available in a quote displays. For example, you cannot check last week's high from a quote display. CQG does allow you to use label data in custom studies, which makes for some interesting tools. Here, we will review using label data as components within custom studies.
CQG's label function is available on the Add Study window under the Functions group and in the Formula toolbox. Here are a few examples of using labels.
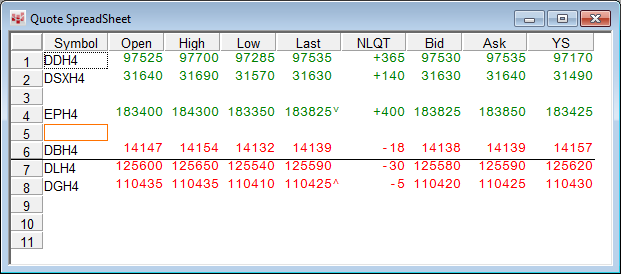
The label function allows you to pick an instrument's value and use it in another formula. Unlike using bar or study values, which change for each time period, the selected label value is used throughout the entire time range of the chart. The values you can use in this function are the current values that appear as column headers in the Quote SpreadSheet or Custom QuoteBoard.
One example is to display the current bid or ask on a chart. Here are the steps:
- Open the Define User Formulas window.
- Click the Custom Studies tab.
- Click the Toolbox button.
- Select Functions.
- Click Label.
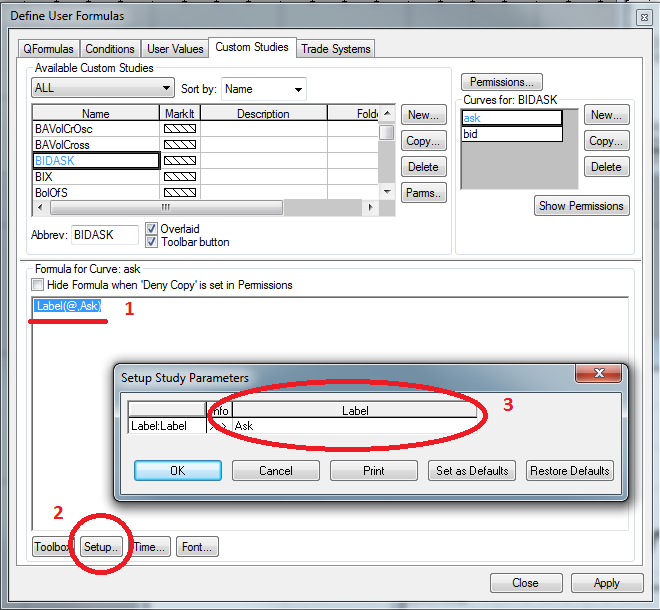
You can highlight the label (see 1 above) and select setup (see 2 above). The label parameter (see 3 above) is where you can choose from over 100 different values.
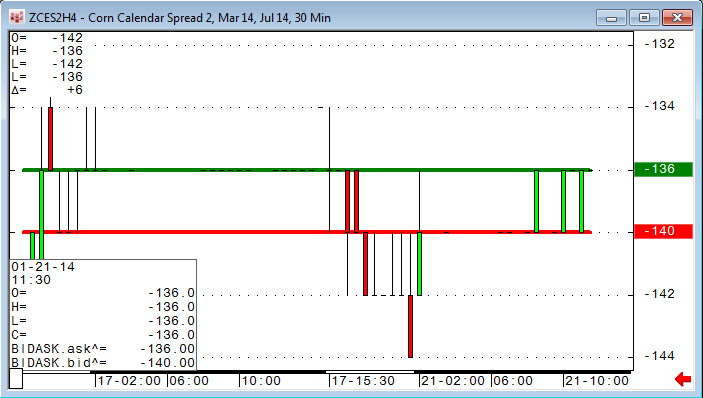
In this example, we built a simple study where curve 1 displays the ask and curve 2 displays the bid on the chart. This simple study gives a good graphical indication of the current market, especially on less liquid markets.
Another example is to display yesterday's settlement price as a reference. In this case, my custom study, SETTLE, uses the label Y_Settlement.
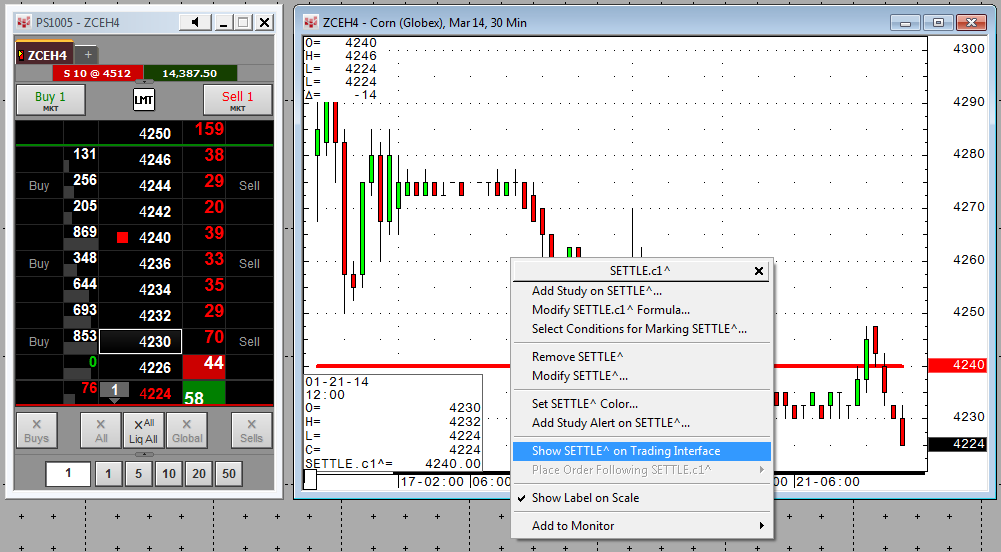
With a simple right-click on the study value on the price axis in the chart, you can choose to display this valuein the CQG trading interface.
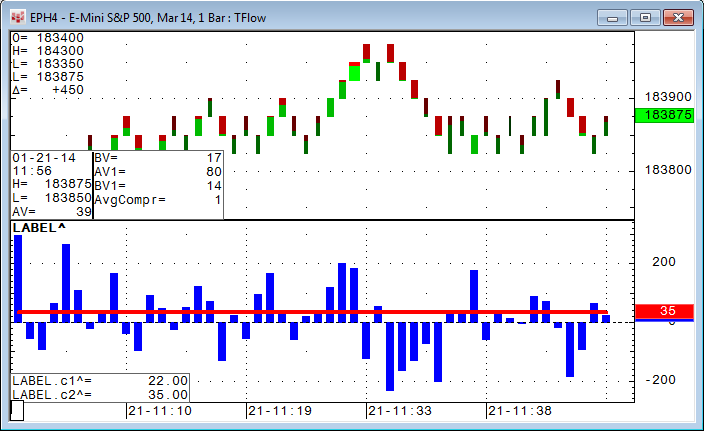
The chart above is a more sophisticated example (the component PAC for this display is available for downloading). This is a one-bar TFlow® chart with a custom study underneath it. The blue histogram is the delta (difference) between the volume that was traded on the bid and on the ask for each TFlow bar. The red line indicates the volume of the last trade. The same logic can also be used to trigger a conditional alert when one single trade goes through with an unusual number of contracts (i.e., Label(@,VolumeLastTrade) > 200).
Labels are not just confined to market data. An article I wrote in December 2013 talks about protecting your formulas using labels.
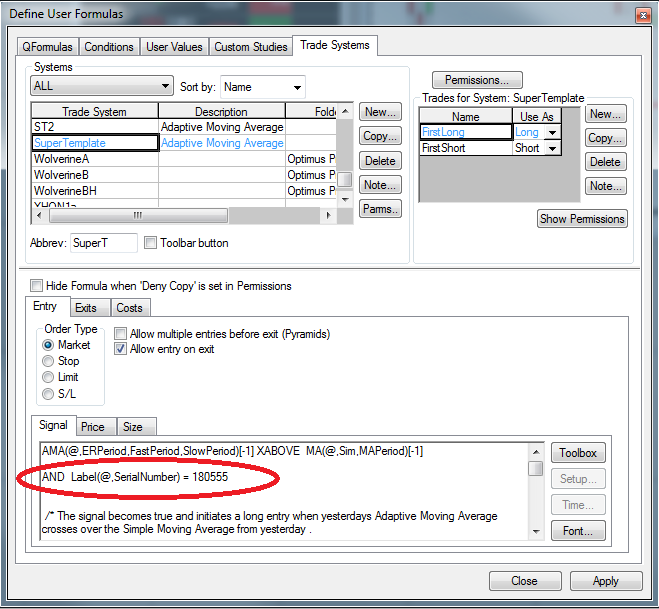
You can also use labels to allow your trading system or study to work only on systems with a unique serial number.
Label data can be easily used in your Excel dashboards. To place an RTD formula in Excel from CQG, select the cell in your QSS, right-click the cell, and choose Copy to Excel. The RTD formula will now be on your clipboard and you can paste it directly into the cell in Excel.
Using label data in your custom studies can broaden your use of CQG in your everyday workflow.