Various improvements and bug fixes.
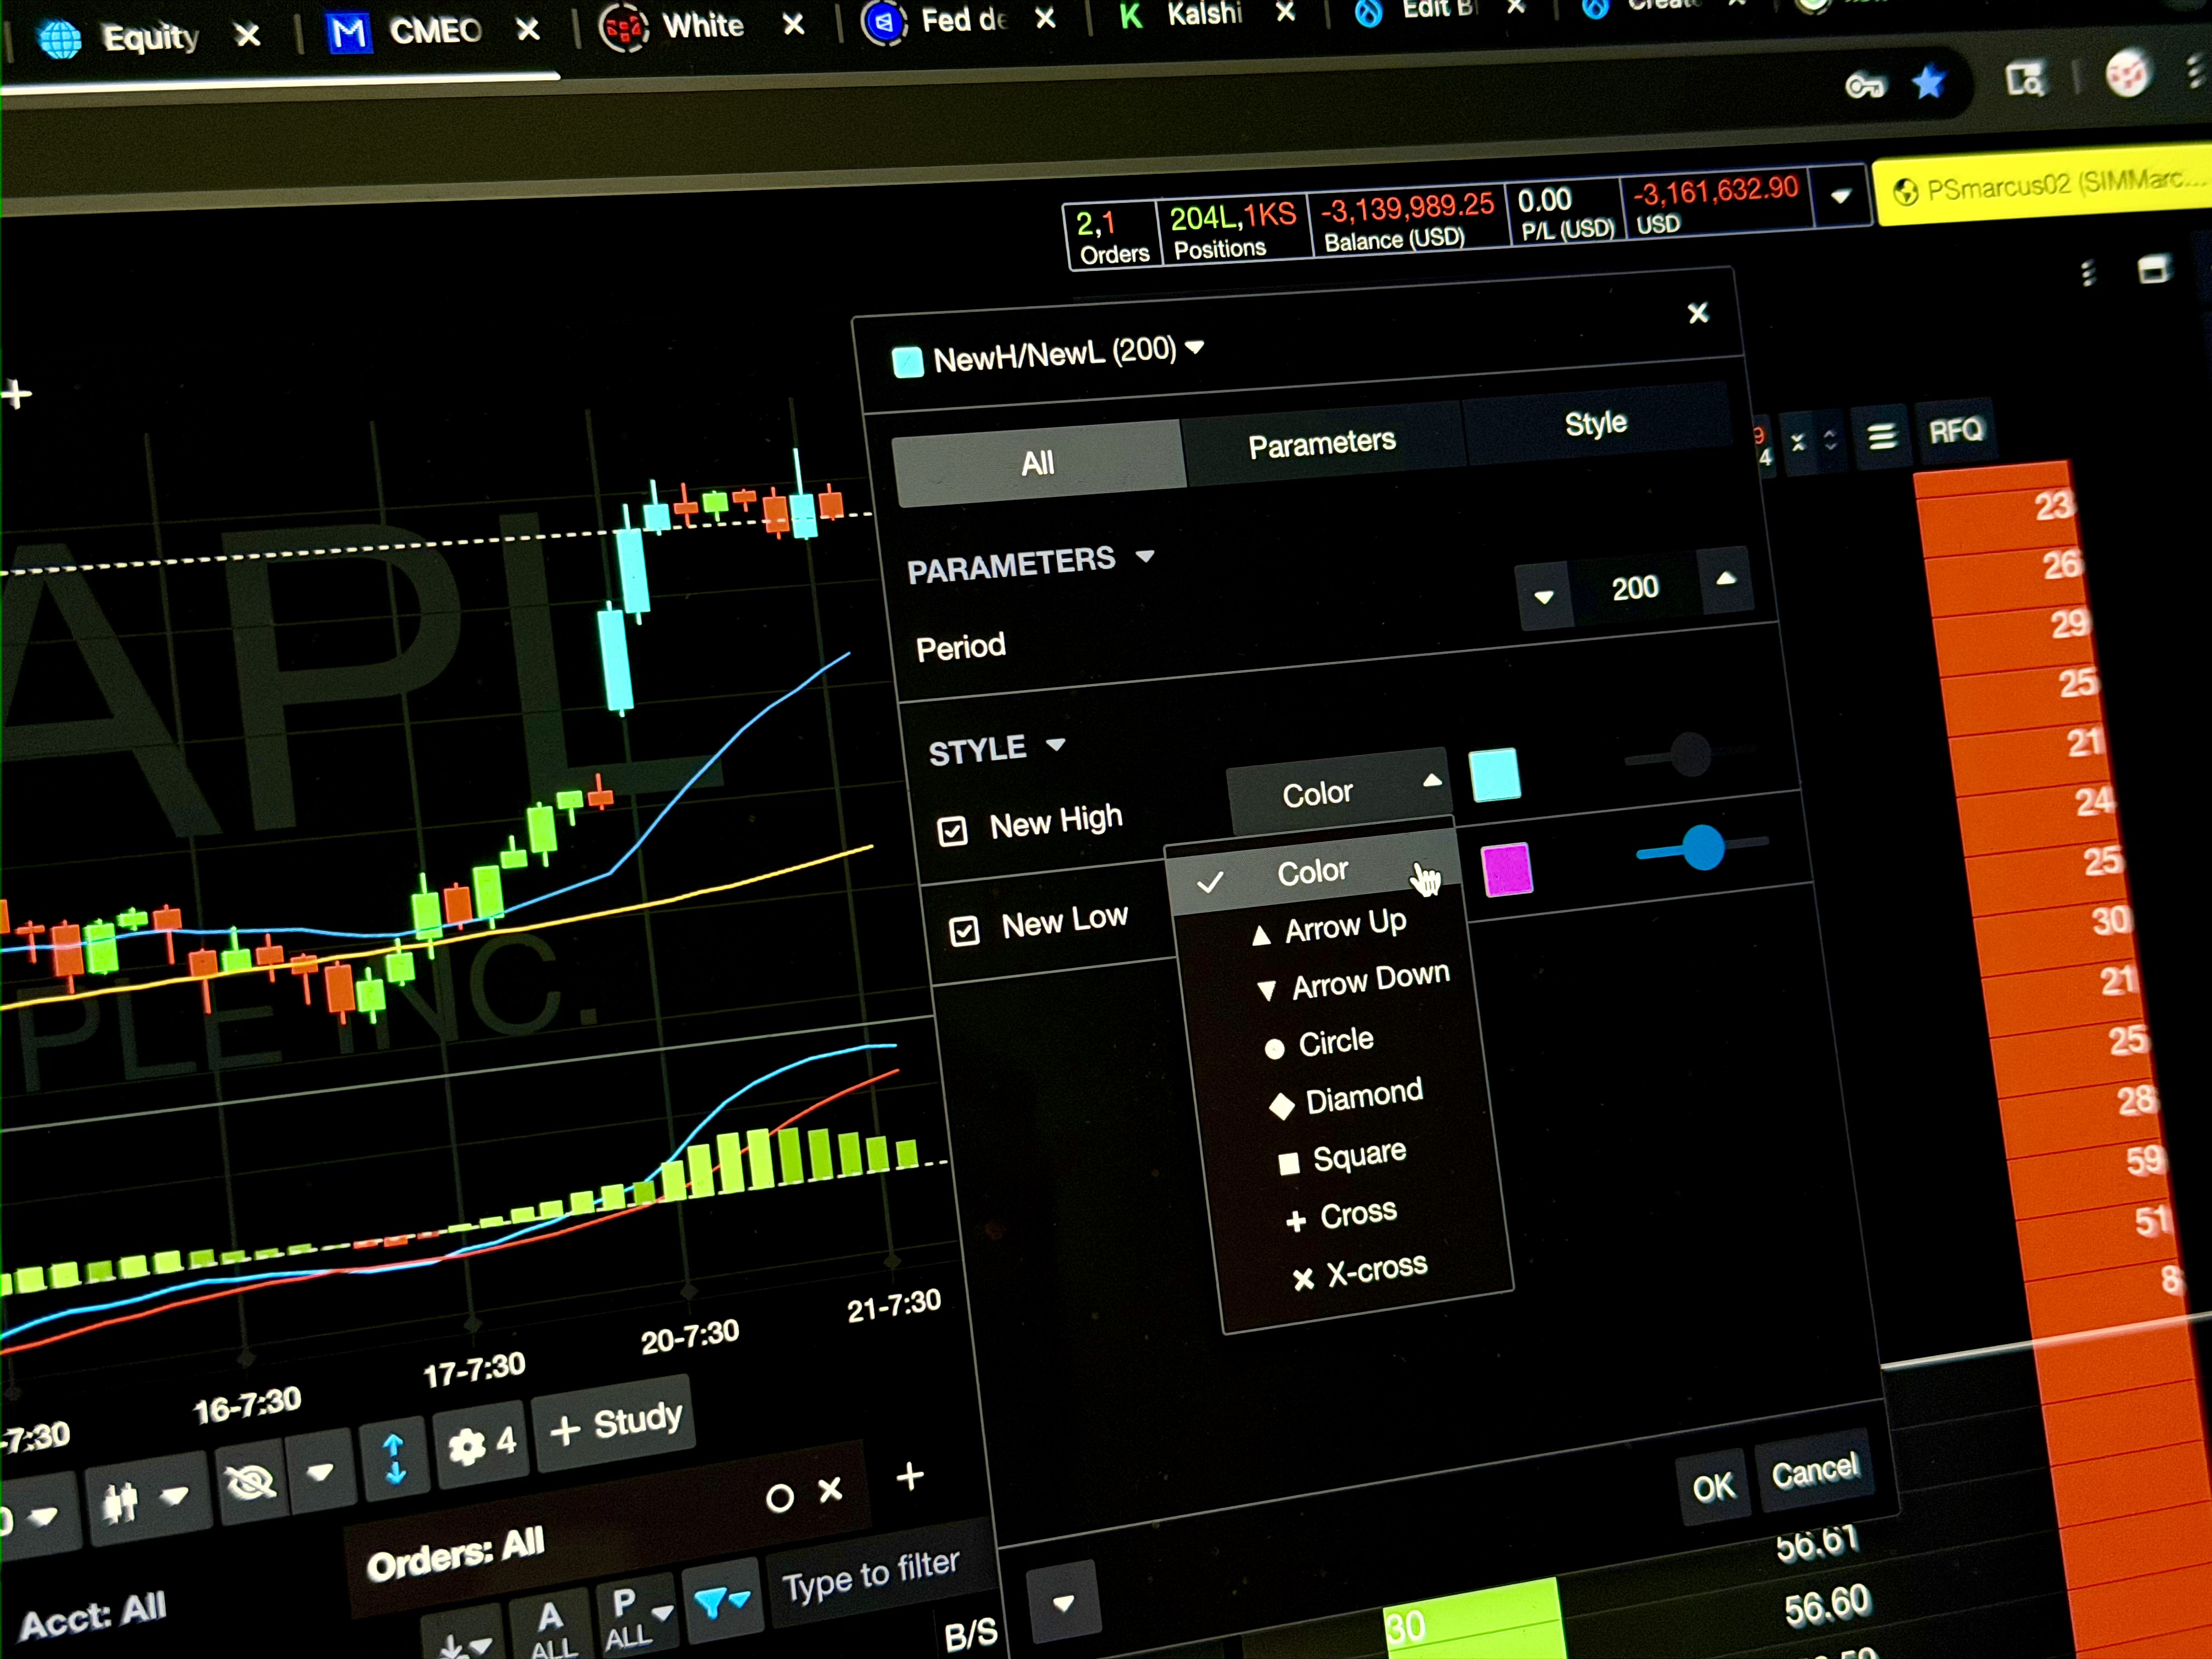
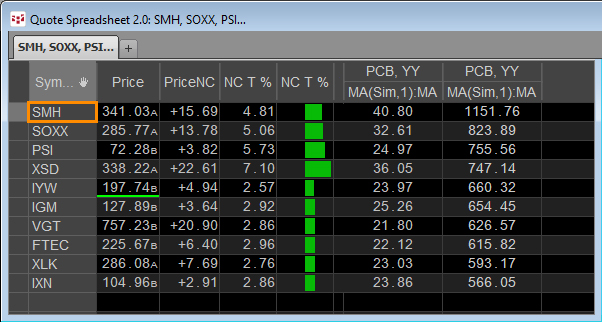
ChartAdded condition visual indicators for marking barsAdded new high/low study with conditional markersAdded color signals for MACD histogramAdded magnifier… moreThis post "Top Ten Performing ETFs for the Last Ten Years" listed the top performing ETFs since January 2015.
The top performer was VanEck Semiconductor ETF, symbol: SMH.
The VanEck… more
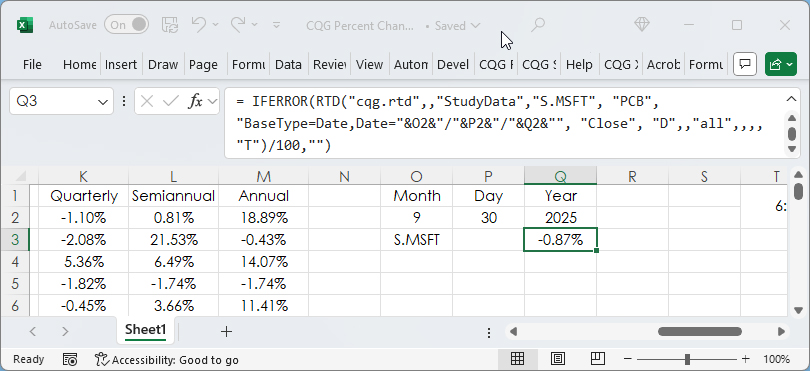
Percent Net Change is a key technique for comparing market performance among a group of markets. This post is an overview of the various Excel RTD formulas available for calculating percent net… more
This midweek look shows the Nikkei 225 (Osaka), Dec 25 contract with a +0.88% gain. The best performer in the US market is the E-mini MidCap 400, Dec 25 contract showing a gain of +3.16%.… more
Midweek, the OSE 10 Year JGB, Dec 25 contract is up +0.24%. The best performer in the US market is the 10yr US Treasury Note (Globex), Dec 25 contract, which is up +0.10%. The best… more
Each Wednesday this article will be updated with the current seasonal study using CQG's Seasonal analysis applied to the Soybean, Wheat and Corn markets. You can download the CQG pac providing the… more
This post provides 10-year analysis of the most profitable Exchange Traded Funds (ETFs) offered on the US Exchanges. At the end of the post is a downloadable CQG PAC for installing a page in CQG… more
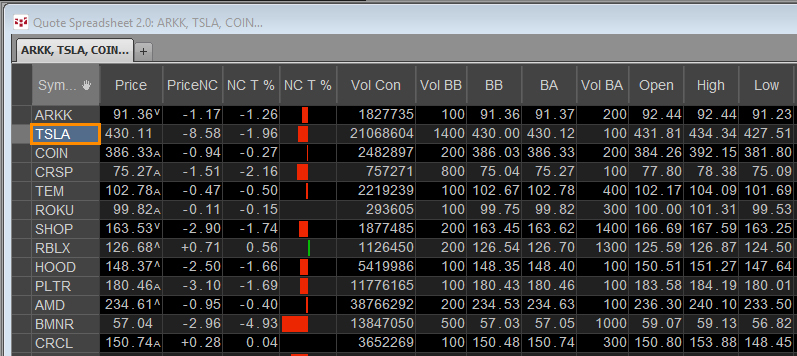
This post supplies a downloadable CQG PAC for installing a page tracking the holdings (as of 10/7/2025) of ARK Innovations ETF in CQG IC or QTrader.
From their website:
Fund Objective… more
Midweek, the OSE 10 Year JGB, Dec 25 contract is down -0.15%. The best performer in the US market is the 2yr US Treasury Note (Globex), Dec 25 contract, which is down -0.03%. The best… more
This midweek look shows the Nikkei 225 (Osaka), Dec 25 contract with a +4.77% gain. The best performer in the US market is the E-mini NASDAQ-100, Dec 25 contract showing a gain of +1.35%.… more
