This post "Top Ten Performing ETFs for the Last Ten Years" listed the top performing ETFs since January 2015.
The top performer was VanEck Semiconductor ETF, symbol: SMH.
The VanEck Semiconductor ETF (SMH®) seeks to replicate the price and yield performance of the MVIS® US Listed Semiconductor 25 Index (MVSMHTR). This index is intended to track the overall performance of companies involved in semiconductor production and equipment.
The post offered a CQG IC or QTrader PAC of a page for tracking the ten ETFs. This post offers an Excel Dashboard that tracks the holdings of the VanEck Semiconductor ETF.
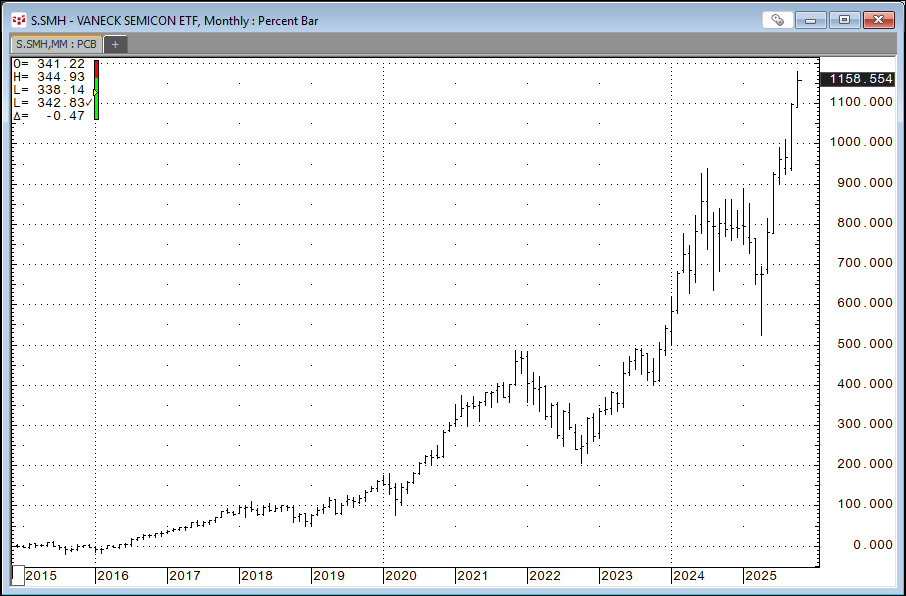
The image above shows the percentage price change in the ETF since January 2015.
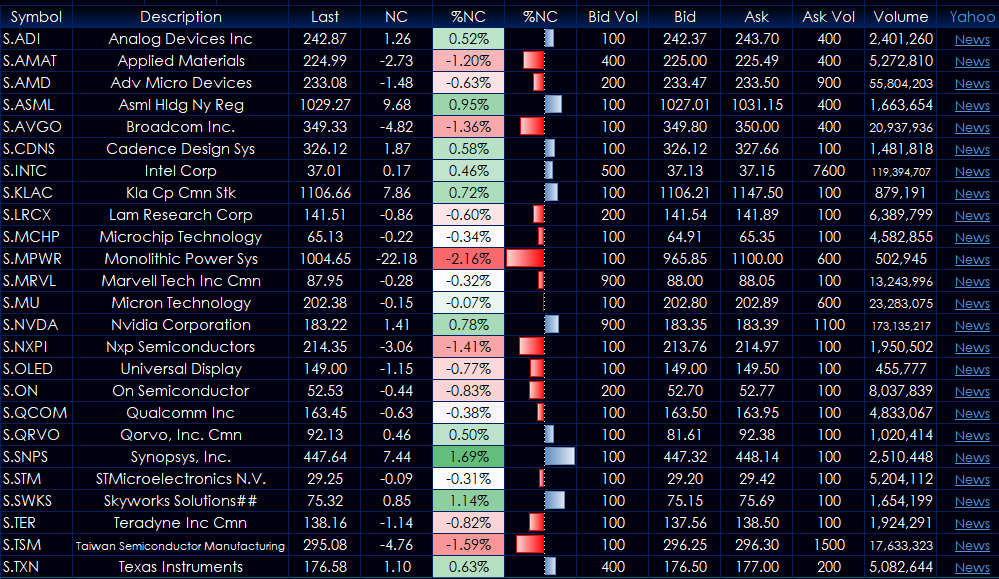
Here is a list (as of 10/13/2025) of the holdings of the ETF.
| Symbol | Company |
|---|---|
| S.ADI | Analog Devices Inc |
| S.AMAT | Applied Materials |
| S.AMD | Adv Micro Devices |
| S.ASML | Asml Hldg Ny Reg |
| S.AVGO | Broadcom Inc. |
| S.CDNS | Cadence Design Sys |
| S.INTC | Intel Corp |
| S.KLAC | Kla Cp Cmn Stk |
| S.LRCX | Lam Research Corp |
| S.MCHP | Microchip Technology |
| S.MPWR | Monolithic Power Sys |
| S.MRVL | Marvell Tech Inc Cmn |
| S.MU | Micron Technology |
| S.NVDA | Nvidia Corporation |
| S.NXPI | NXP Semiconductors |
| S.OLED | Universal Display |
| S.ON | On Semiconductor |
| S.QCOM | Qualcomm Inc |
| S.QRVO | Qorvo, Inc. Cmn |
| S.SNPS | Synopsys, Inc. |
| S.STM | STMicroelectronics N.V. |
| S.SWKS | Skyworks Solutions |
| S.TER | Teradyne Inc Cmn |
| S.TSM | Taiwan Semiconductor Manufacturing Co |
| S.TXN | Texas Instruments |
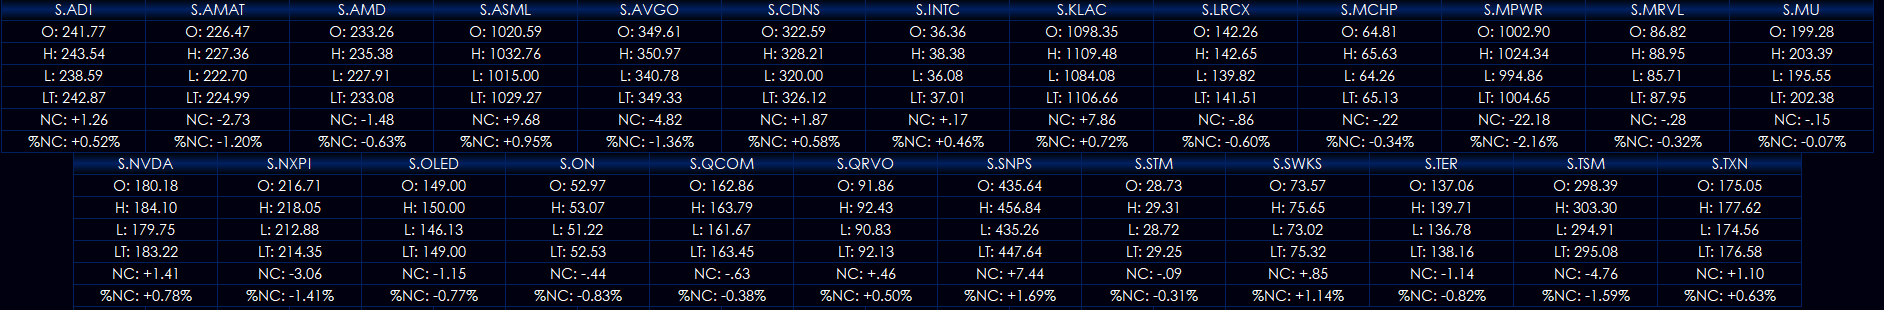
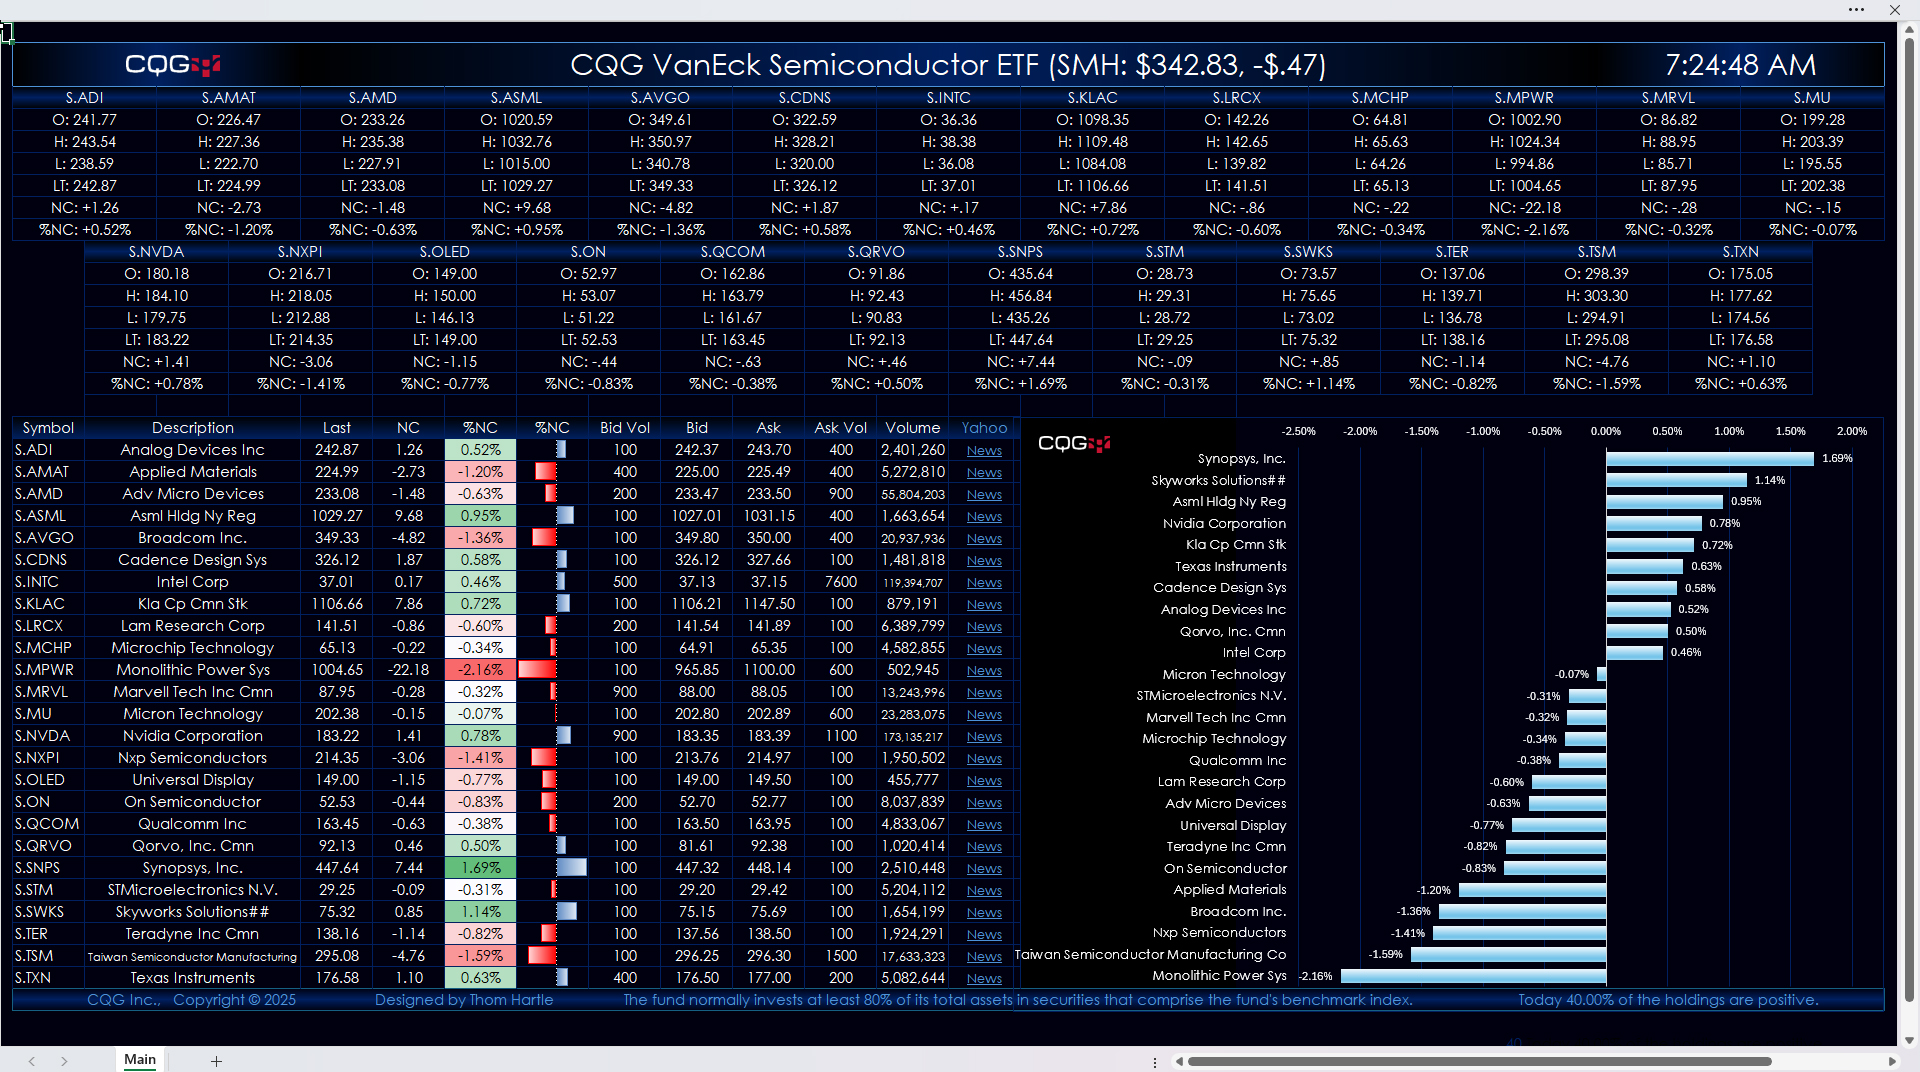
The Excel dashboard has three sections. The first section details the current session's performance of each of the 25 stocks. The data is the Open, High, Low, Last Trade, Net change, and percentage net change.
The next section are columns with the Symbol, Description, Last Trade, Net Change, % Net Change (heat mapped), % Net Change (data bars), Bid Volume, Bid, Ask, Ask Volume, Today's Volume, and links to Yahoo News for each stock.
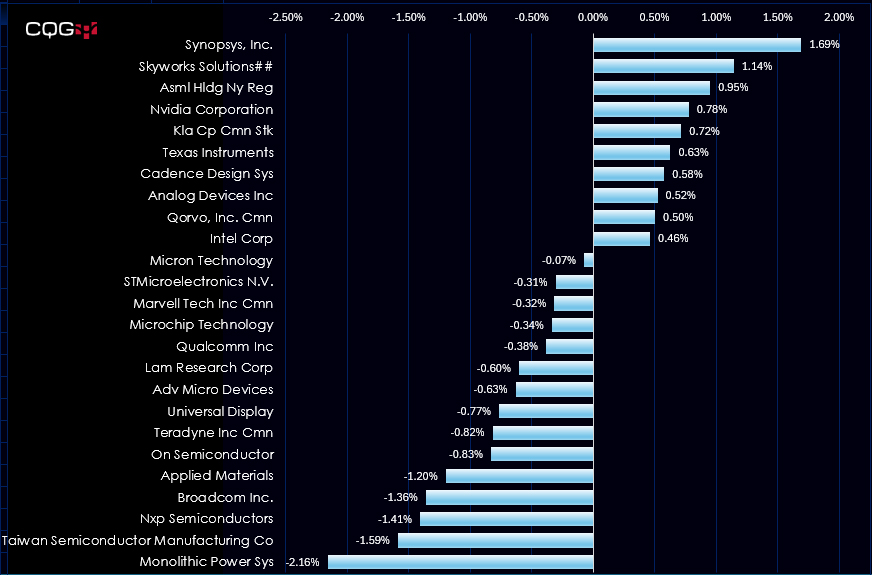
The final section is a chart displaying the ranked and sorted by percentage net change for the session for each stock.
The image below is the entire dashboard.
Requires CQG Integrated Client or CQG QTrader, data enablements for the NYSE and Nasdaq stocks. Excel 365 or more recent locally installed, not in the cloud.