Percent Net Change is a key technique for comparing market performance among a group of markets. This post is an overview of the various Excel RTD formulas available for calculating percent net change.
First, most Excel RTD functions are of two types: Contract Data and Study Data.
Excel Contract Data functions request market data information from the same internal module that powers the various Quote Spreadsheets.
Excel Study Data requests market data from the same internal module that builds charts and studies.
Nearly all the Contract Data formulas pull in market data for the current session, such as the open, high, low and close, etc. This link is to a post that explains how to pull RTD formulas directly from the Quote Spreadsheet V2: Fastest Way to Find Market Data Labels.
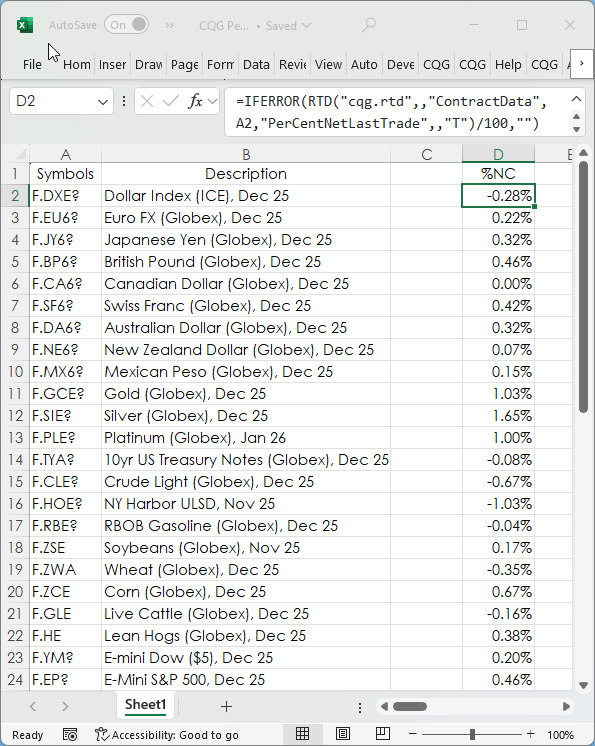
For this post, here is the RTD formula for pulling today's percent net change for the last trade:
=RTD("cqg.rtd",,"ContractData","EP","PerCentNetLastTrade",,"T")The number delivered needs to be divided by 100. Just prior to the opening for the session the server cache is cleared, and the formula delivers a blank cell. Dividing by 100 causes Excel's #VALUE error.
For aesthetic reasons all of the RTD formulas use Excel's IFERROR function to return a blank cell ("") instead of displaying the #VALUE error.
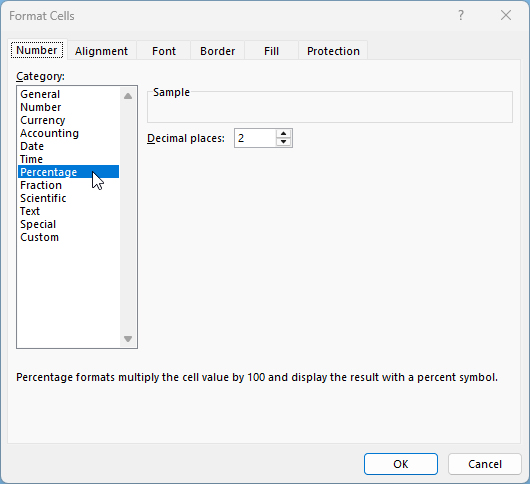
=IFERROR(RTD("cqg.rtd",,"ContractData","EP","PerCentNetLastTrade",,"T")/100,"")The cell then needs to be formatted as a percentage value. Right-click the cell, select Format Cells and then choose "Percentage."
The sample spreadsheet available at the bottom of the post includes a section using the above formula.
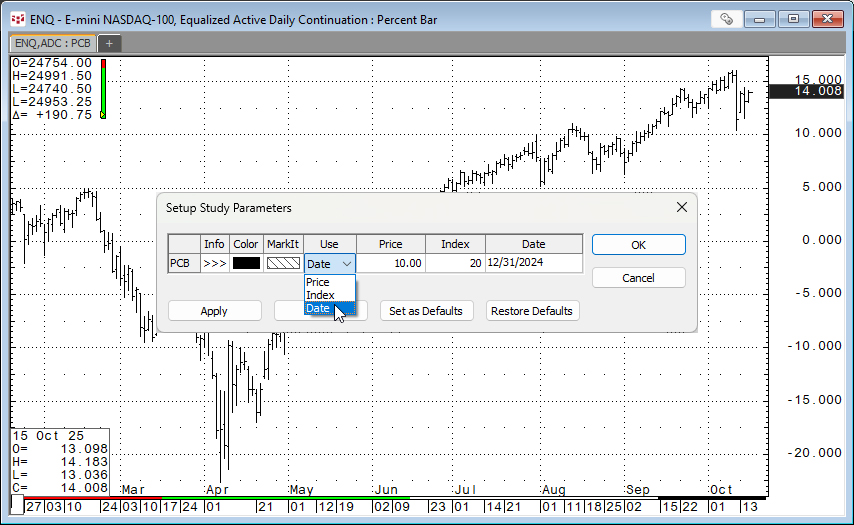
Next, is using Study Data RTD formulas for determining percent net change. The Study Data is pulling in the Percent Bar chart data. The next image shows a Percent Bar chart using the Date parameter. The chart displays the percentage net change from 12/31/2024.
There are three parameters: Price, Index, and Date. This post uses the Index and the Date parameters.
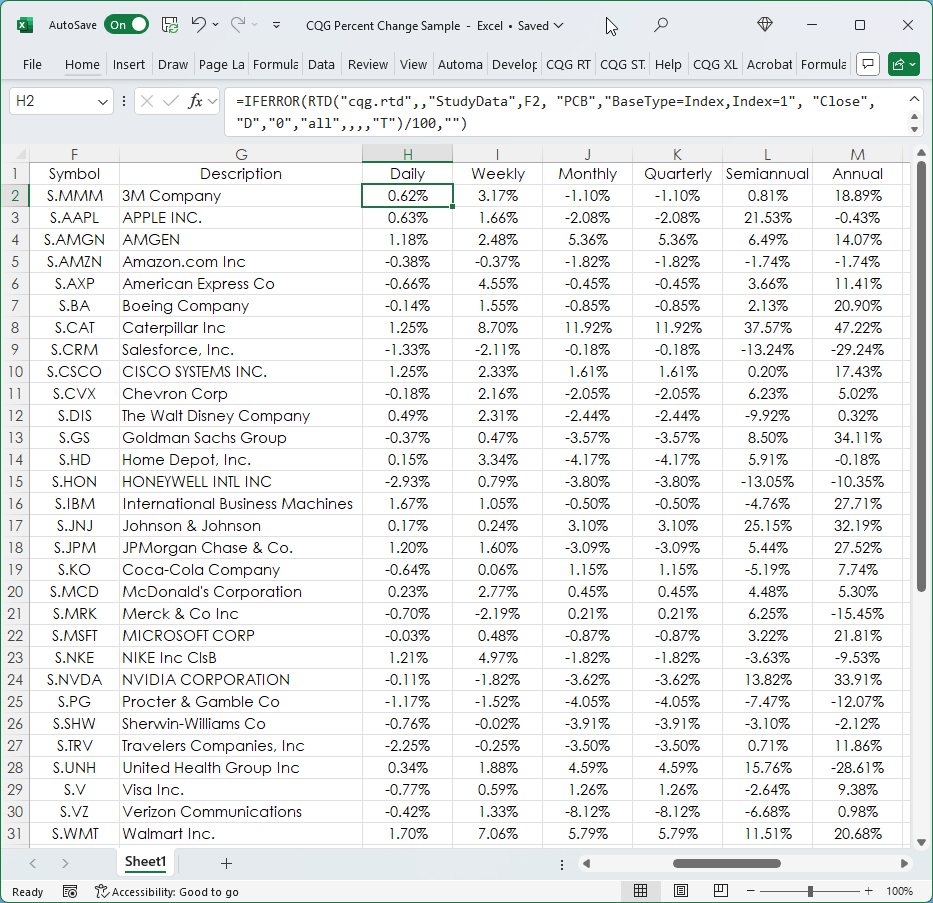
The basic RTD formula for pulling in Percent Bar chart data for Symbol "S.MSFT" is:
=RTD("cqg.rtd",,"StudyData","S.MSFT", "PCB","BaseType=Index,Index=1", "Close", "D","0","all",,,,"T")/100Above the settings are "Index" and "1". The "D" stands for Daily. The "0" is calling the current bar's value. This RTD formula pulls the current daily bar's percent net change from the previous daily bar's close.
The Excel IFERROR function is added to the RTD Percent Net Change formulas for the listed time frames.
Daily:
=IFERROR(RTD("cqg.rtd",,"StudyData","S.MSFT", "PCB","BaseType=Index,Index=1", "Close", "D","0","all",,,,"T")/100,"")Weekly:
=IFERROR(RTD("cqg.rtd",,"StudyData","S.MSFT", "PCB","BaseType=Index,Index=1", "Close", "W","0","all",,,,"T")/100,"")Monthly:
=IFERROR(RTD("cqg.rtd",,"StudyData","S.MSFT", "PCB","BaseType=Index,Index=1", "Close", "M","0","all",,,,"T")/100,"")Quarterly:
=IFERROR(RTD("cqg.rtd",,"StudyData","S.MSFT", "PCB","BaseType=Index,Index=1", "Close", "Q","0","all",,,,"T")/100,"")Semiannual:
=IFERROR(RTD("cqg.rtd",,"StudyData","S.MSFT", "PCB","BaseType=Index,Index=1", "Close", "S","0","all",,,,"T")/100,"")Annual:
=IFERROR(RTD("cqg.rtd",,"StudyData","S.MSFT", "PCB","BaseType=Index,Index=1", "Close", "A","0","all",,,,"T")/100,"")The sample spreadsheet provides the above formulas applied to the 30 stocks in the Dow Jones Industrial average.
The last formula uses the Date parameter and a date.
=IFERROR(RTD("cqg.rtd",,"StudyData","S.MSFT", "PCB","BaseType=Date,Date=9/30/2025", "Close", "D",,"all",,,,"T")/100,"")The date value is text. Therefore, if cell references are used then the date and the slashes must use concatenation.
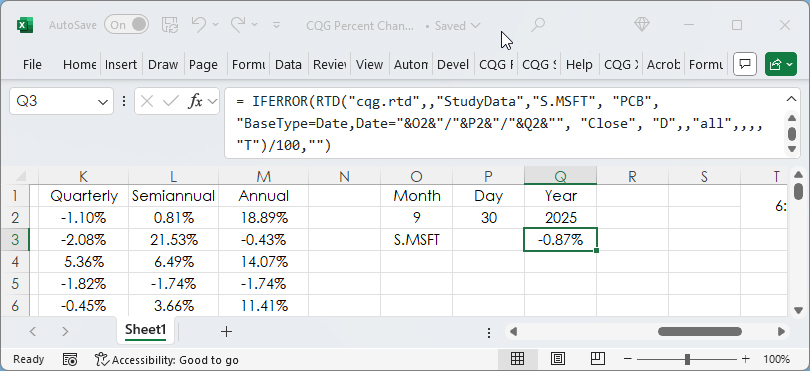
=IFERROR(RTD("cqg.rtd",,"StudyData","S.MSFT", "PCB","BaseType=Date,Date="&O2&"/"&P2&"/"&Q2&"", "Close", "D",,"all",,,,"T")/100,"")The sample spreadsheet uses all the same symbols and formulas presented in this post. The formulas are linked to the Symbols column and therefore the symbols can be changed. Use all capital letters.
Requires CQG Integrated Client or CQG QTrader, data enablements for the NYSE and Nasdaq stocks, and Excel 2016 or more recent.