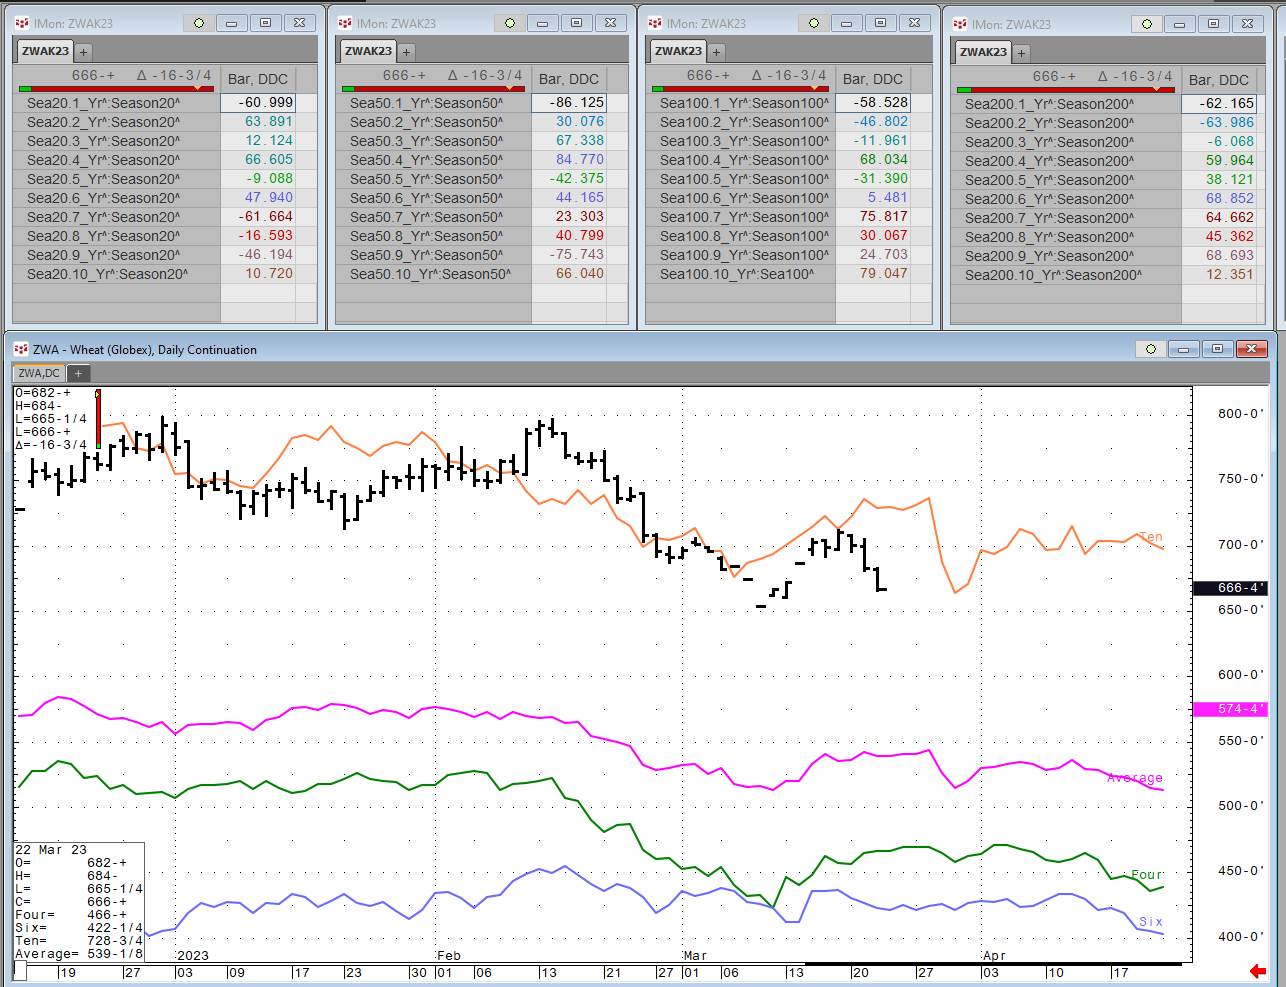
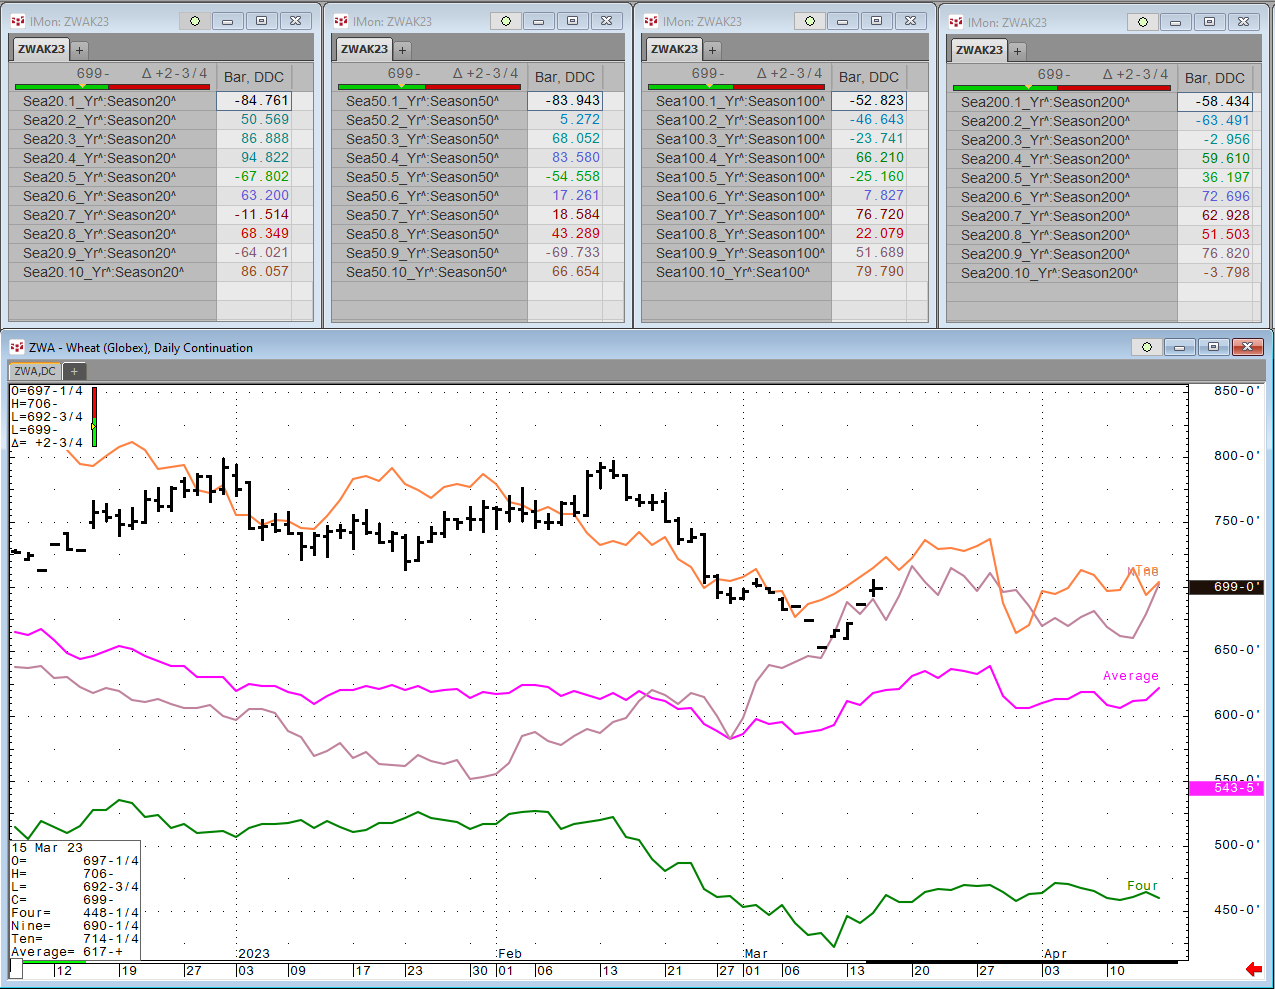
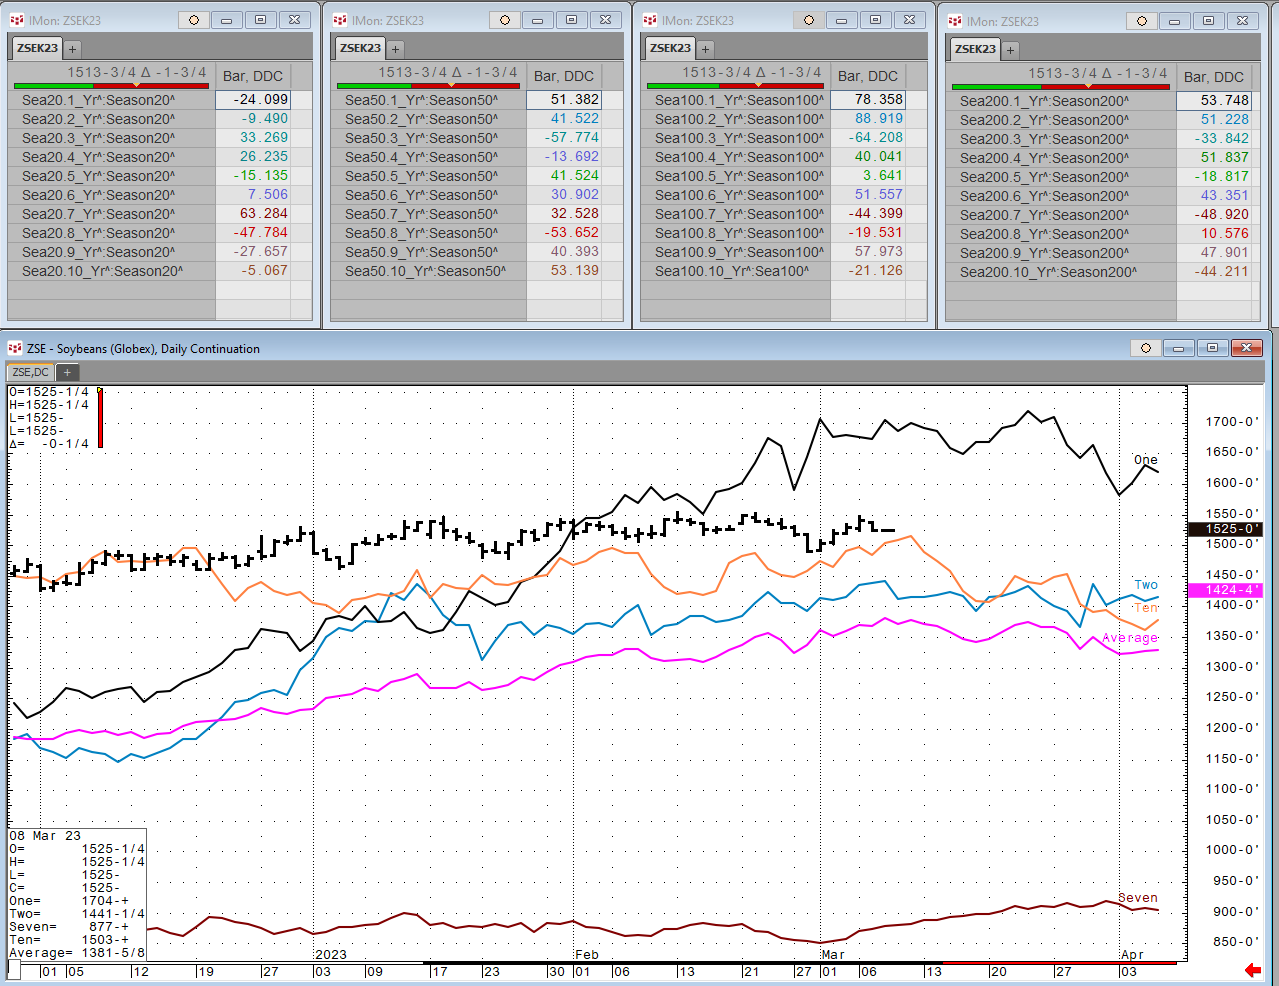
Each Wednesday this article will be updated with the current seasonal study using CQG's Seasonal analysis applied to the Soybean, Wheat and Corn markets. You can download the CQG pac providing the… more
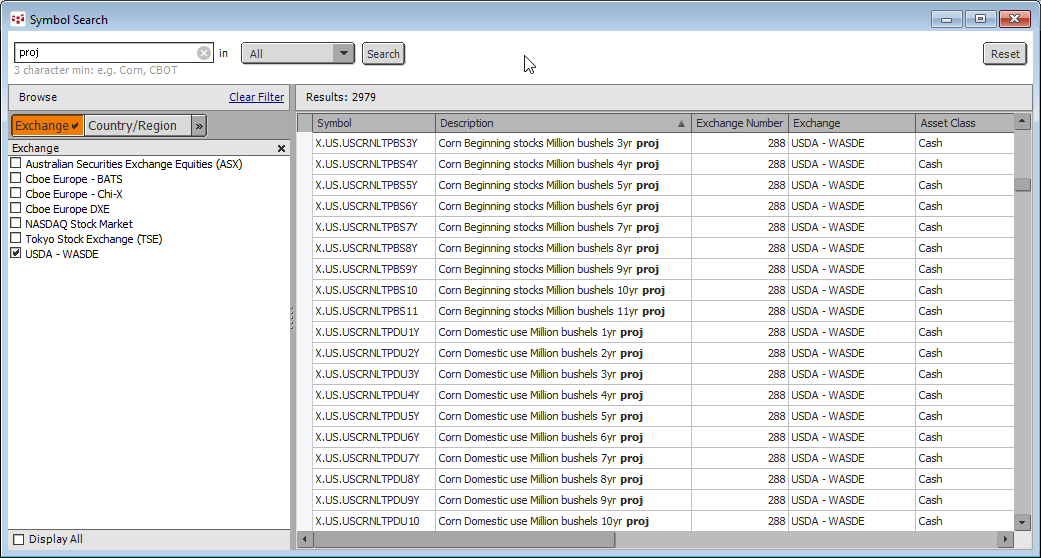
CQG's Data Quality team has added USDA WASDE Long-Term Projections to the data base. This data is published each February and the report provides projections for the agricultural sector out eleven… more
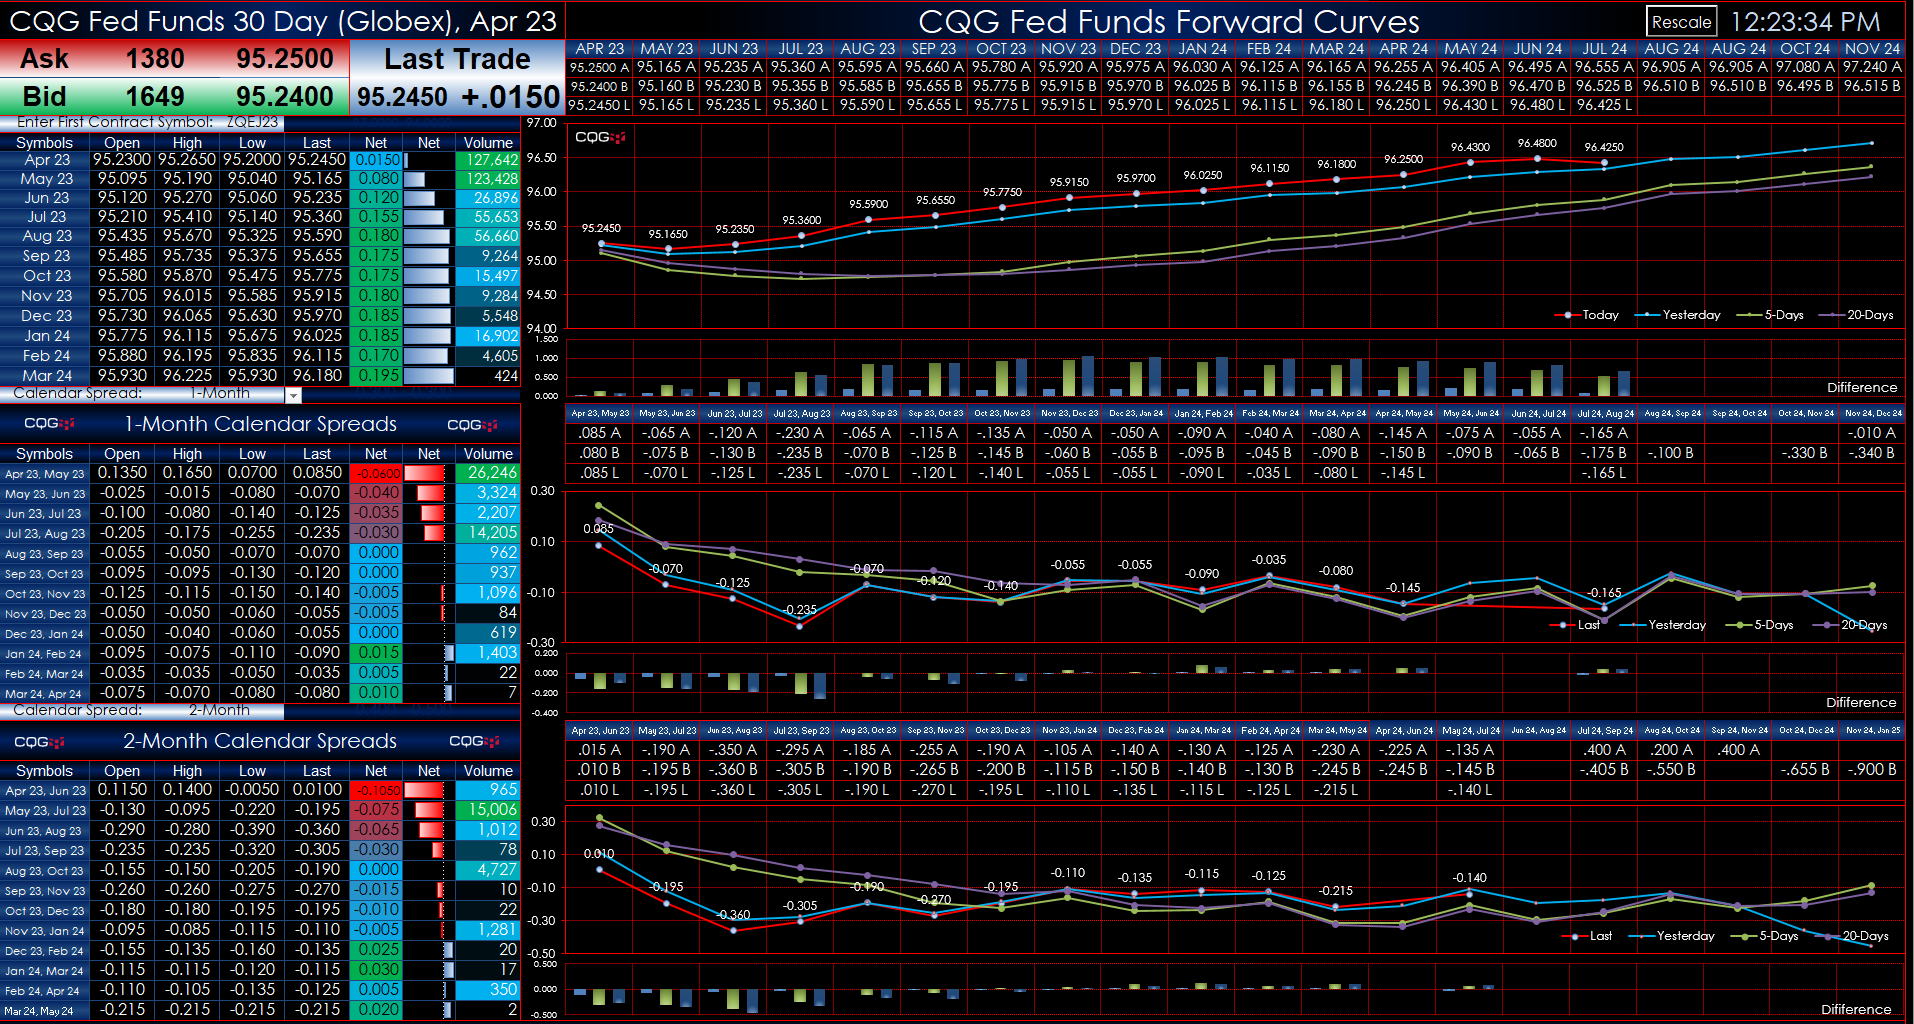
This Microsoft Excel® macro enabled dashboard pulls in the 30-Day Fed Funds market data traded on the CME Globex platform.
The Dashboard enables the user to enter in the symbol for the… more
A constant theme at NOTES FROM UNDERGROUND has been that the lunacy of Federal Reserve Chair Jerome Powell finding his inner Volcker belongs in the pantheon of fantasy. As I have said before: Paul… more
Each Wednesday this article will be updated with the current seasonal study using CQG's Seasonal analysis applied to the Soybean, Wheat and Corn markets. You can download the CQG pac providing the… more
Each Wednesday this article will be updated with the current seasonal study using CQG's Seasonal analysis applied to the Soybean, Wheat and Corn markets. You can download the CQG pac providing the… more
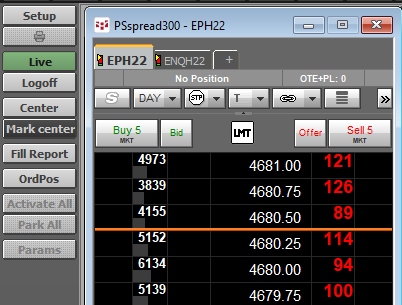
The Mark Center Button when toggled on will place an orange horizontal line on the DOM display when the Center button is pressed.
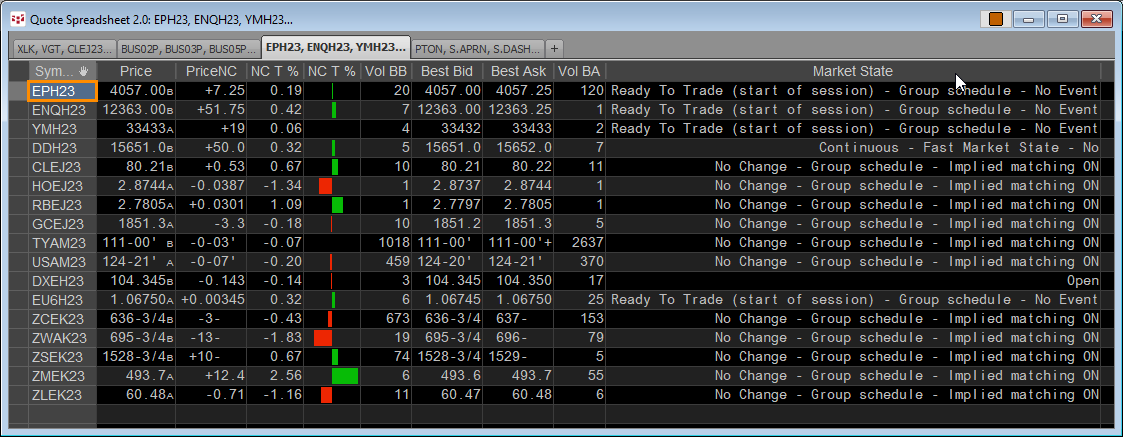
A new Data label for Quote Displays: Market State. The Trading Day proceeds through distinct periods, known as market states. A market state defines the types of activity allowed. Market states… more
An additional parameter has been added to the Range and Renko chart: Start Point. Select Session, Week, or Month.
