
This midweek look shows the Nikkei 225 (Osaka), Mar 26 contract, up with a gain of +1.00%. The best performer in the US market is the E-mini NASDAQ 100, Mar 26 contract showing a gain of +0… more
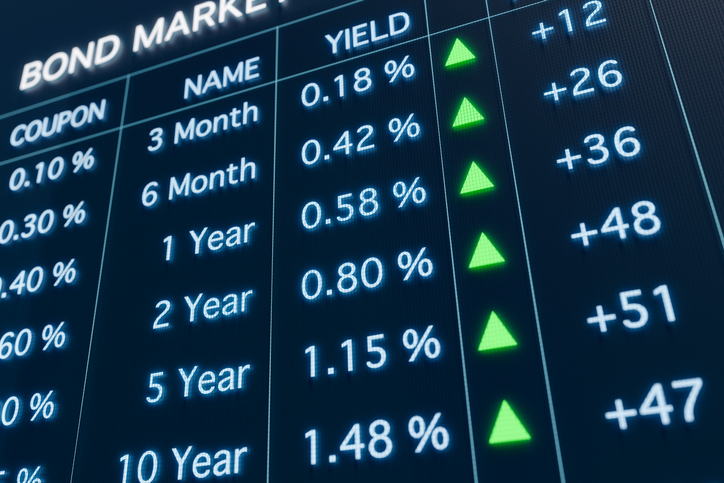
Midweek, the OSE 10 Year JGB, Mar 26 contract is up +0.40%. The best performer in the US market is the 30yr US Treasury Bond (Globex), Mar 26 contract, which is down -0.16%. The best… more

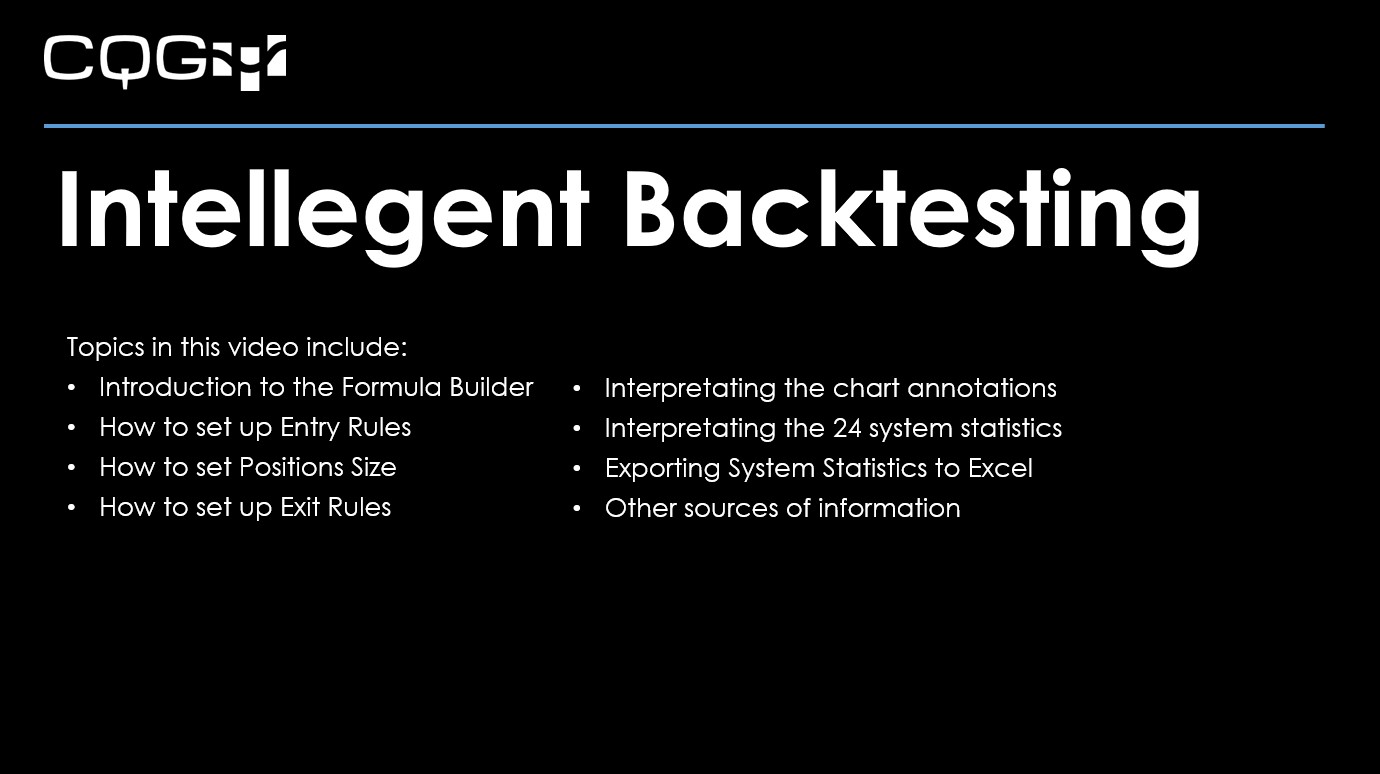
This video, presented by CQG Product Specialist Helmut Mueller, walks you through applying the CQG Trade System Optimizer (TSO) to a basic system programmed in CQG IC. This video is a follow up to… more

This video walks you through setting up your pages in CQG One or CQG Desktop. For best viewing, click "Watch on YouTube" and then full screen. Topics in this video include:
Introduction to the… more
This midweek look shows the Nikkei 225 (Osaka), Mar 26 contract, up with a gain of +6.78%. The best performer in the US market is the E-mini NASDAQ 100, Mar 26 contract showing a gain of +0… more
Midweek, the OSE 10 Year JGB, Mar 26 contract is up +0.20%. The best performer in the US market is the 30yr US Treasury Bond (Globex), Mar 26 contract, which is up +0.43%. The best… more

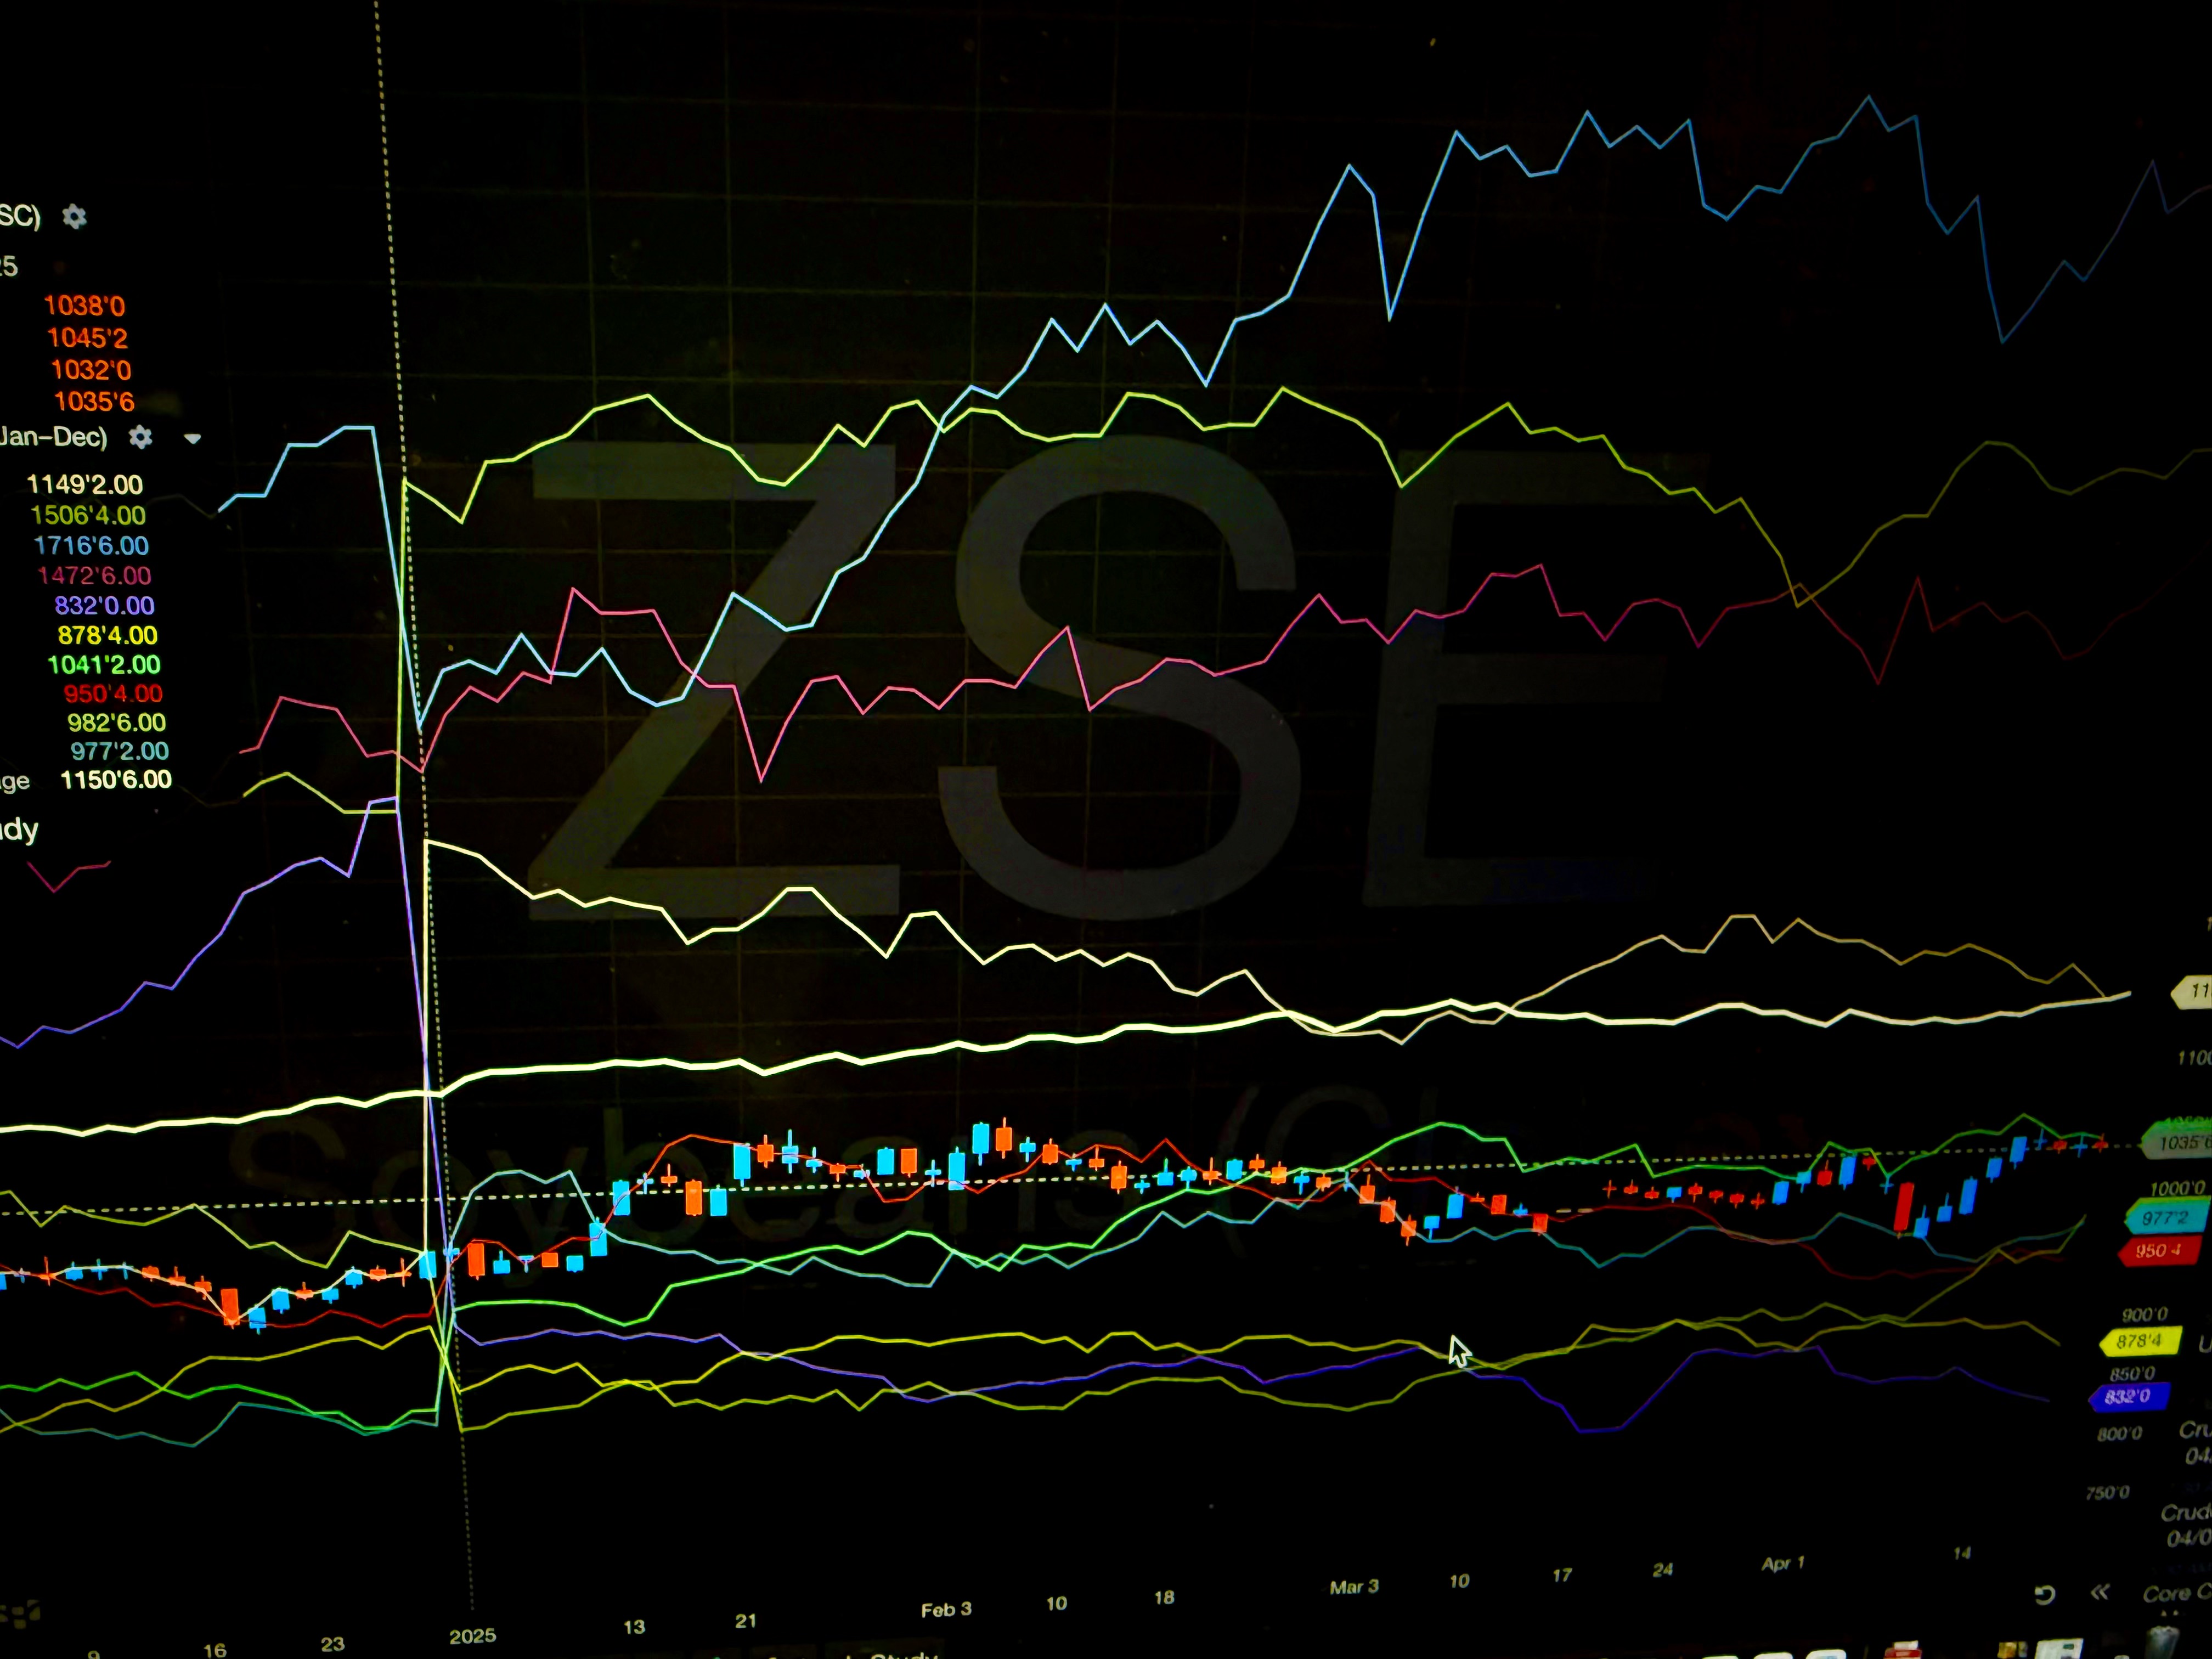
Each Wednesday this article will be updated with the current seasonal study using CQG's Seasonal analysis applied to the Soybean, Wheat and Corn markets. You can download the CQG pac providing the… more
Various improvements and bug fixes.
TradingAdded total profit/loss values in brackets dialogImproved layout of trading confirmsImproved close trade button for OCO ordersChartingAdded rescale… more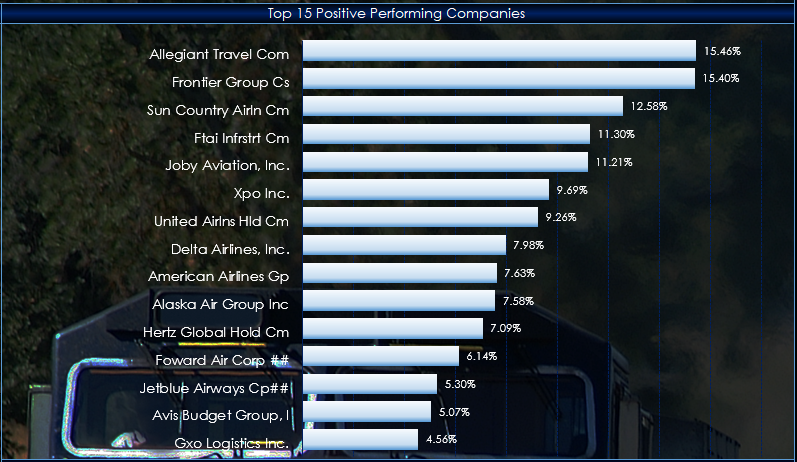
This post details a Microsoft Excel dashboard that tracks the day's performance of the holdings of the iShares Transportation Average ETF (Symbol: IYT).
The stock market media has been… more
This video walks you through the basic steps to building your first trading system in CQG IC.
For best viewing, click "Watch on YouTube" and then full screen.
Topics in this video… more