
Midweek, the TSE 10 Year JGB, Jun 25 contract is up +0.05%. The best performer in the US market is the 30yr US Treasury Bond (Globex), Jun 25 contract, which is up 0.75%. The best performer… more
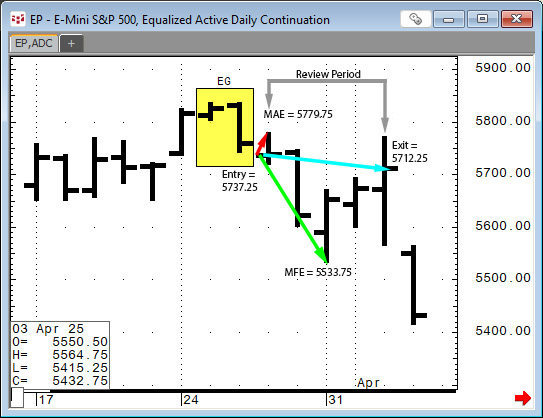
This post provides a guideline to reviewing the outcomes of a pattern recognition approach to the markets.
Two recent posts on Workspaces discussed CQG's Candlestick Formations Study.
… more
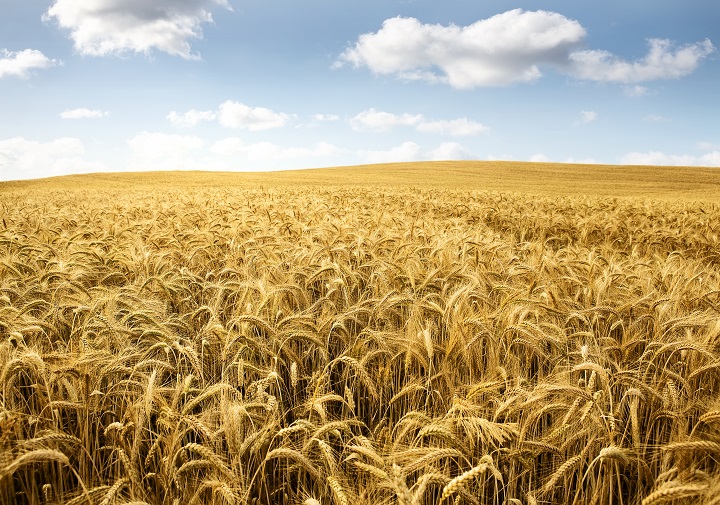
Each Wednesday this article will be updated with the current seasonal study using CQG's Seasonal analysis applied to the Soybean, Wheat and Corn markets. You can download the CQG pac providing the… more
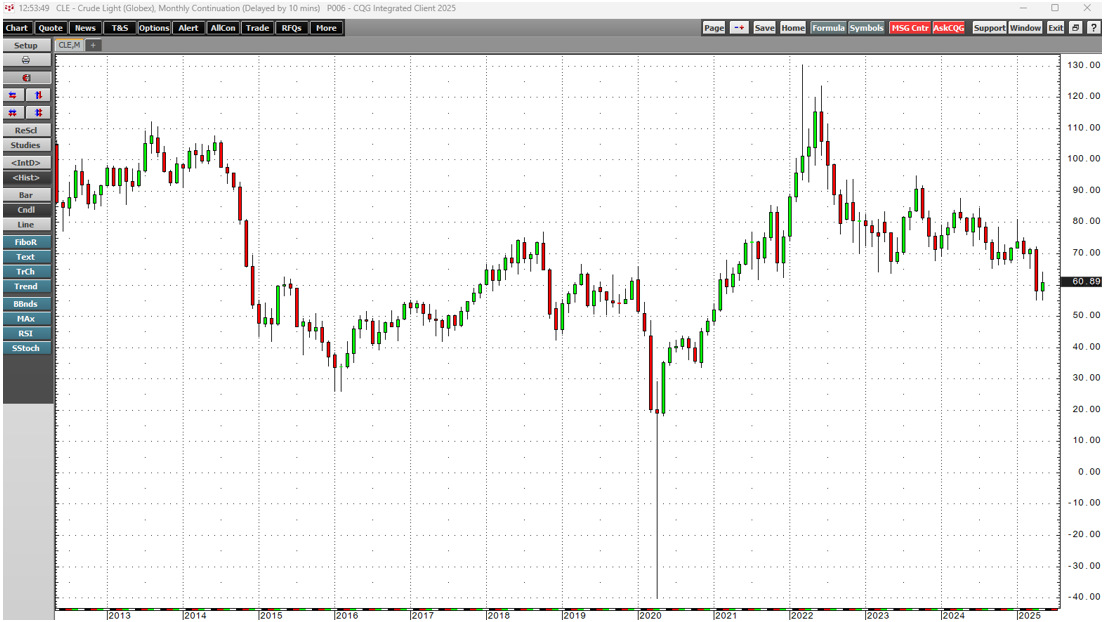
Crude oil prices have been falling since 2022, when they reached the highest price since 2008 at $130.50 on the nearby NYMEX WTI futures contract. Meanwhile, the energy commodity's pivot point has… more

This midweek look shows the Nikkei 225 (Osaka), Jun 25 contract with a -+1.83% gain. The best performer in the US market is the E-mini NASDAQ-100, Jun 25 contract showing a gain of +1.85%.… more
Midweek, the TSE 10 Year JGB, Jun 25 contract is up +0.17%. The best performer in the US market is the 30yr US Treasury Bond (Globex), Jun 25 contract, which is up 0.62%. The best performer… more
Each Wednesday this article will be updated with the current seasonal study using CQG's Seasonal analysis applied to the Soybean, Wheat and Corn markets. You can download the CQG pac providing the… more
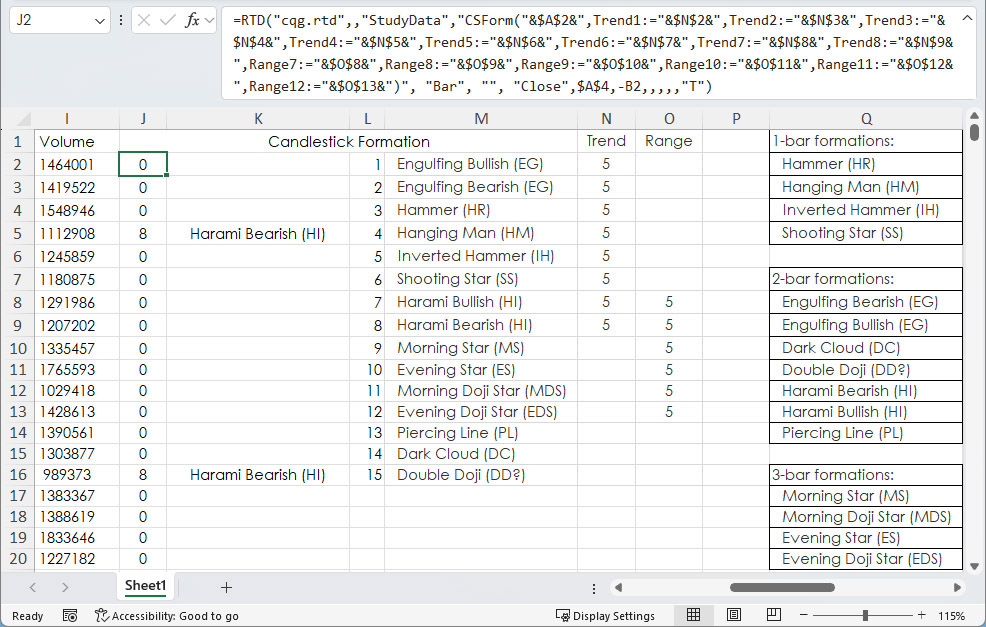
A recent post "CQG Primer: Candlesticks Formations Study" introduced this study available in CQG IC and QTrader. The study is a collection of fifteen conditions. The Candlestick formations appear… more
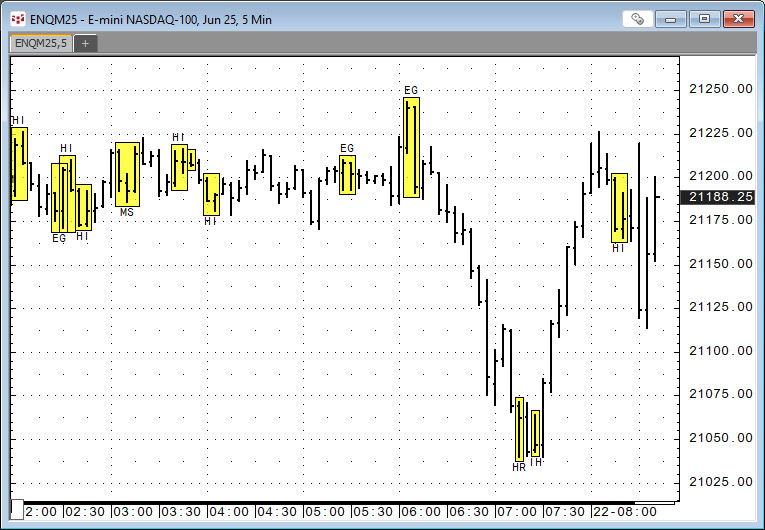
CQG IC and QTrader offer the Candlestick Formations study.
The Candlestick Formations study is a collection of conditions. Candlestick formations appear as overlays on the chart in the… more
Midweek, the TSE 10 Year JGB, Jun 25 contract is down -0.61%. The best performer in the US market is the 2yr US Treasury Note (Globex), Jun 25 contract, which is down -0.04%. The best… more