
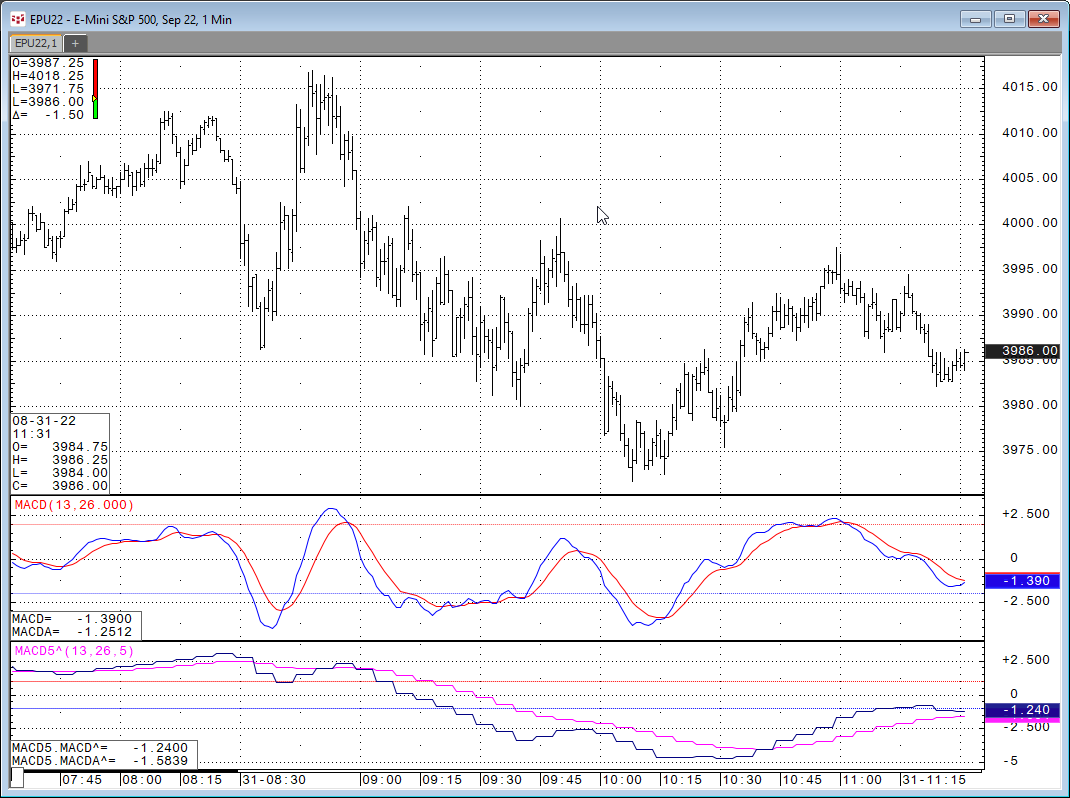
Let's say you want to look at a study on a chart but you want the study to use a different time frame than the time frame for the bars. For example, the MACD Study on a 1-minute chart using 5-… more
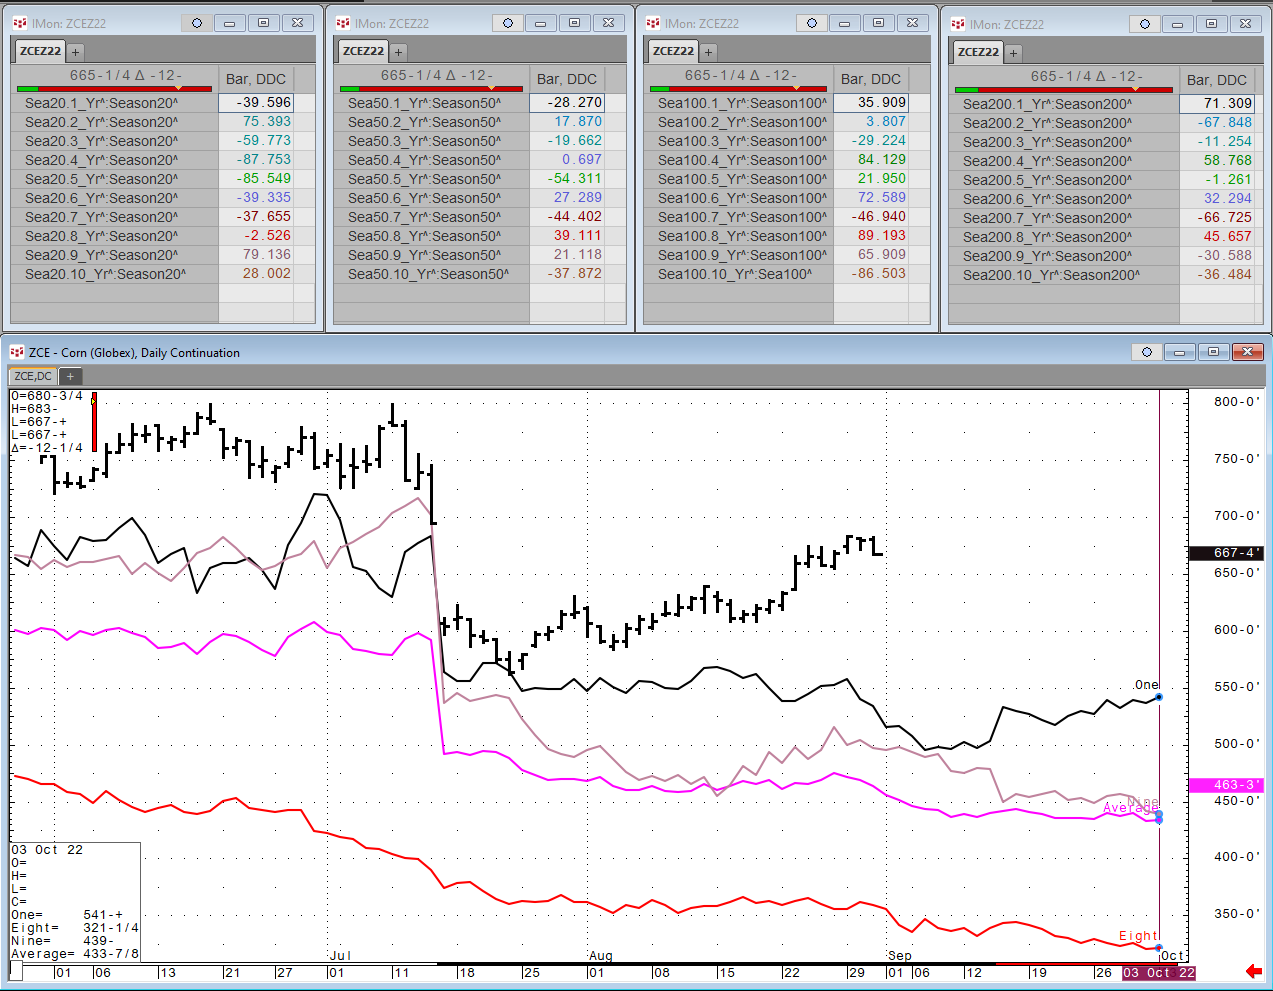
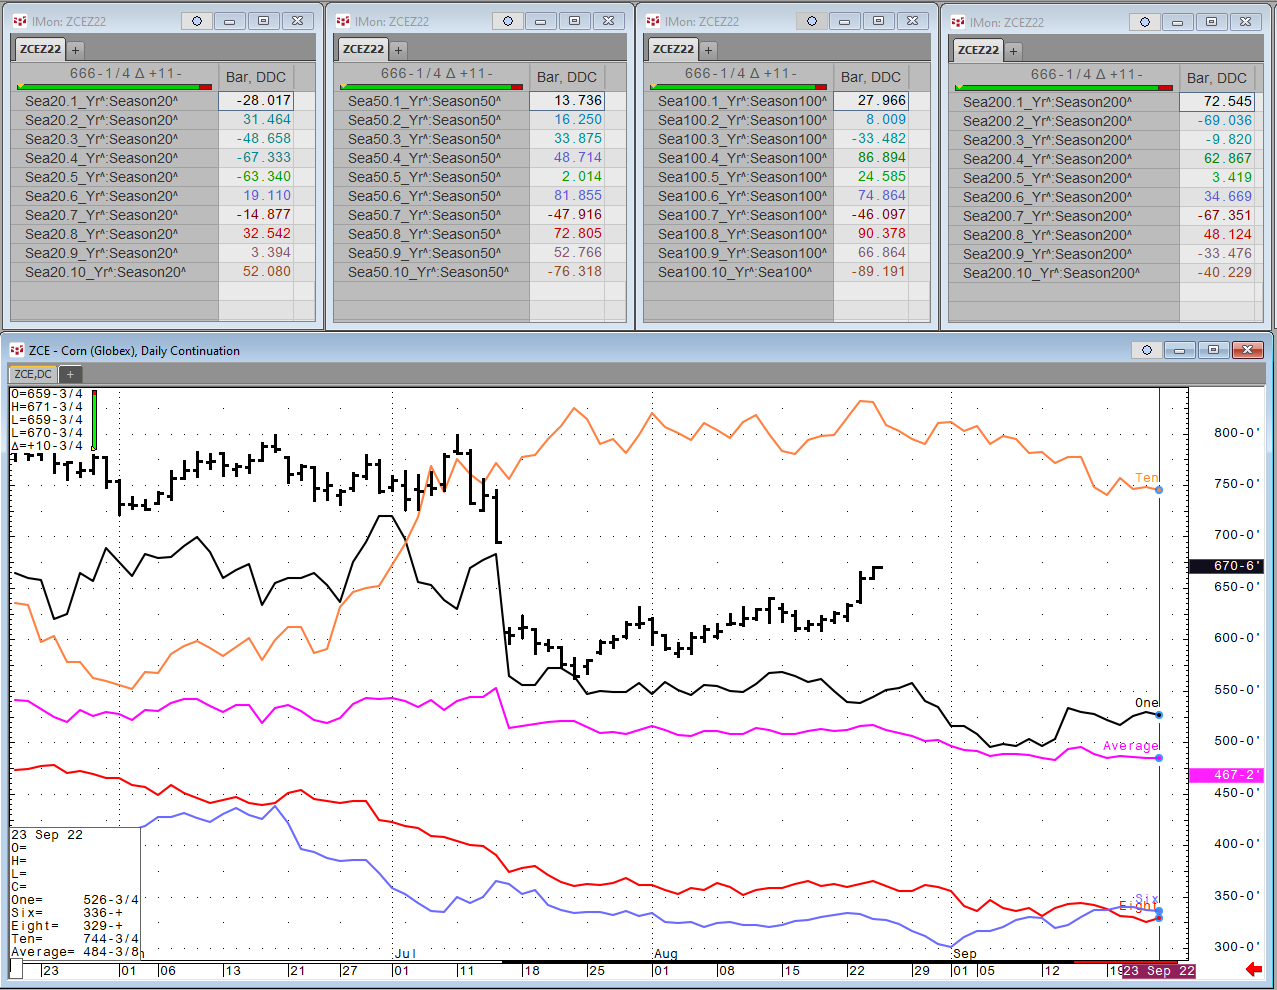
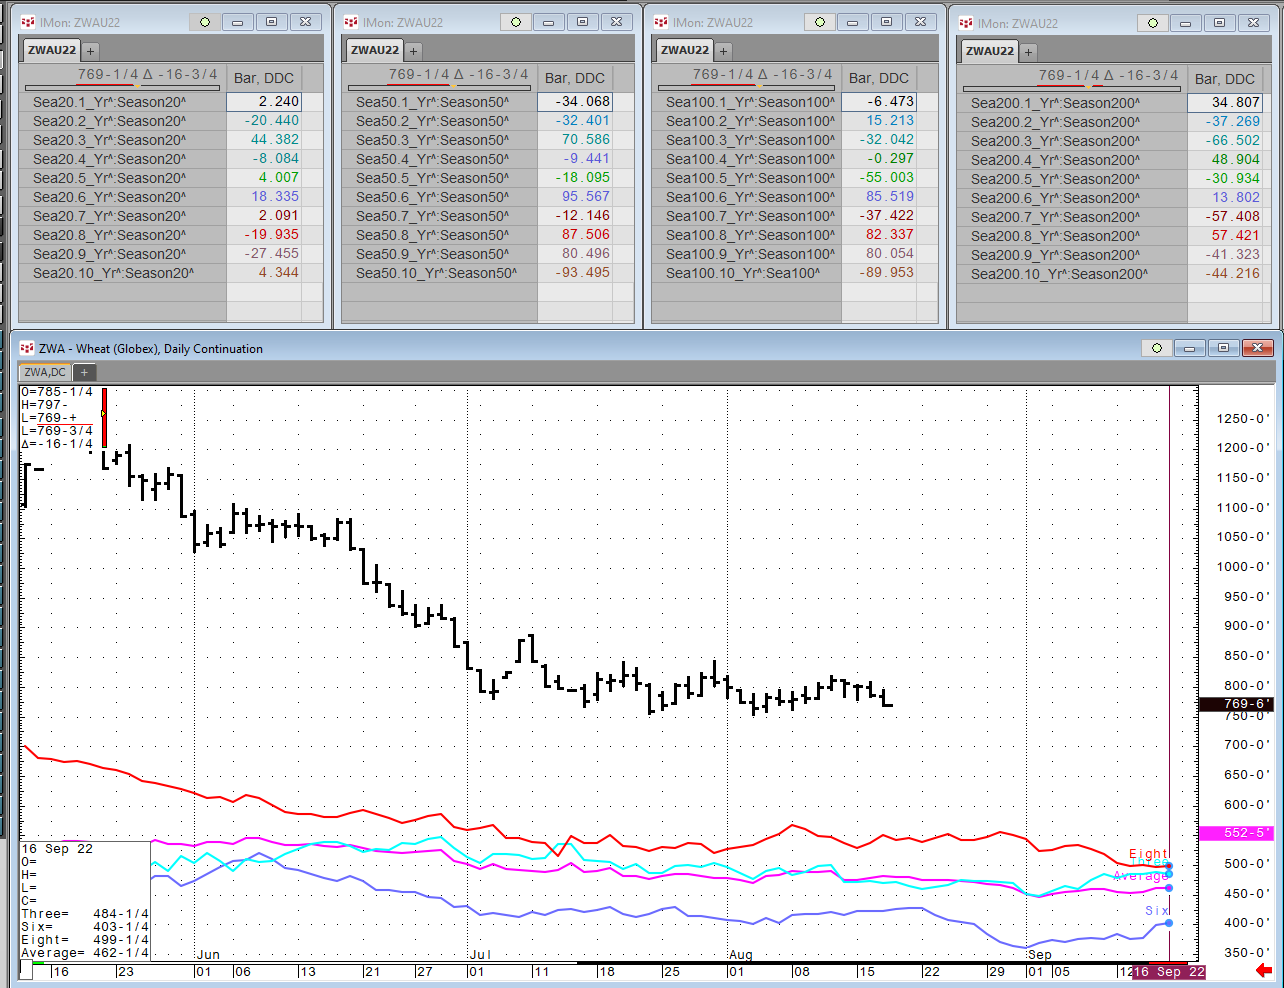
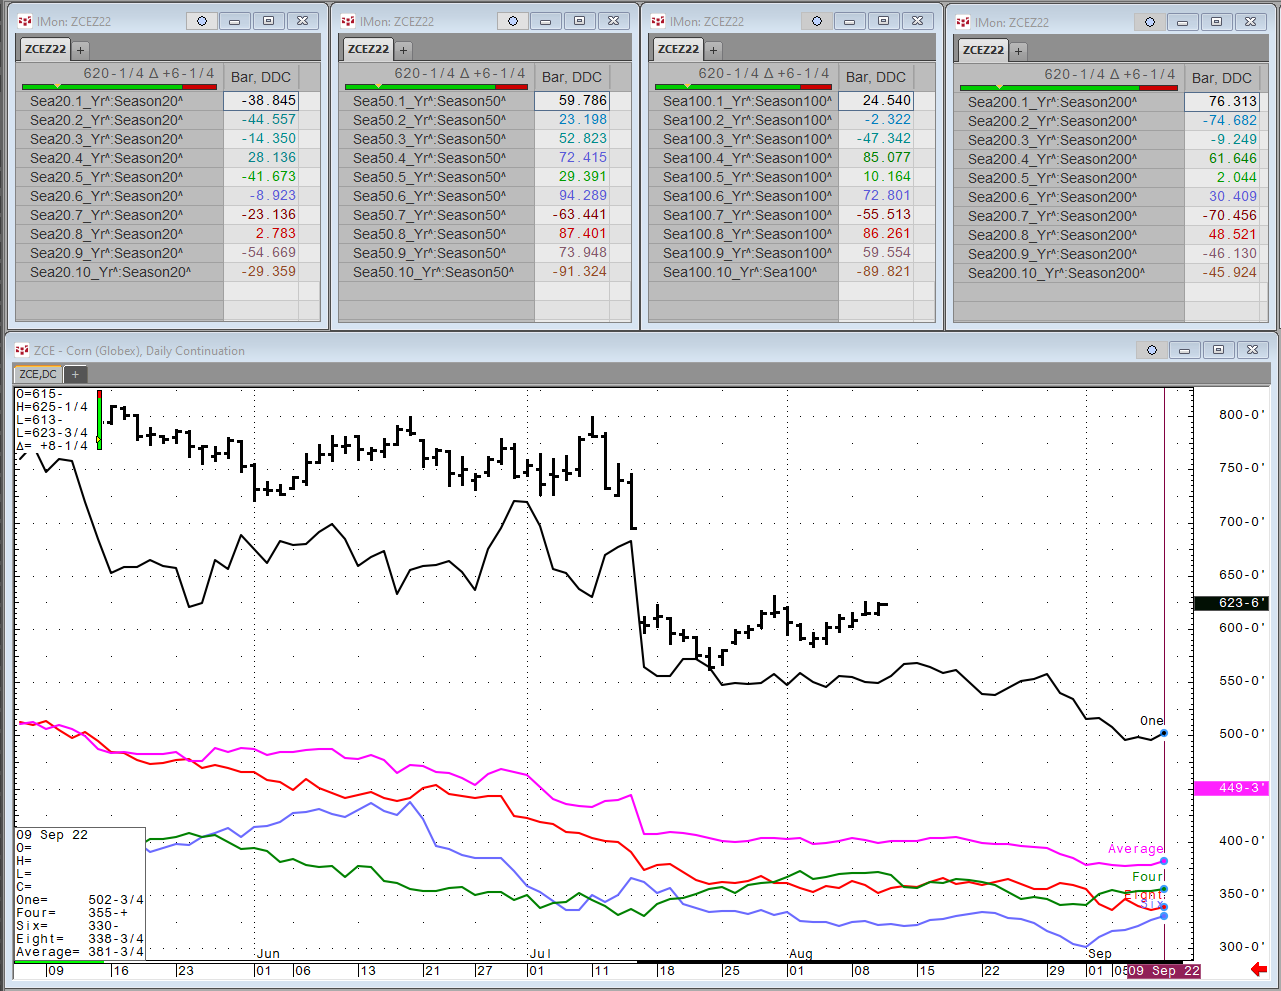
Each Wednesday this article will be updated with the current seasonal study using CQG’s Seasonal analysis applied to the Soybean, Wheat and Corn markets. You can download the CQG pac providing the… more
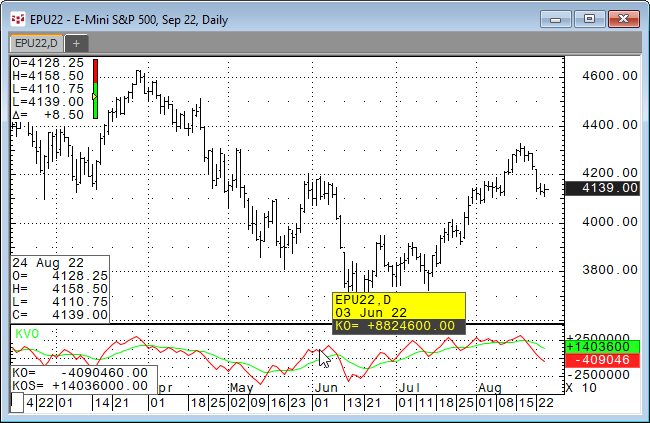
The Klinger Volume Oscillator was developed by Stephen Klinger. The study uses the difference between two exponential smoothed moving averages of the “Volume Force” and includes a signal line.… more
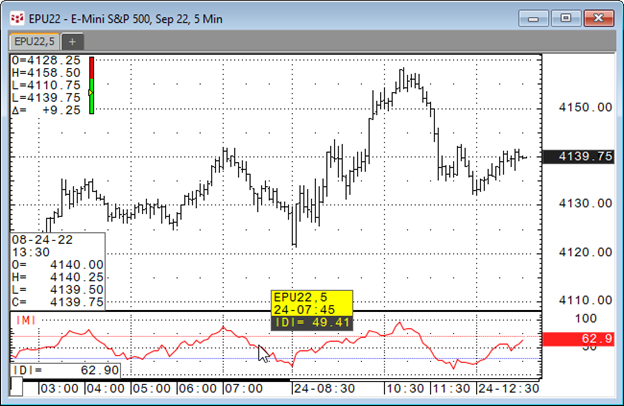
The Intraday Momentum Index was developed by Tushar Chande. This technical indicator combines features of candlestick analysis with calculations similar to the relative strength index (RSI) to… more
Each Wednesday this article will be updated with the current seasonal study using CQG’s Seasonal analysis applied to the Soybean, Wheat and Corn markets. You can download the CQG pac providing the… more

On Friday I sat down with Richard Bonugli at the Financial Repression Authority and Doomberg to discuss the current situation in global energy and tried to peek into the future as to where Europe… more
Each Wednesday this article will be updated with the current seasonal study using CQG’s Seasonal analysis applied to the Soybean, Wheat and Corn markets. You can download the CQG pac providing the… more
General
Various bug fixes and usability improvements
HMS/OTC
Ability to move working HMS order to next delivery
Improved workflow from hedge balance item from order actions
Added "Hedge First… more
Each Wednesday this article will be updated with the current seasonal study using CQG’s Seasonal analysis applied to the Soybean, Wheat and Corn markets. You can download the CQG pac providing the… more
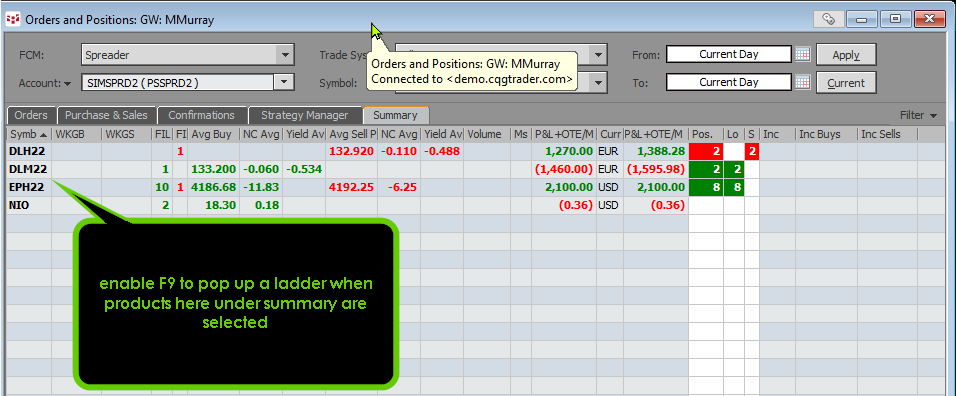
You can launch the default order display from the Orders & Positions Summary tab by double clicking on the symbol or select the symbol and then hit F9.