
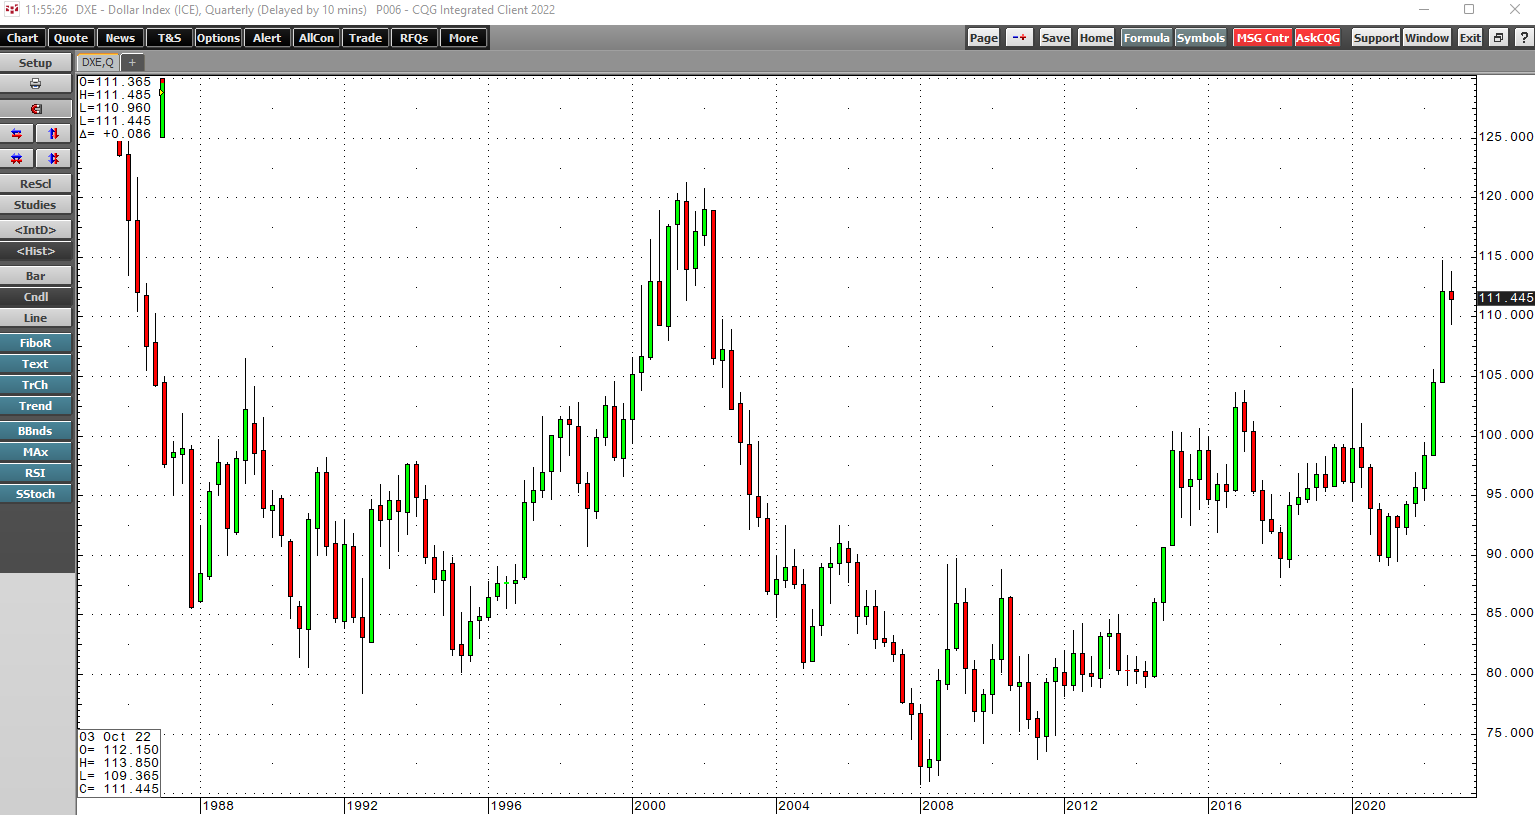
On November 2, the US Fed did precisely what the market had expected and increased the Fed Funds Rate by 75 basis points for the fourth consecutive time. In March 2022, the Fed Funds Rate was at… more
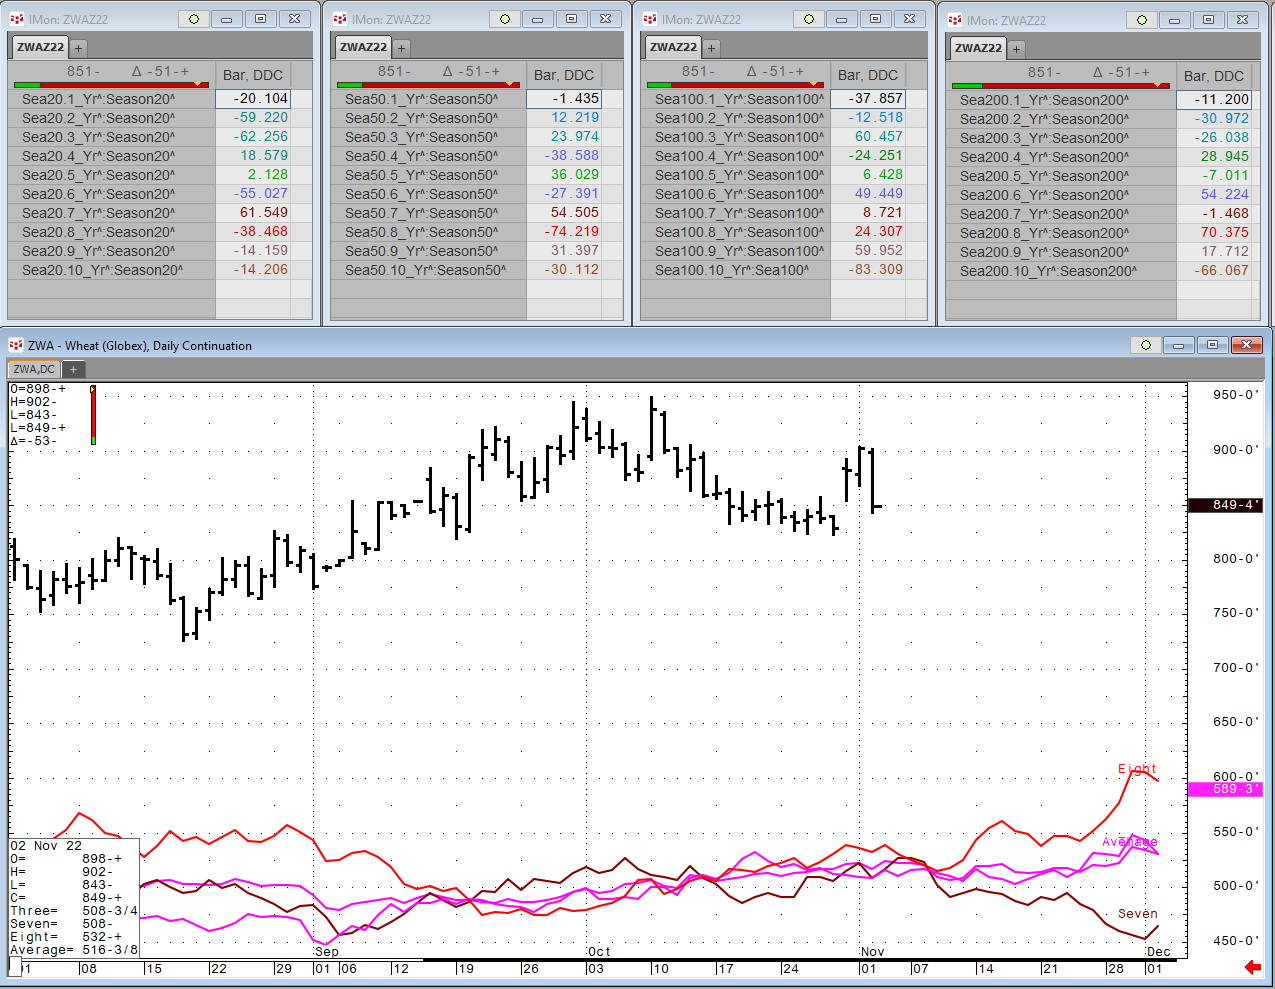
Each Wednesday this article will be updated with the current seasonal study using CQG’s Seasonal analysis applied to the Soybean, Wheat and Corn markets. You can download the CQG pac providing the… more
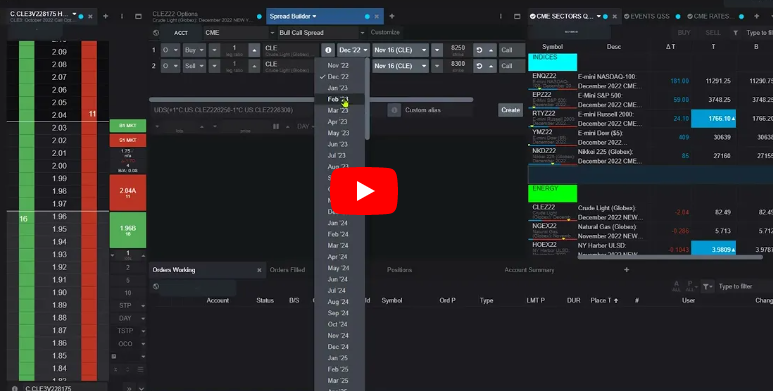
CQG One, the next generation flagship trading and data visualization product for the financial markets now offers the Spread Builder and User Defined Strategies (UDS).
Watch this video to… more
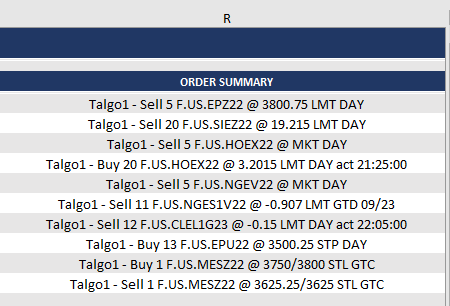
Here, we introduce placing Batch Orders using the CQG XL Toolkit. At the bottom of the post is a downloadable Excel sample. For more details there are two links to the CQG IC/QTrader Help files… more
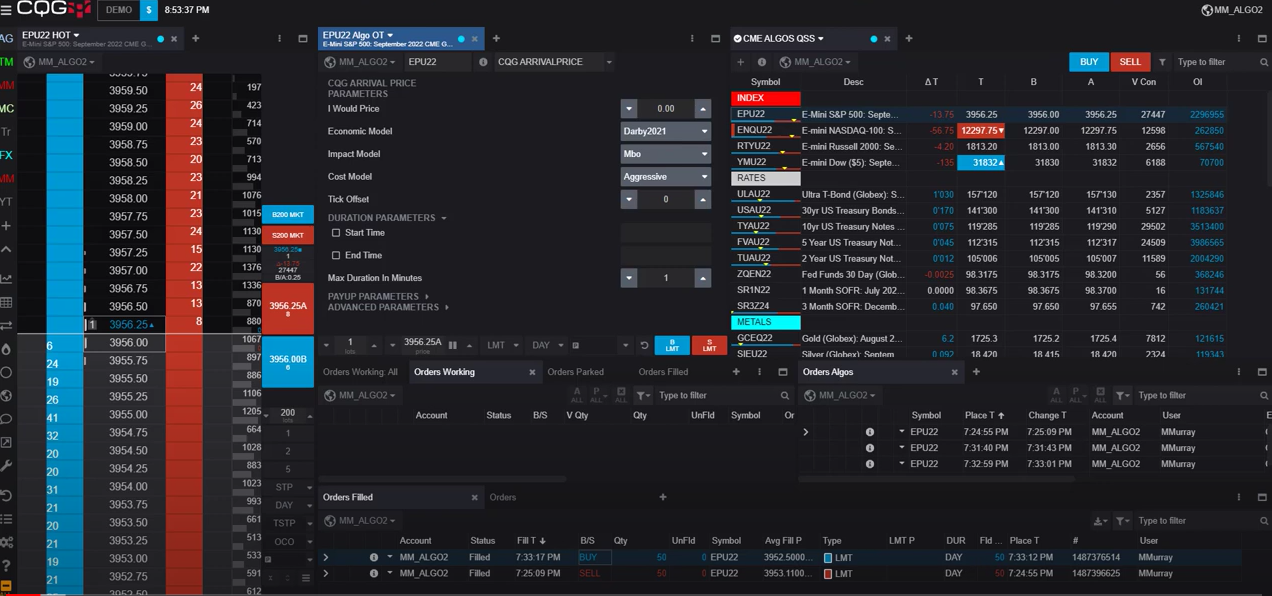
CQG One, the next generation flagship trading and data visualization product for the financial markets now offers access to CQG Algos.
Watch this video to learn about using CQG Algos to… more
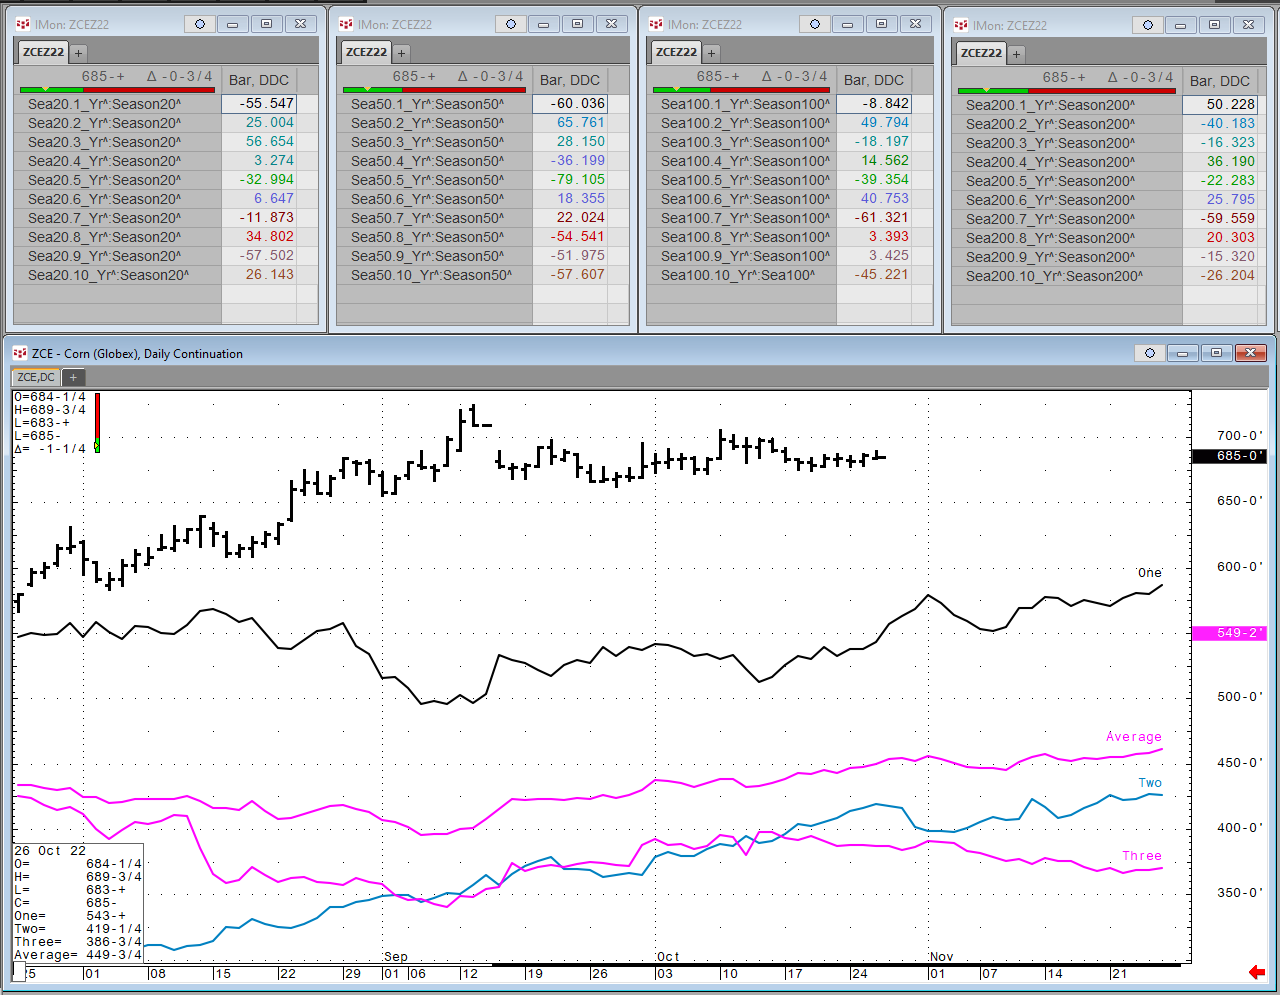
Each Wednesday this article will be updated with the current seasonal study using CQG’s Seasonal analysis applied to the Soybean, Wheat and Corn markets. You can download the CQG pac providing the… more
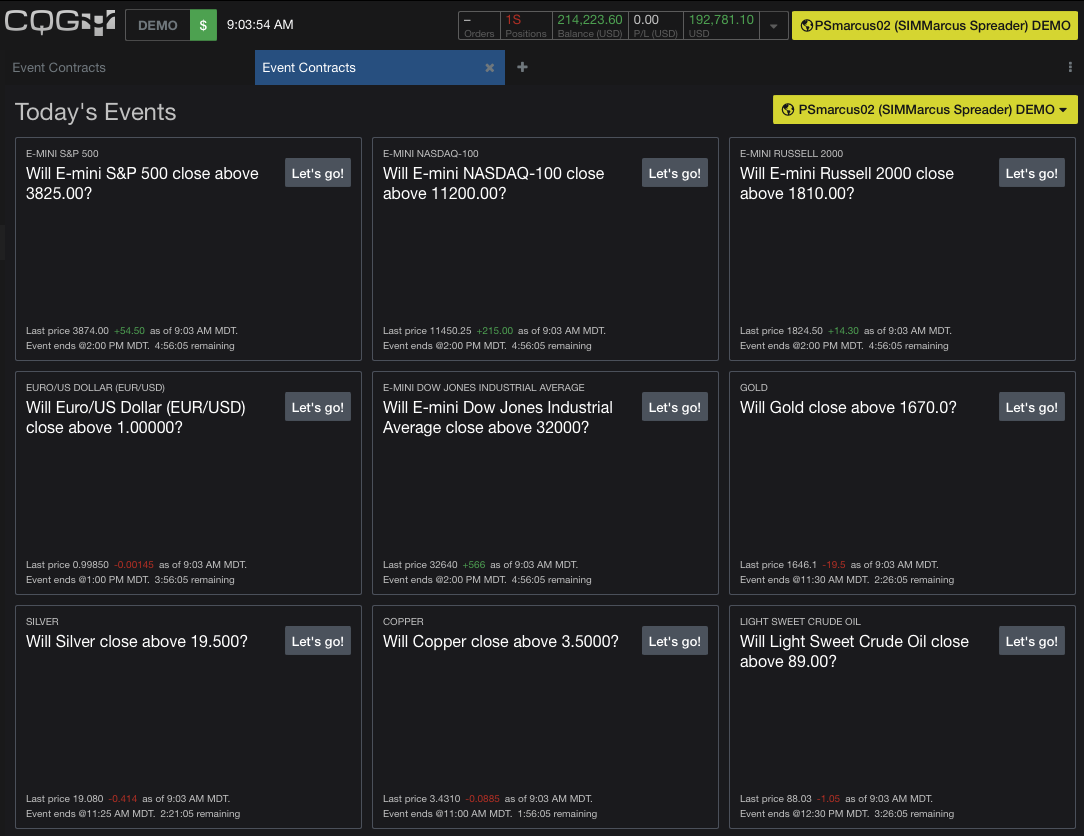
CME Group launches event contracts that enable traders to express their view on whether the price of key futures markets will move up or down by the end of each day's trading session, including… more

There is a great deal of political noise reverberating out of the Chinese political system as President Xi has asserted his Mao-like vice grip over China’s political, social and military reins of… more
With thanks to Financial Repression Authority.
Yra Harris is a highly respected global macro analyst and trader for four decades---knowledgeable in Foreign Exchange,… more
Yra Harris is a highly respected global macro analyst and trader for four decades---knowledgeable in Foreign Exchange, Global Bonds, Commodities and Equities. His work is subscribed to by… more