

It is with deep sadness that we mourn the passing of Thomas R Finlon, Jr, 64 years of age, in Houston Texas. We wish to express our condolences to his wife of 39 years,… more
General
Improvements on re-log on when widgets and pages are set to out of page
Event contracts widget improvements
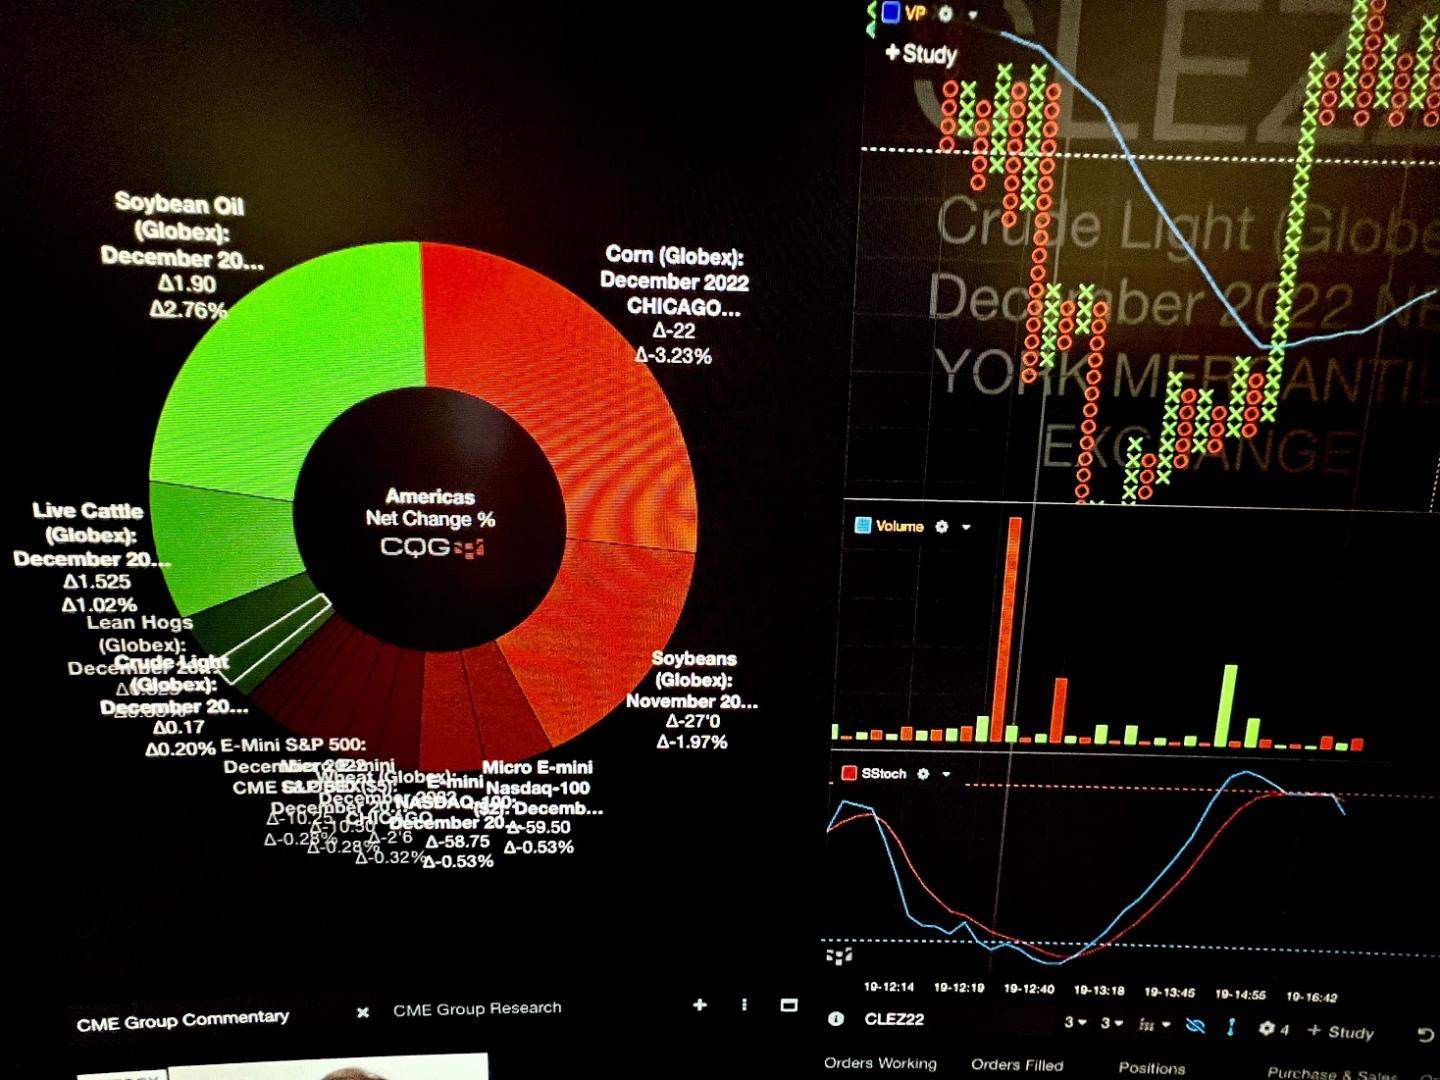
Donut style quoteboard improvements
HMS/OTC
Publish Bids… more
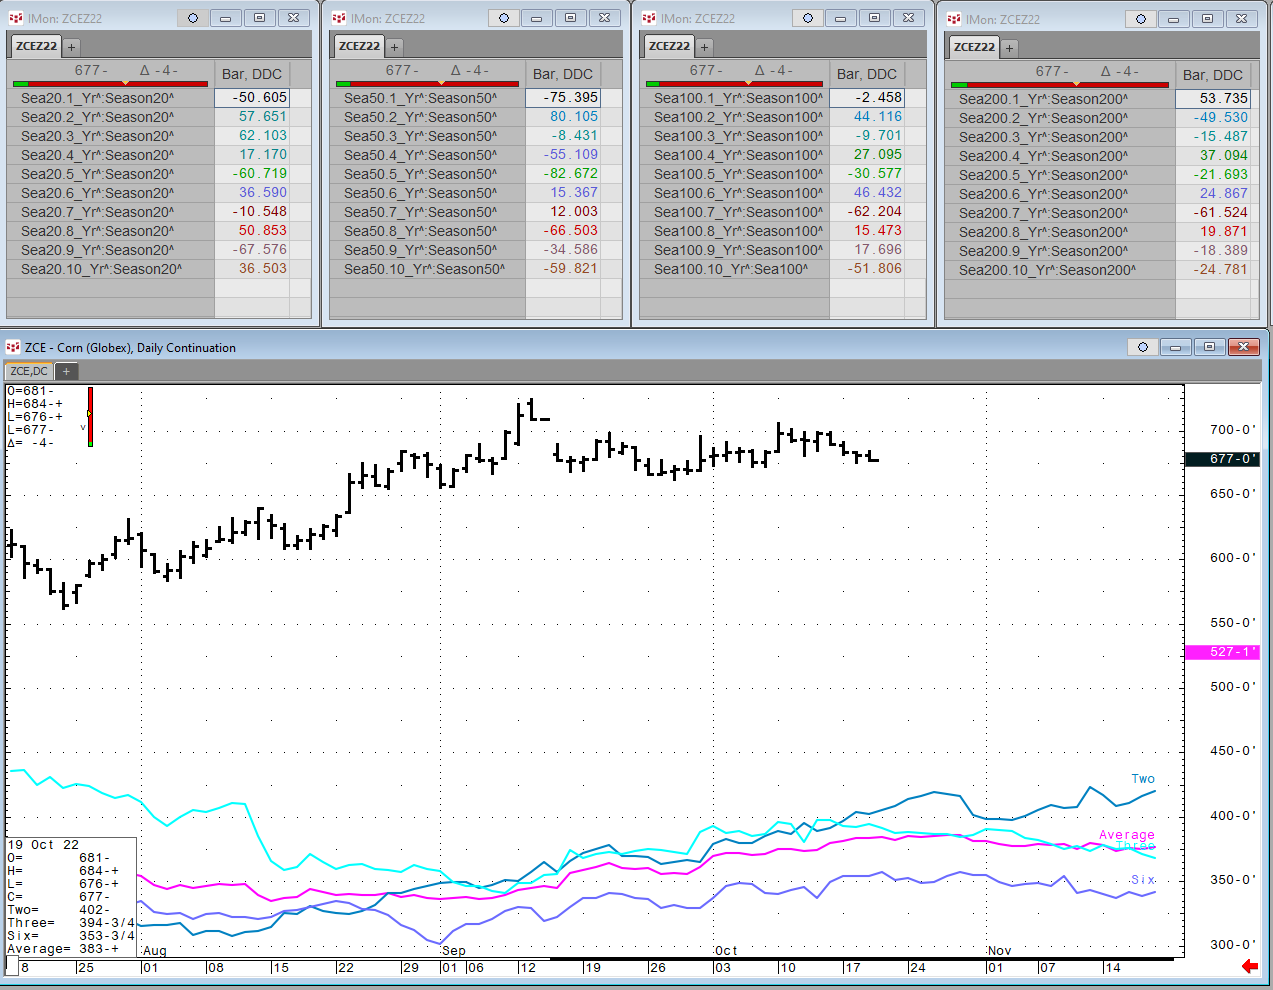
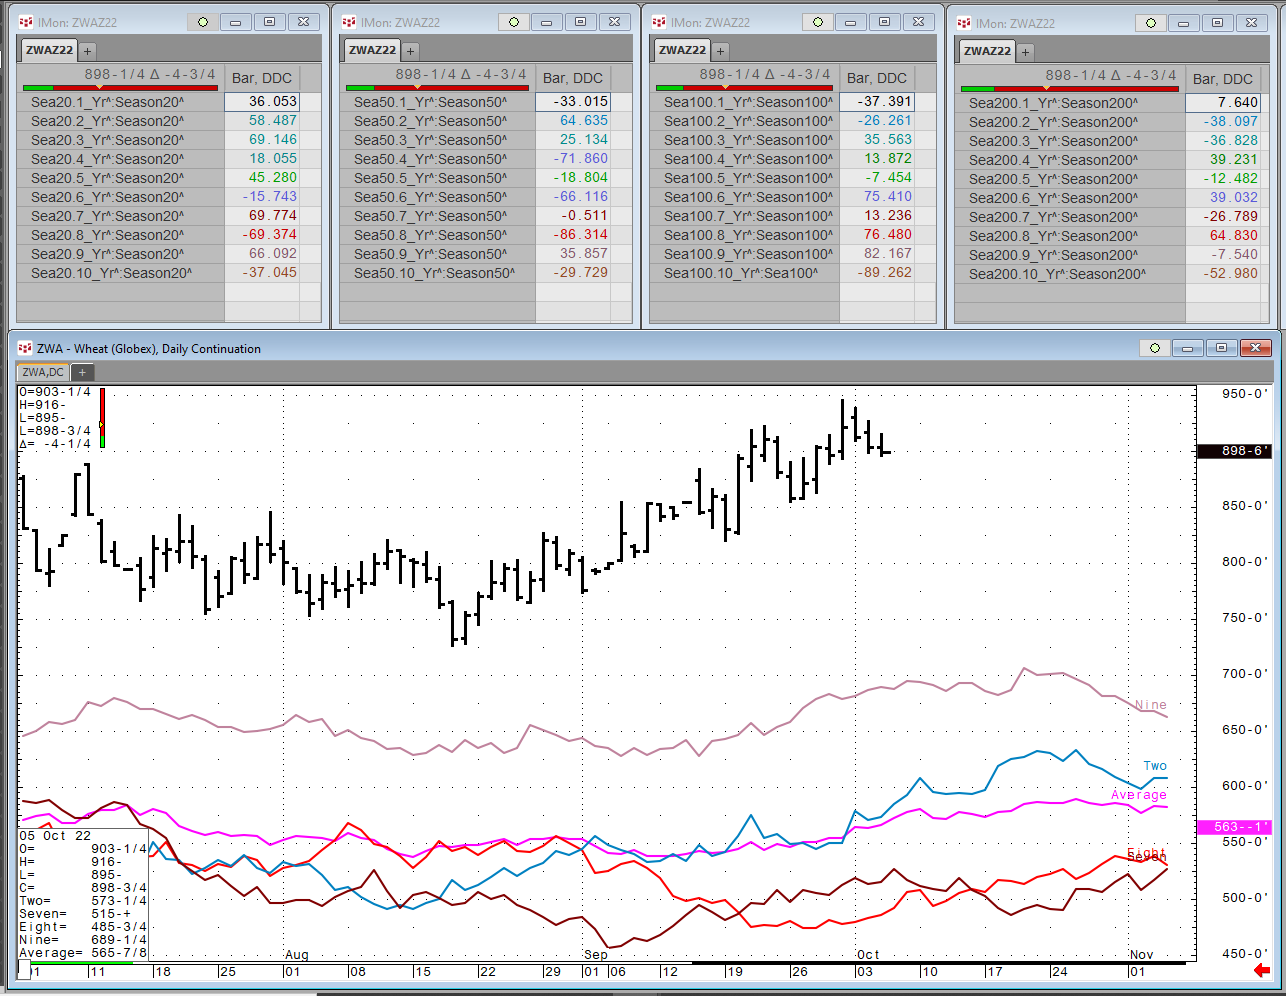
Each Wednesday this article will be updated with the current seasonal study using CQG’s Seasonal analysis applied to the Soybean, Wheat and Corn markets. You can download the CQG pac providing the… more
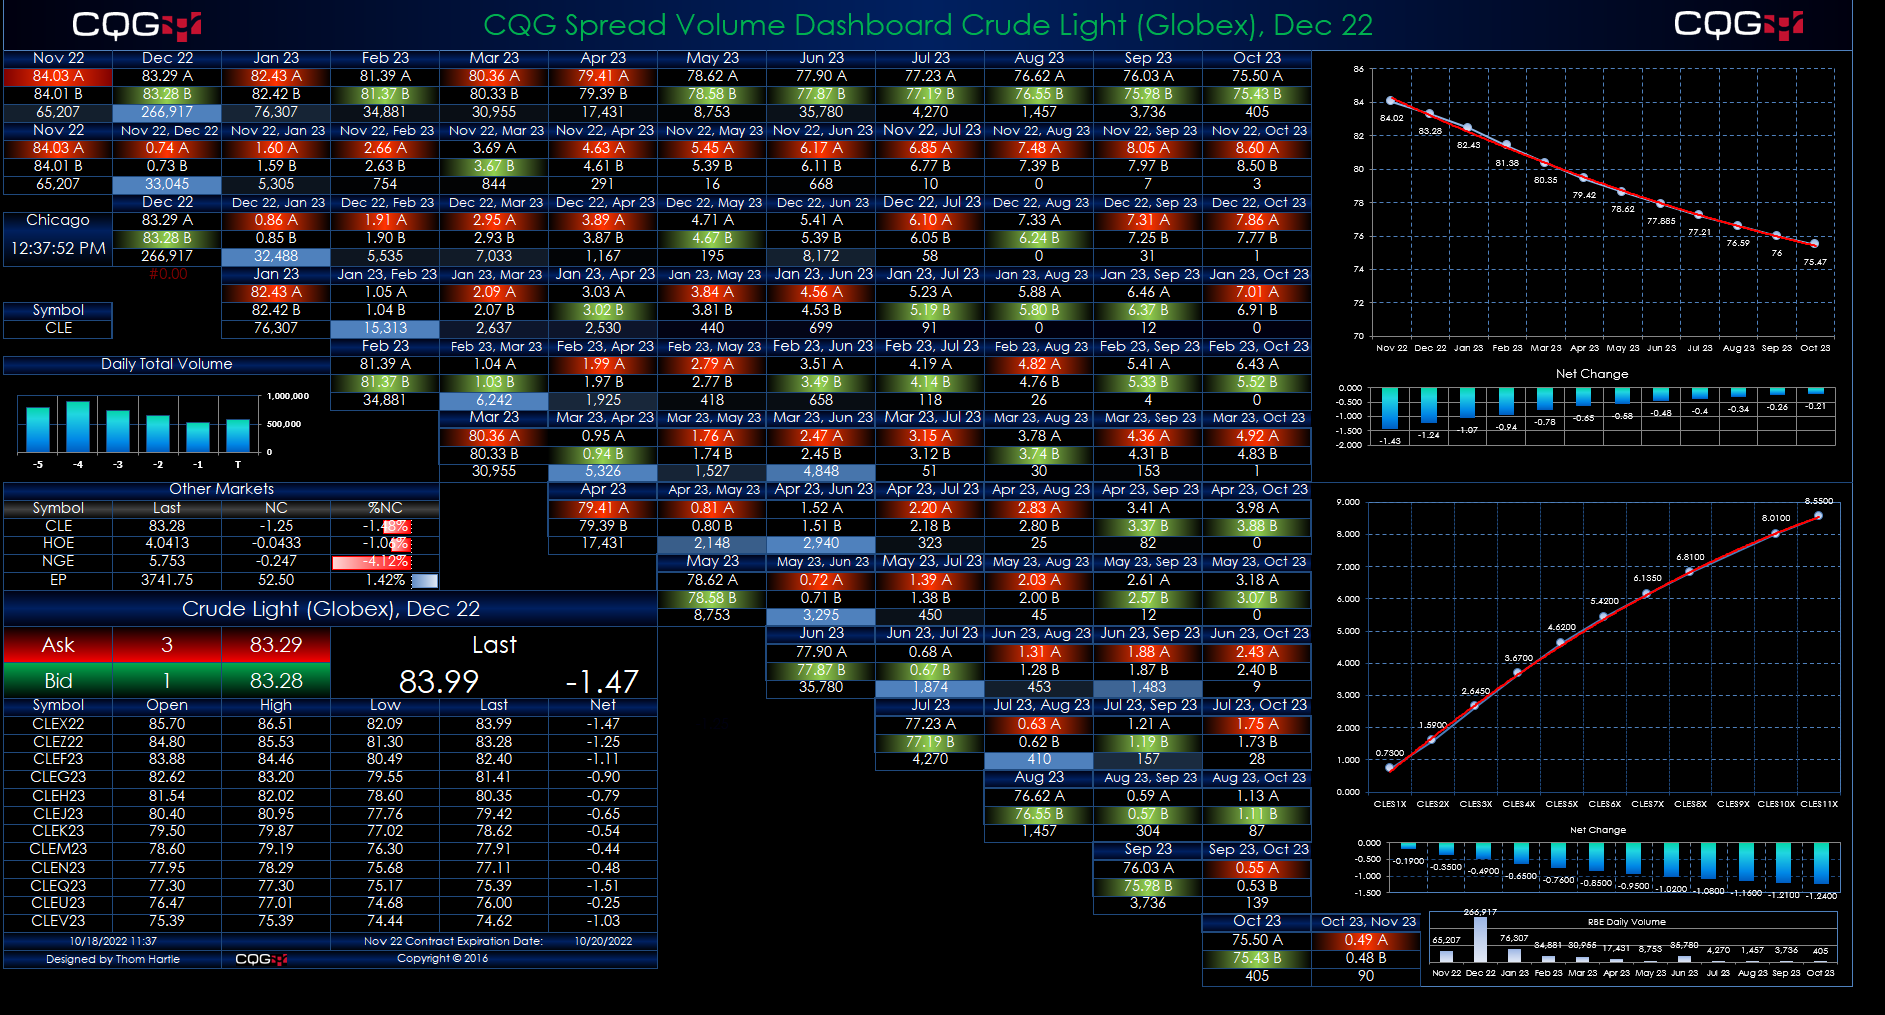
This Microsoft Excel® dashboard displays exchange traded spread market data for a user input symbol. The Excel dashboard uses the CQG RTD Toolkit Add-in, which is installed with CQG IC or CQG… more
Each Wednesday this article will be updated with the current seasonal study using CQG’s Seasonal analysis applied to the Soybean, Wheat and Corn markets. You can download the CQG pac providing the… more
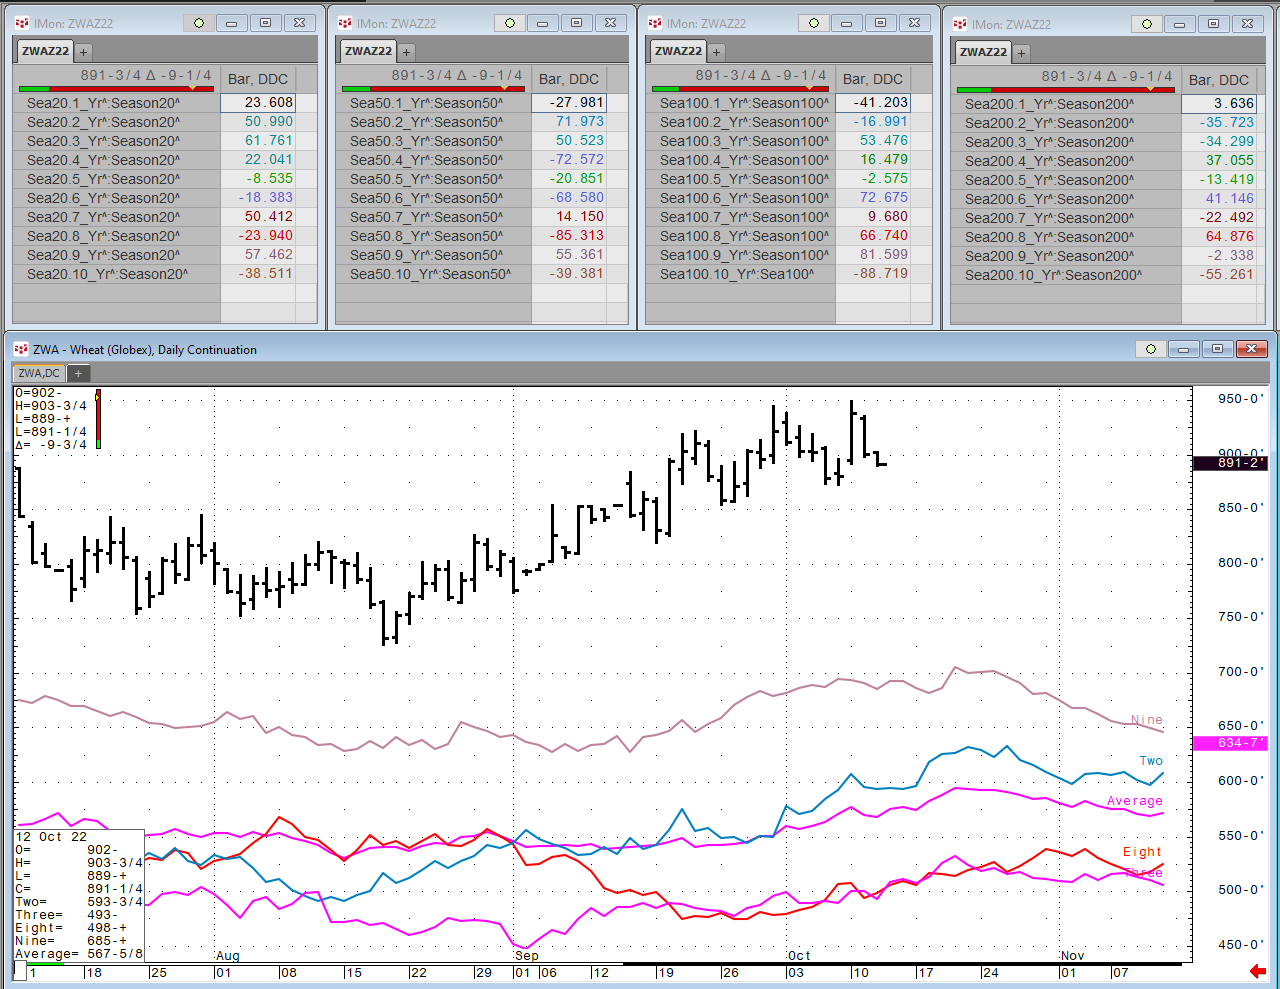
Each Wednesday this article will be updated with the current seasonal study using CQG’s Seasonal analysis applied to the Soybean, Wheat and Corn markets. You can download the CQG pac providing the… more
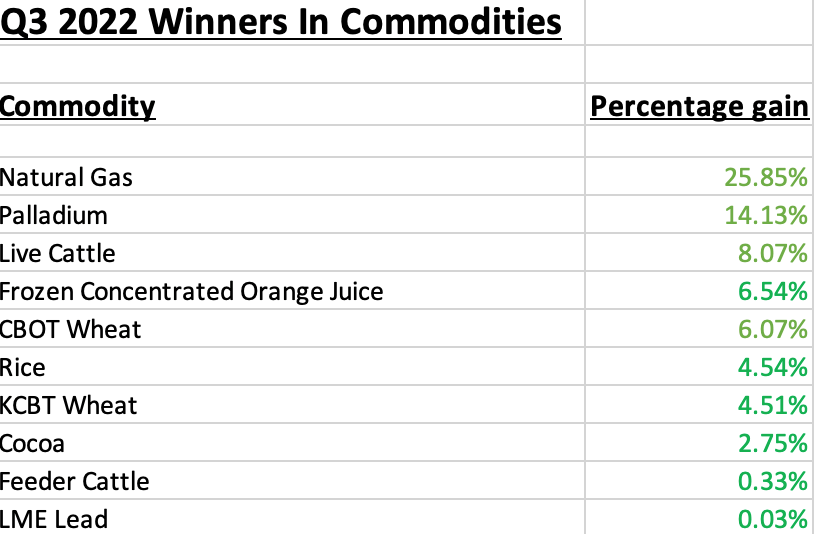
The commodity markets moved lower in Q3 but were still marginally higher than the level at the end of 2021. The commodity asset class consisting of 29 primary commodities that trade on US and UK… more
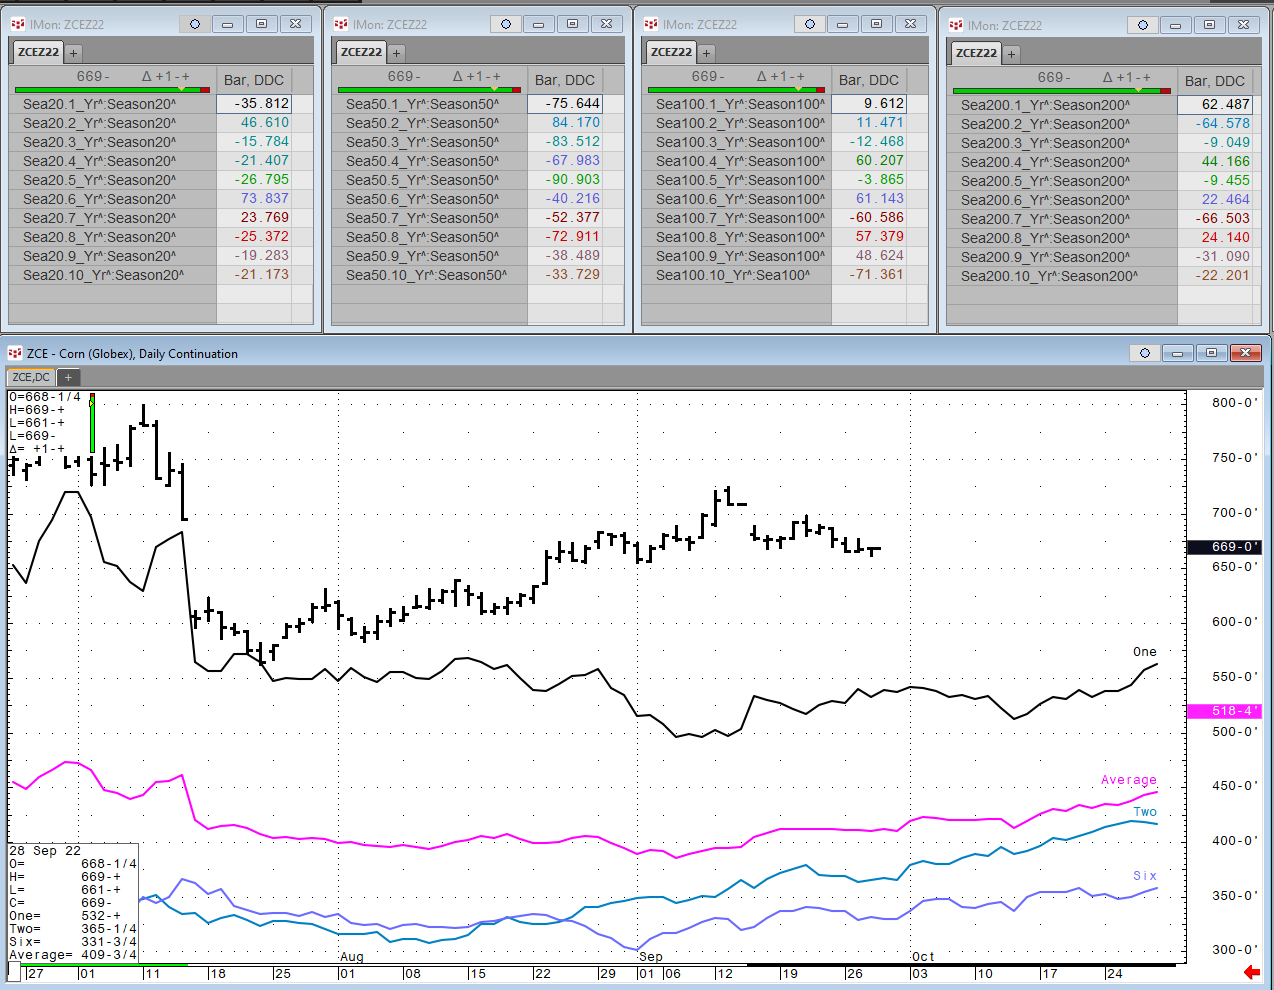
Each Wednesday this article will be updated with the current seasonal study using CQG’s Seasonal analysis applied to the Soybean, Wheat and Corn markets. You can download the CQG pac providing the… more
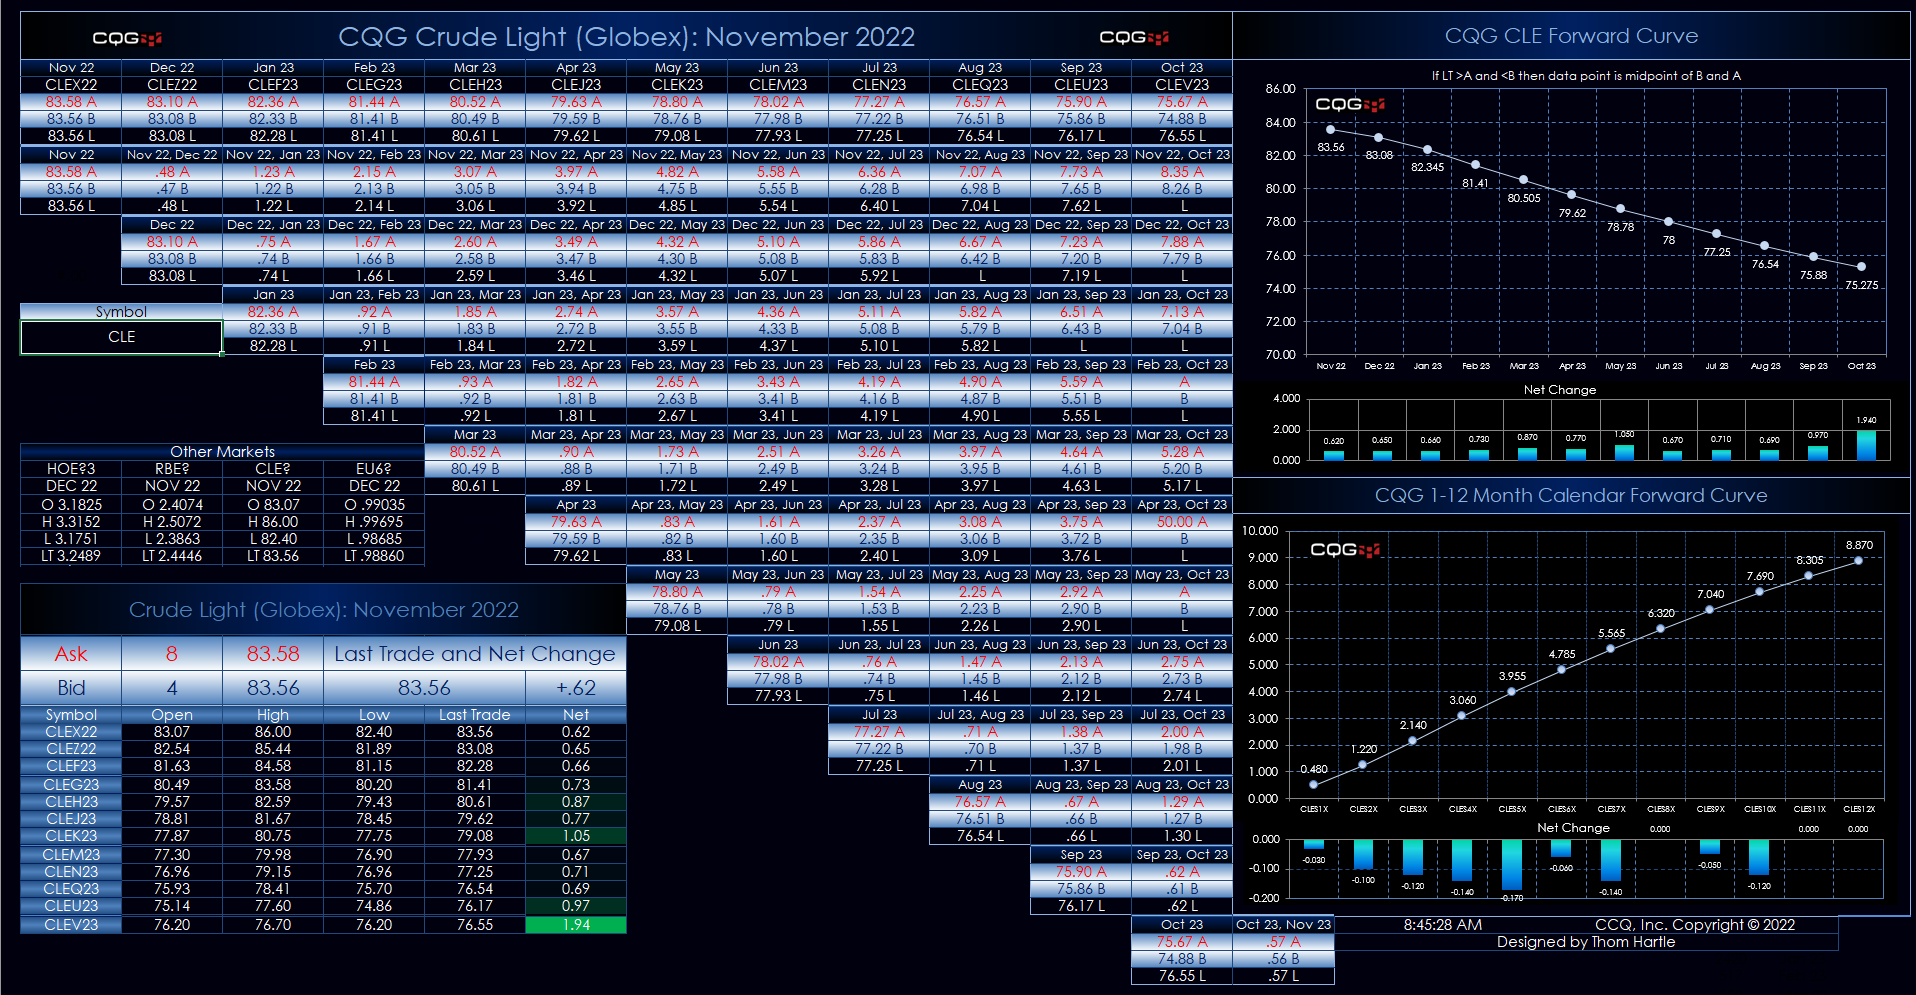
This Microsoft Excel® spreadsheet uses the CQG XL Toolkit to pull in market data based on the symbol entered by the user. The XL Toolkit requires the customer’s FCM enable it. The data is pulled… more

A quick view on Wednesday’s FEDERAL RESERVE‘s meeting: According to the newest Fed stenographer, Nick Timiraos, look for the central bank to raise rates 75 basis points in an effort to get ahead… more