This recent post "Quote Spreadsheet 2.0 TTM Squeeze and More" provided a page installed via a CQG PAC that included a CQG QSS V2 for monitoring the markets. The benefit of the Quote Spreadsheet 2.0 is a collection of markets, and the status of conditions and study values can be observed in a single view. This post presents the steps to building an Excel dashboard version of the same CQG QSS V2 view.
This post draws details from these two posts:
Below is the full view of the dashboard.
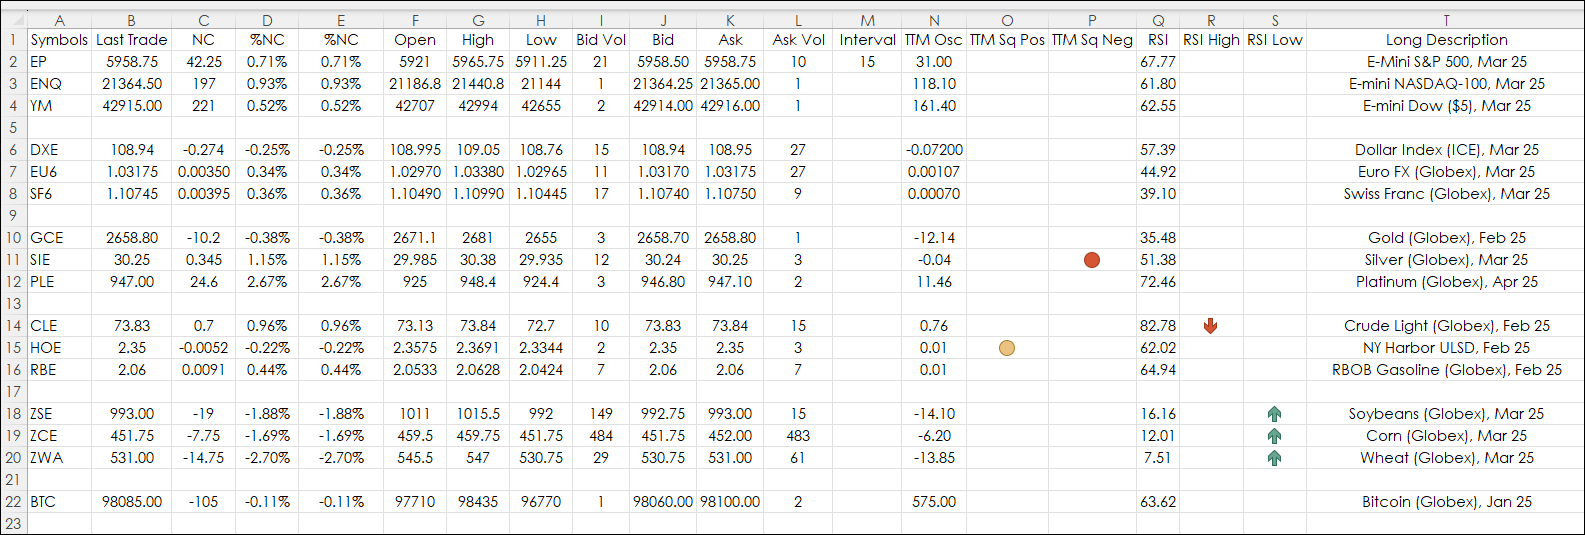
The dashboard is divided into two sections. The left-hand section is today's market data.
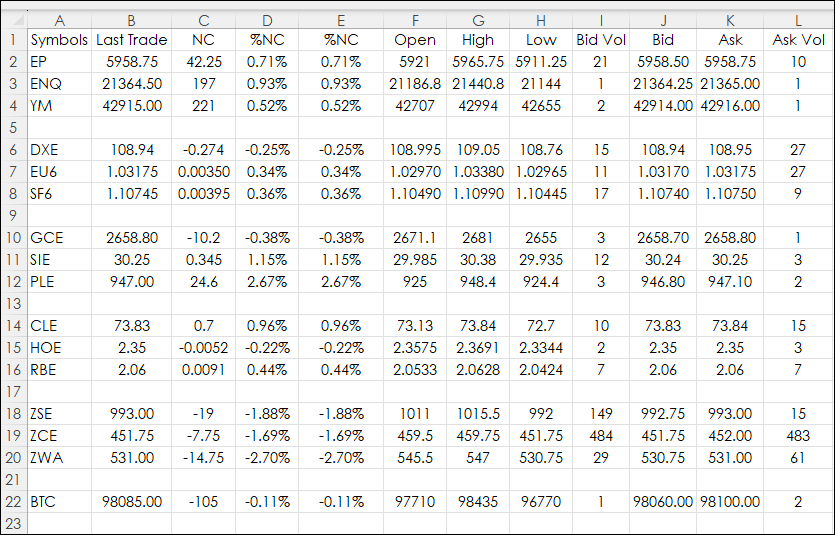
The first column in the table below shows the names of the columns in the Excel sheet displayed above. And, next are the RTD formulas used. Once entered into row 2 the RTD formulas are copied down.
| Symbols | EP |
| Last Trade: | =RTD("cqg.rtd", ,"ContractData",A2, "LastTrade",, "T") |
| NC: | =RTD("cqg.rtd", ,"ContractData", A2, "NetLastTradeToday",, "T") |
| %NC: | =RTD("cqg.rtd", ,"ContractData", A2, "PerCentNetLastTrade",, "T")/100 |
| %NC: | =RTD("cqg.rtd", ,"ContractData", A2, "PerCentNetLastTrade",, "T")/100 |
| Open: | =RTD("cqg.rtd", ,"ContractData", A2, "Open",, "T") |
| High: | =RTD("cqg.rtd", ,"ContractData", A2, "High",, "T") |
| Low: | =RTD("cqg.rtd", ,"ContractData", A2, "Low",, "T") |
| Bid Vol: | =RTD("cqg.rtd", ,"ContractData", A2, "MT_LastBidVolume",, "T") |
| Bid: | =RTD("cqg.rtd", ,"ContractData", A2, "Bid",, "T") |
| Ask: | =RTD("cqg.rtd", ,"ContractData", A2, "Ask",, "T") |
| Ask Vol: | =RTD("cqg.rtd", ,"ContractData", A2, "MT_LastAskVolume",, "T") |
The right-hand side of the dashboard displays the values for two studies (TTM Oscillator and the Relative Strength Index) and the status of four conditions. The TTM Oscillator and the two conditions are referred to as the Squeeze, which is explained in this post: TTM Squeeze Indicator.
The four conditions:
- TTM Sq Pos: The Bollinger Bands are within the Keltner Channels and the TTM Oscillator is positive.
- TTM Sq Neg: The Bollinger Bands are within the Keltner Channels and the TTM Oscillator is negative.
- RSI High: The 9-period RSI is above 80.
- RSI Low: The 9-period RSI is below 20.
Conditions are either true or false. When true, an icon is displayed.
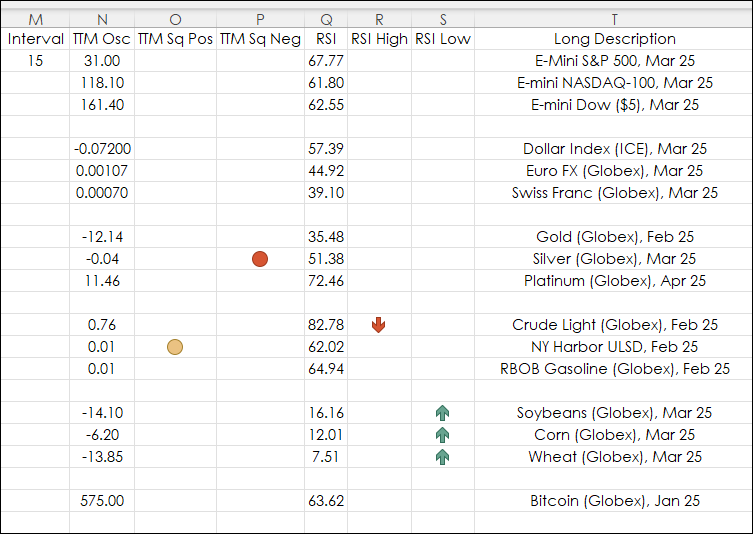
Column N above is the TTM Oscillator values using the symbols in column A. The TTM Oscillator is the 15-period difference between the closing prices smoothed by a 5 period moving linear regression.
The TTM Oscillator RTD formula requires a custom RTD Study formula. First, a typical RTD Study formula has the symbol as the first parameter:
=RTD("cqg.rtd",,"StudyData","EP", "Bar",, "Close","D","0","All", "", "","True","T")The RTD formula permits calling a study by replacing the symbol with the study and symbol.
To find the appropriate syntax open the Formula Builder and find the custom study.
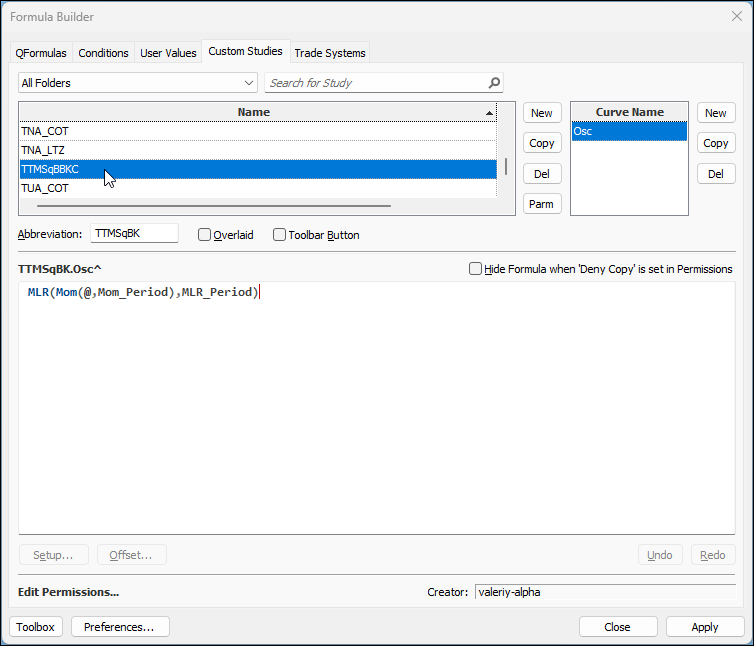
Next, left click on the name of the study displayed right above the Formula Editor, which includes the name of the curve (here it is TTMSqBK.OSC^") and select "Copy to Clipboard."
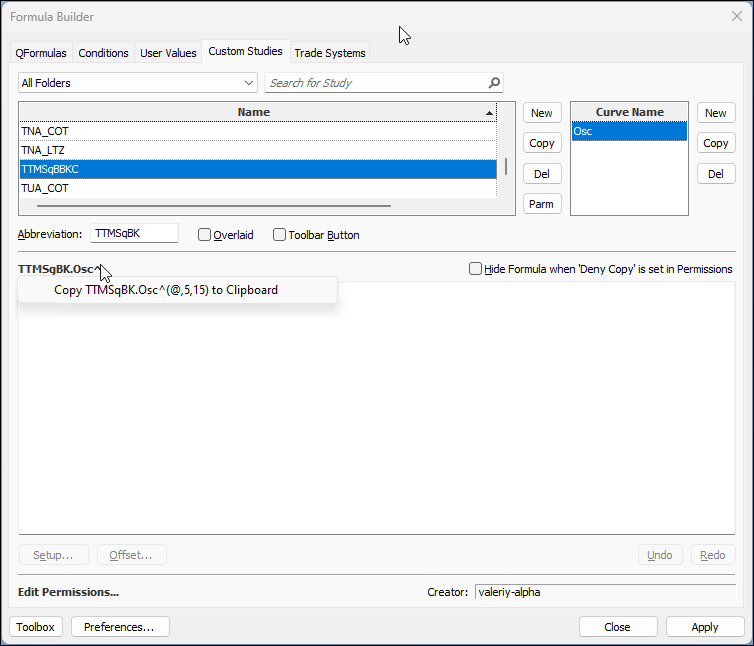
This "TTMSqBK.Osc^(@,5,15)" is on the Clipboard. This can replace the symbol in the RTD formula:
=RTD("cqg.rtd",,"StudyData", "TTMSqBK.Osc^("&A2&",5,15)", "Bar",, "Close",M2,"0","All", "", "","True","T")The @ is replaced with "&A2&" which is the cell reference for the symbol. And 5 is the MLR parameter and 15 is the Momentum parameter.
For a more detailed list of the custom study parameters, right-click the Name of the custom study and select "Send to Clipboard."
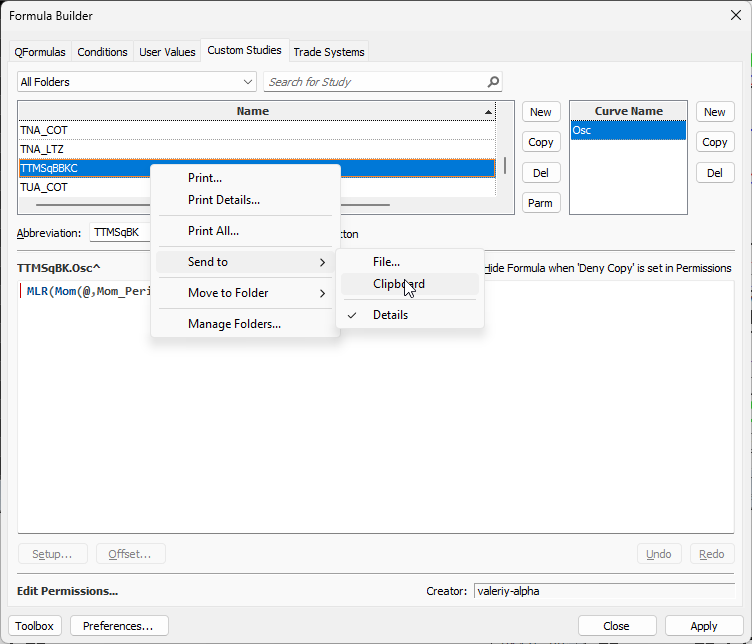
This is the information on the clipboard and can be pasted into Excel:
Current Time 01/03/25 13:45

TTMSqBBKC: -- Overlaid = FALSE

  Parameters:

    MLR_Period = 5

    Mom_Period = 15

  Curve 'Osc (Display String)

MLR(Mom(@,Mom_Period),MLR_Period)

  Curve 'Osc (Study String)

MLR(Mom(@,Period:=Mom_Period,InputChoice:=Close),Period:=MLR_Period,InputChoice:=Close)
The last line above can be used in the Symbol parameter in the RTD formula. This is the RTD formula used in Column N:
= RTD("cqg.rtd",,"StudyData", "MLR(Mom("&$A2&",Period:=15,InputChoice:=Close),Period:=5,InputChoice:=Close)", "Bar",, "Close",M2,"0","All", "", "","True","T")The "M2" in the RTD formula above is the cell reference for the Time Interval.
This same process is used to create the custom RTD formulas for the conditions from the Conditions tab on the Formula Builder.
Column O (TTM Sq Pos):
=RTD("cqg.rtd",,"StudyData","B.TTMSqueeze_BK_Pos_Osc("&$A2&",20,2,20,150,5,15)", "Bar",, "Close",M2,"0","All", "", "","True","T")Column P (TTM Sq Neg):
= RTD("cqg.rtd",,"StudyData", "B.TTMSqueeze_BK_Neg_Osc("&$A2&",20,2,20,150,5,15)", "Bar",, "Close",M2,"0","All", "", "","True","T")Column R (RSI Study):
= RTD("cqg.rtd",,"StudyData", "RSI("&A2&",Period:=9,InputChoice:=Close)", "Bar",, "Close",M2,"0","All", "", "","True","T")Column S (RSI High):
= RTD("cqg.rtd",,"StudyData", "B.cqg.RSIHigh("&A2&",9,80)", "Bar",, "Close",M2,"0","All", "", "","True","T")Column T (RSI Low):
= RTD("cqg.rtd",,"StudyData", "B.cqg.RSILow("&A2&",9,20)", "Bar",, "Close",M2,"0","All", "", "","True","T")All RTD formulas are referencing cell M2 for the time interval.
To display an Icon when the condition is True, select the cells in the column and then Home/Conditional Formatting/New Rule. Then select "Format all cells based on their values" and select "Icon Sets" from the dropdown list for the "Format Style."
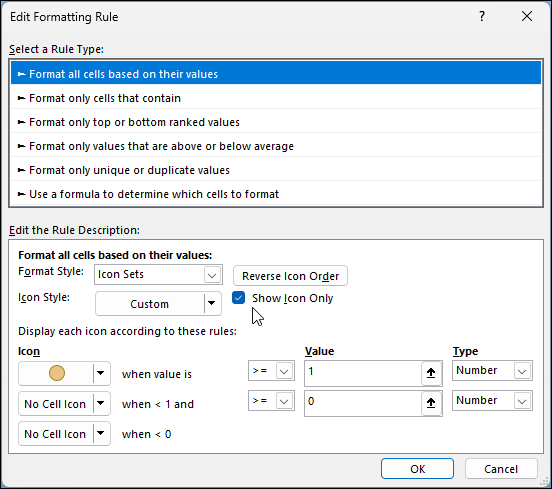
Set up the rule the same as the image above. Repeat this for the other three conditions.
The result is the image below.
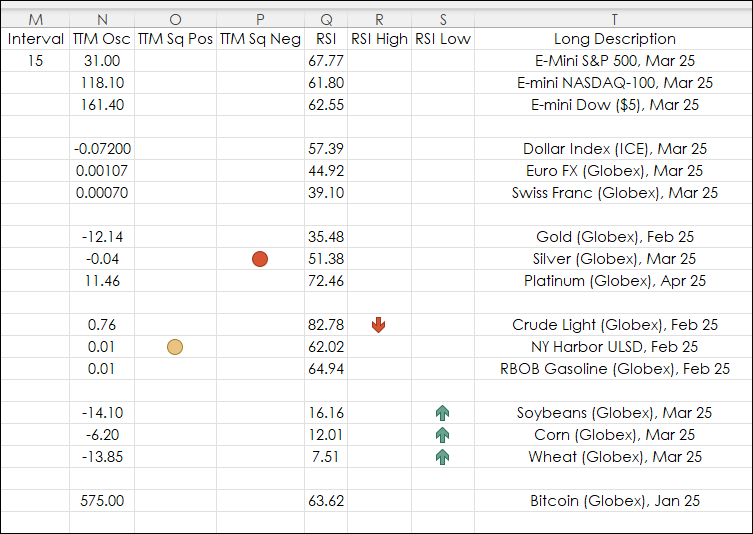
This post walked through the steps to creating an Excel Dashboard for monitoring markets, studies and conditions. Symbols can be changed, as well as other studies and conditions can be added.
To use the sample spreadsheet the CQG PAC has to be installed to access the custom study and conditions.
Requirements: CQG Integrated Client or QTrader, and Excel 2016 (locally installed, not in the Cloud) or more recent.