This Microsoft Excel® dashboard scans the options on futures for the H-shares Index (HHI) and ranks the traded volume for each expiry out to nine expirations. The scan covers options traded… more
Excel/RTD

This Microsoft Excel® spreadsheet tracks the constituents of the DJIA Index (symbol: DJIA).
Throughout the trading session, the thirty individual stocks are dynamically ranked and displayed… more

This Microsoft Excel® dashboard scans the Hang Seng Index market options on futures and ranks the traded volume for each expiry out to eleven expirations. The scan covers options traded ten… more
In this article, we outline how to pull historical market data into Excel while excluding data from days when the market was in a holiday session.
Holiday sessions are trading dates, but… more
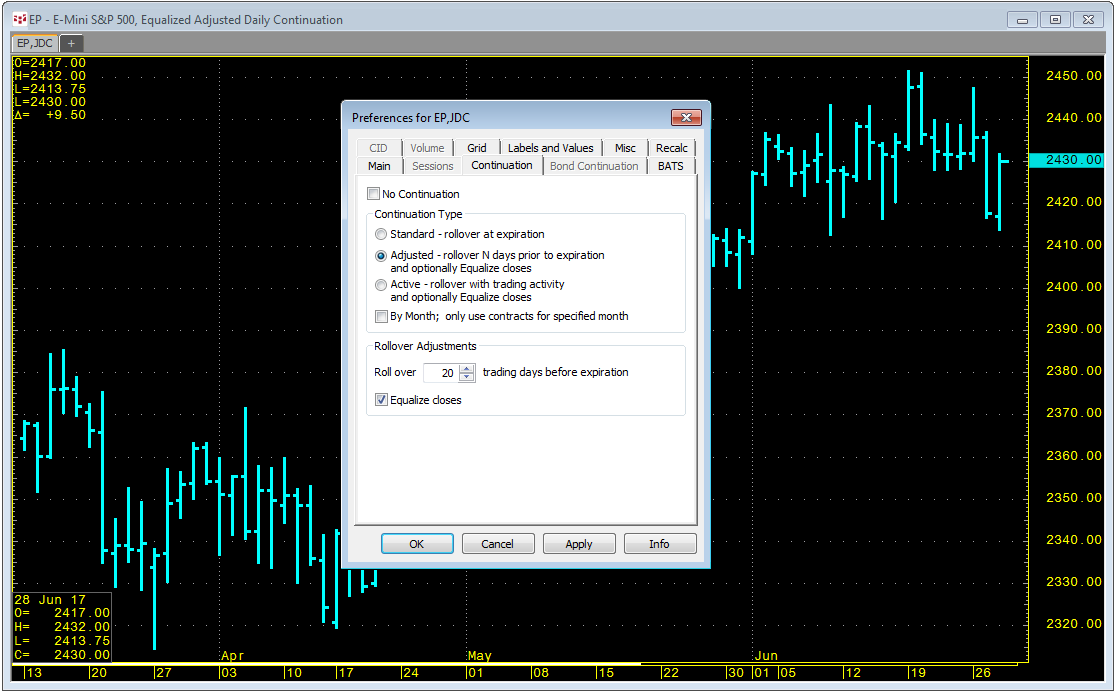
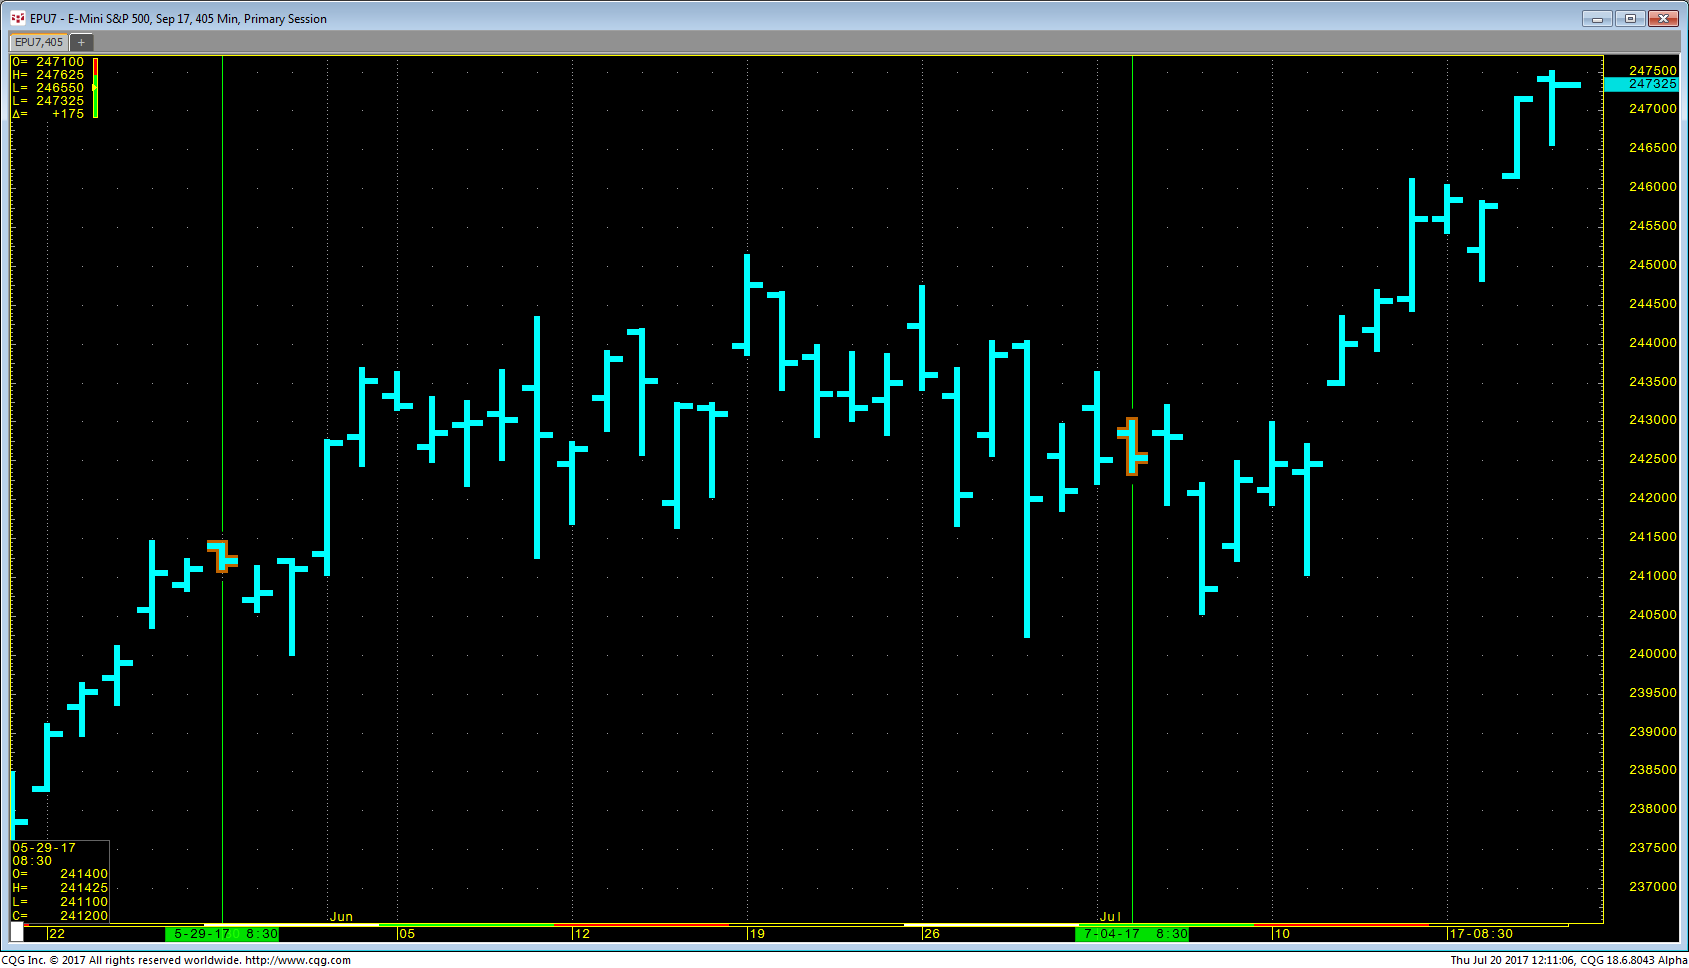
RTD formulas for chart types and studies can include the same parameter settings used in your CQG continuation charts. In the RTD formula the continuation parameters are entered in the “time… more
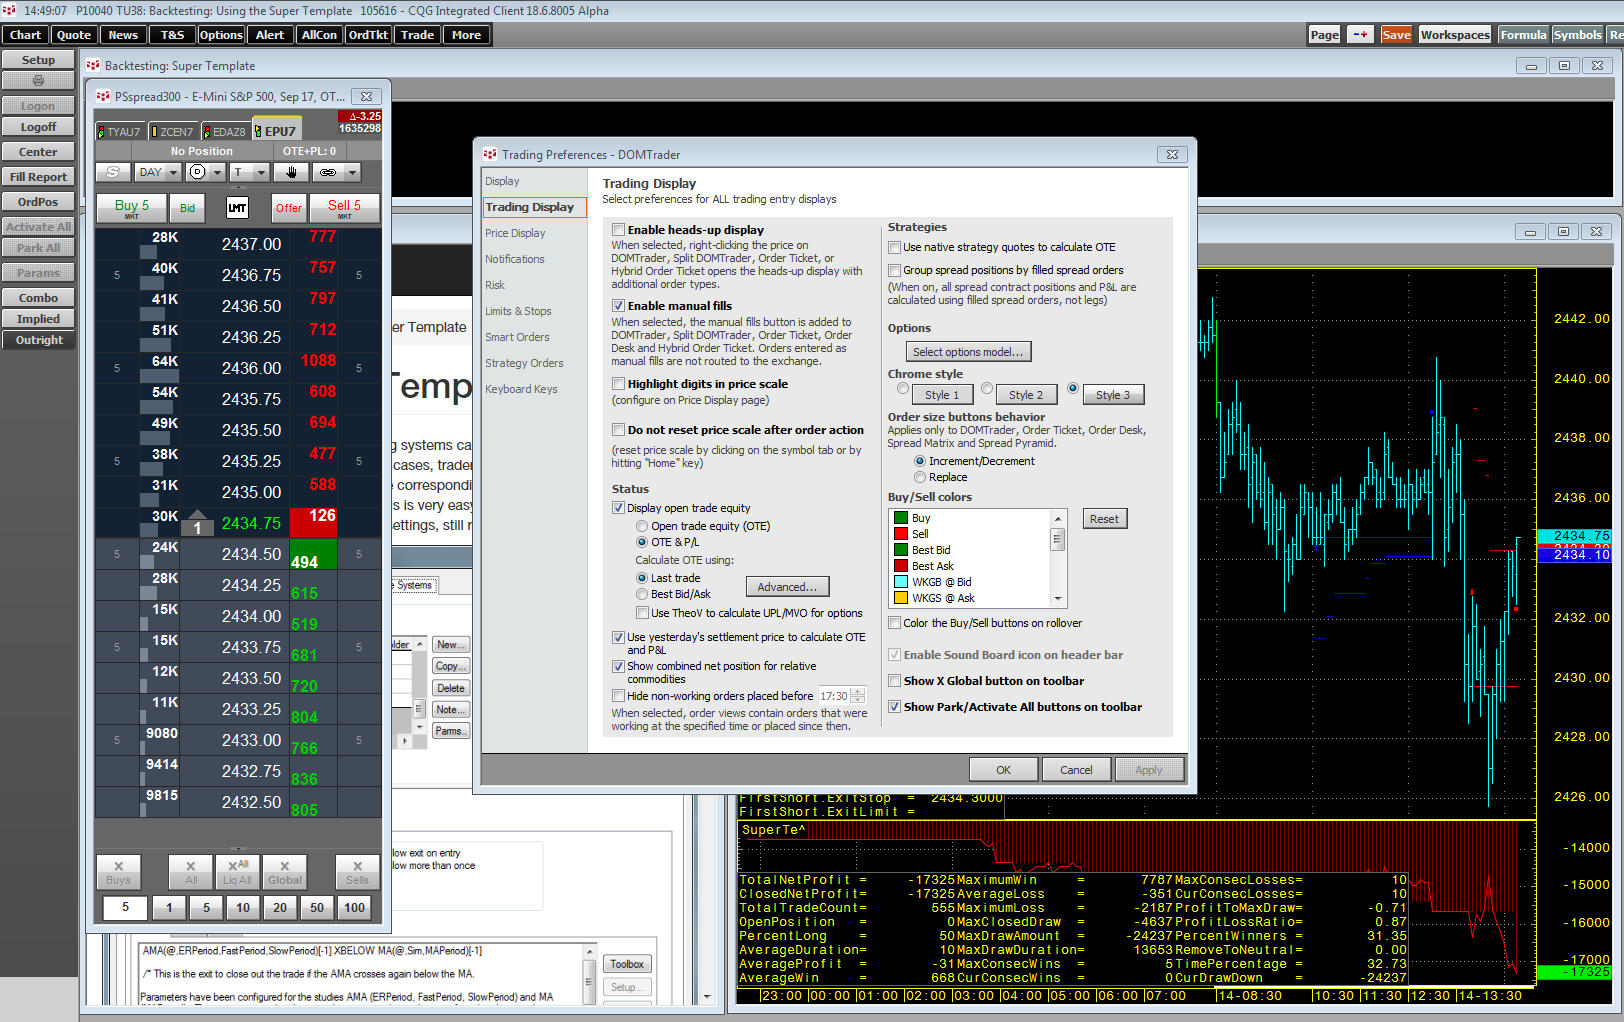
Some traders want to see their current open trade equity (OTE) and closed out trades (P&L) based on yesterday’s settlement, not the original price when the trade was opened. In DOMTrader's… more

This Microsoft Excel® spreadsheet tracks the BrokerTec US Treasury Yield Curve data and the ICAP Euro Bonds and Gilts markets.
The top-left quote display allows you to enter your… more
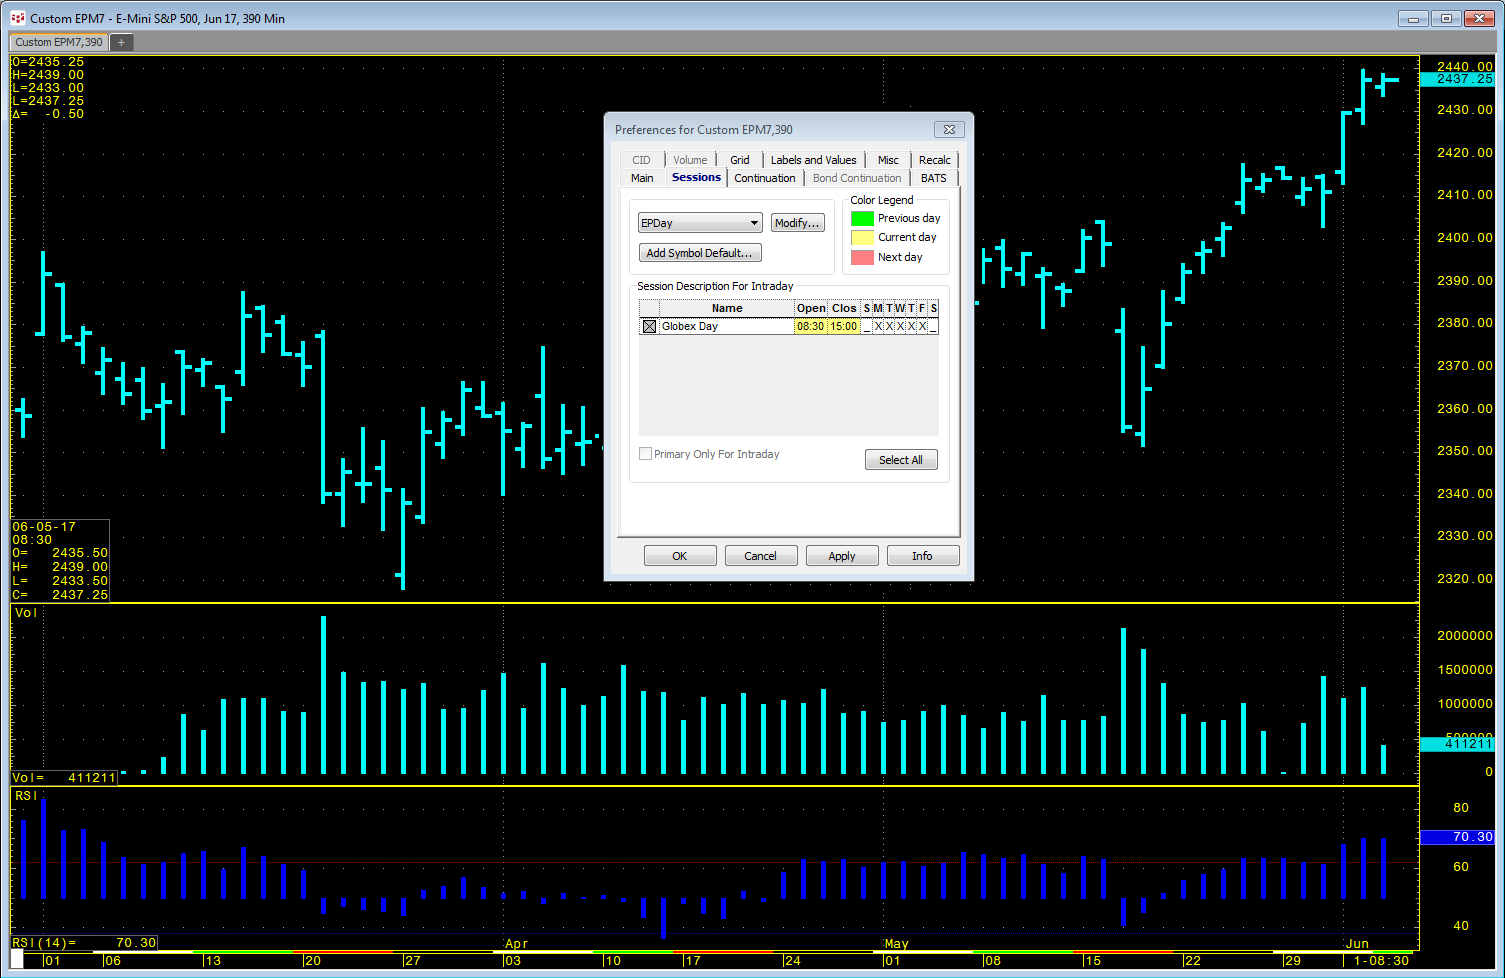
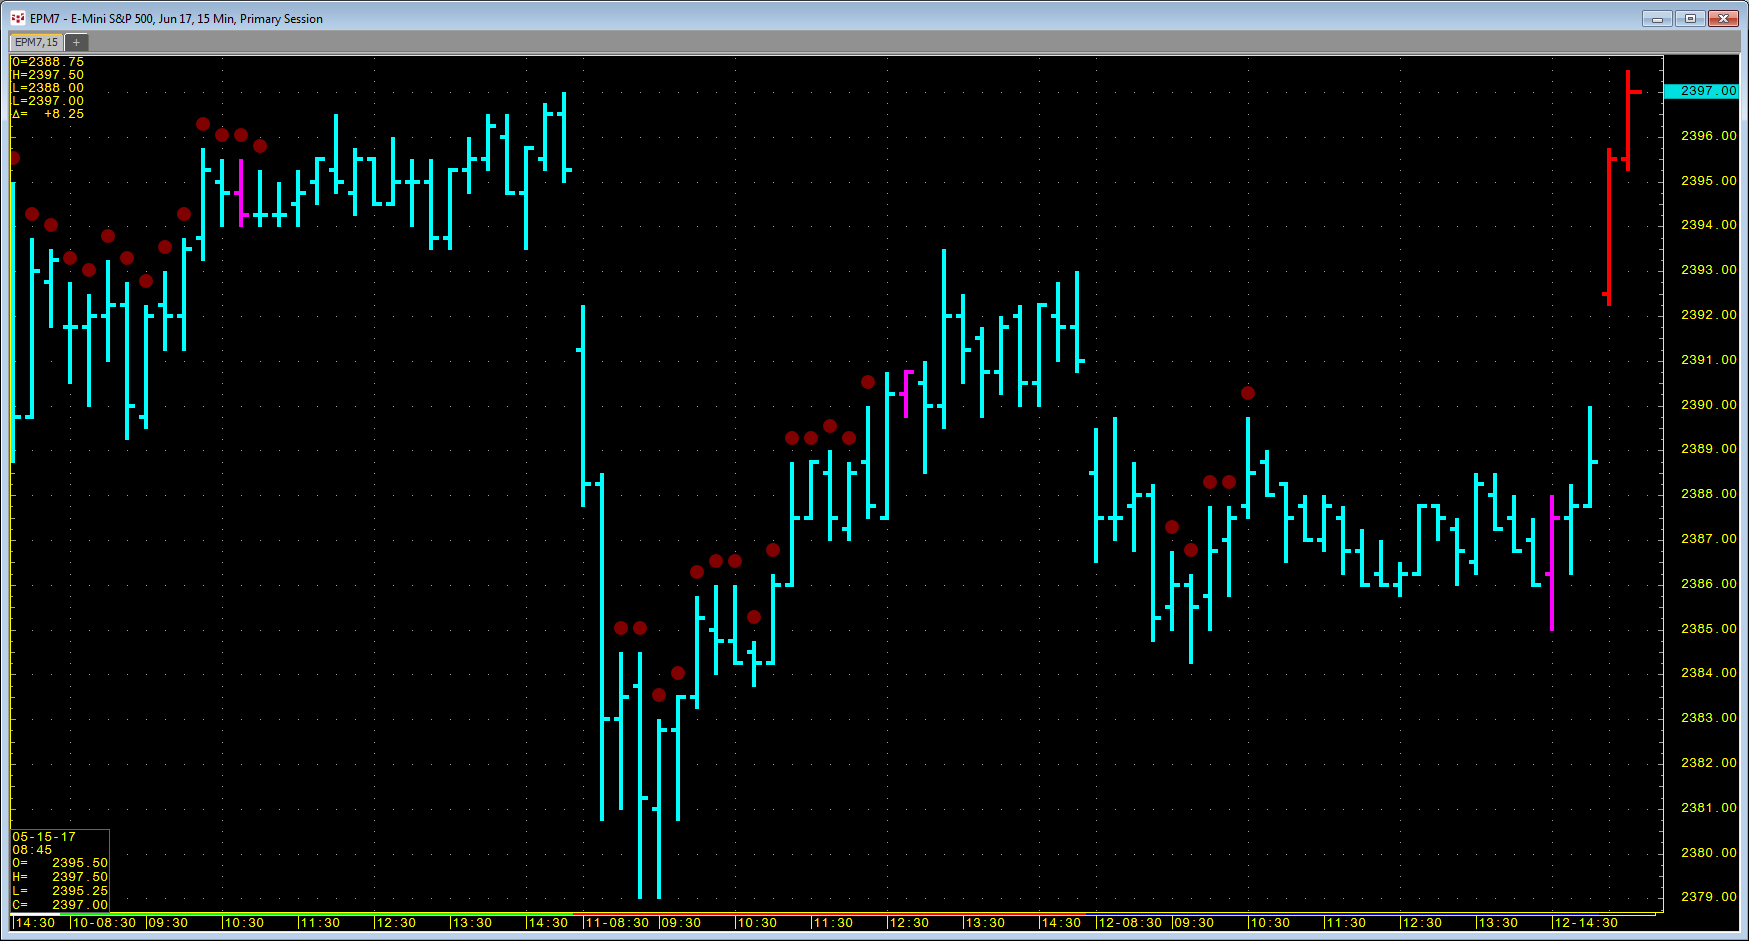
CQG Integrated Client customers can set up custom sessions for their charts. For example, NYSE’s trading hours are from 8:30 to 15:00. The primary session for the E-mini S&P opens at 8:30, but… more
Traders can use pre-built conditions or create their own conditions in CQG to mark bars when a particular condition is met. They can then pull this information into Excel using RTD… more

This macro-enabled Microsoft Excel® spreadsheet tracks the holdings of the Invesco S&P 500® Equal Weight Technology ETF (symbol: RYT). This ETF seeks to replicate, before fees and expenses,… more