This is an updated post detailing new features in the original dashboards from a previous post. The three downloadable Microsoft Excel® dashboards present a unique view of four markets. Each… more
Excel/RTD
This Microsoft Excel® spreadsheet pulls in market data for NFX WTI Crude Oil Penultimate Financial (symbol: NTQ) and NFX Brent Crude (symbol: BFQ), both traded on the NASDAQ OMX Futures Exchange (… more
This article walks through the details of using three Microsoft Excel® functions: RANK, COUNTIF, and VLOOUP. These functions are used to build an Excel dashboard that automatically ranks a… more
This Microsoft Excel® dashboard displays market data for a user-selected symbol. The standard market data includes the CQG Algo Orders study, which is only available in CQG’s flagship product, CQG… more
This Microsoft Excel® spreadsheet pulls in five Imoku studies along with open, high, low, and close bar values. You can change the symbol and the time frame. You can retrieve up to 300 daily… more
Customers using our flagship product, CQG Integrated Client (CQG IC), have access to a new study called Algo Orders. Using a proprietary algorithm, this indicator of trading activity detects and… more
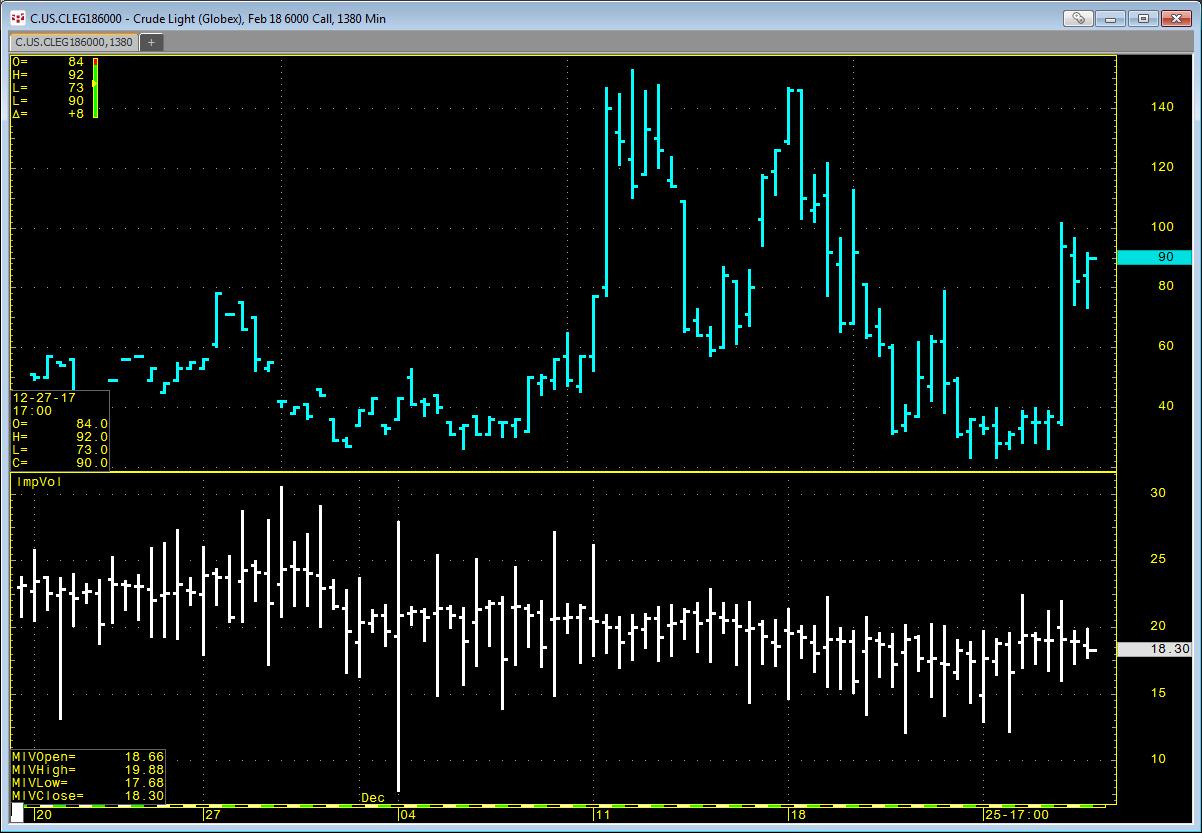
CQG offers an Implied Volatility (ImpVol) study that allows you to pull in historical implied volatility data onto a chart. ImpVol is not the implied volatility of one particular option.… more
CQG offers a collection of conditions you can use to mark points on a chart when the condition is met. In addition, you can create your own custom conditions. You can easily bring conditions… more
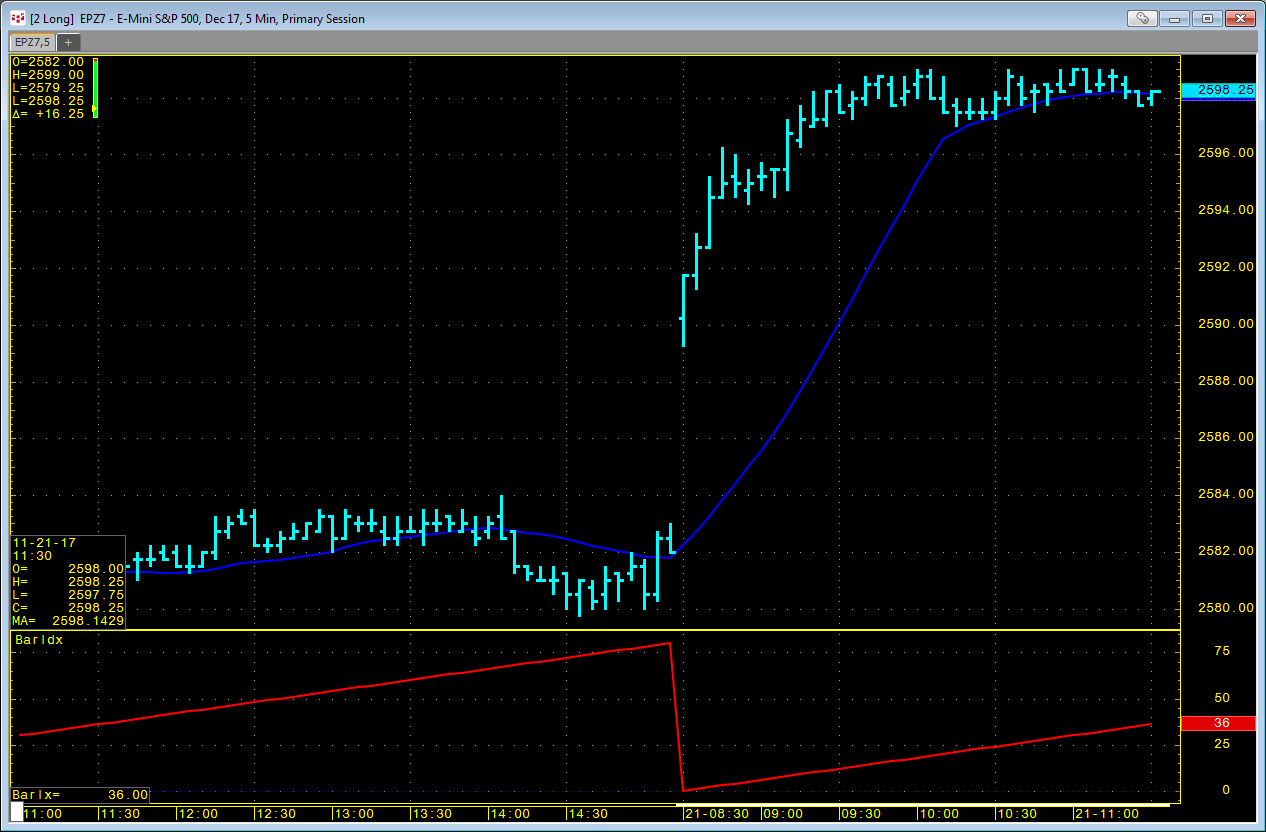
You can use LocalHour and LocalMinute functions in the RTD formula to pull in the open price for a market using a 5-minute bar at 12:00. This technique was detailed in a previous article here.… more
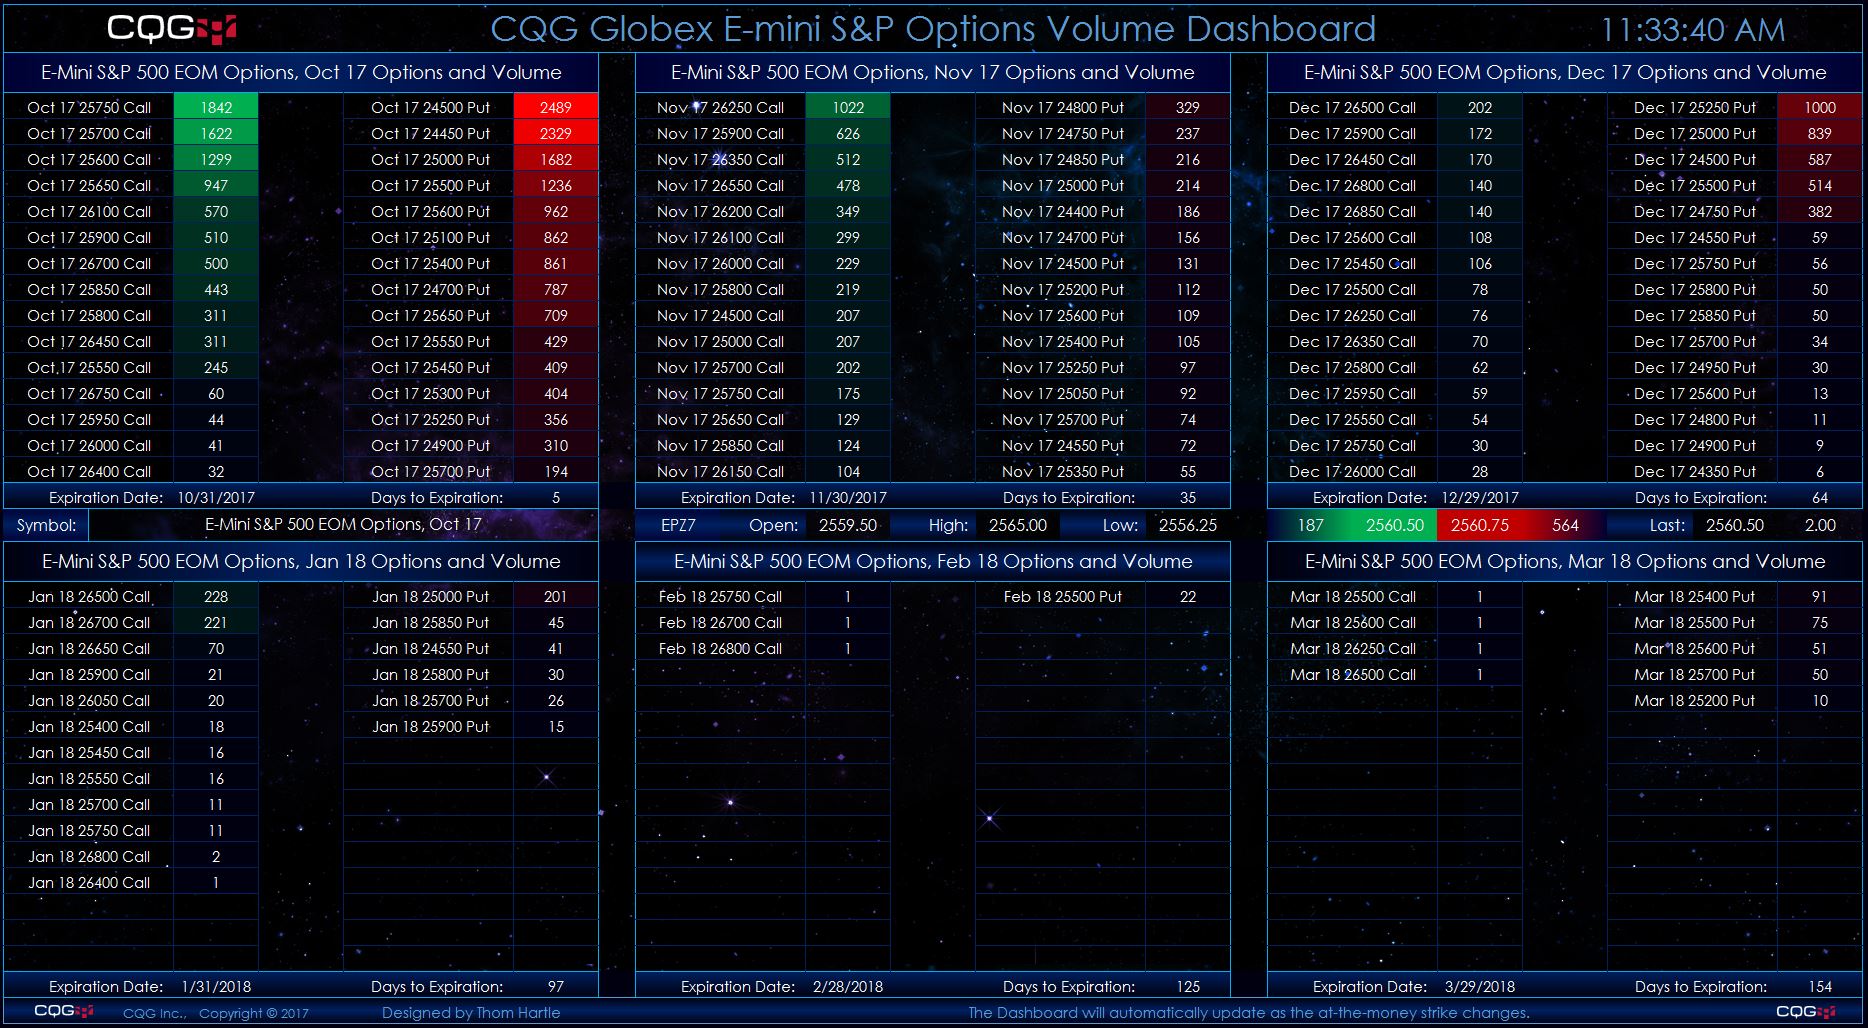
This Microsoft Excel® dashboard scans options on the E-mini S&P 500 futures market using the CQG RTD Toolkit for volume and displays strikes ranked by the volume traded for each listed expiry… more


