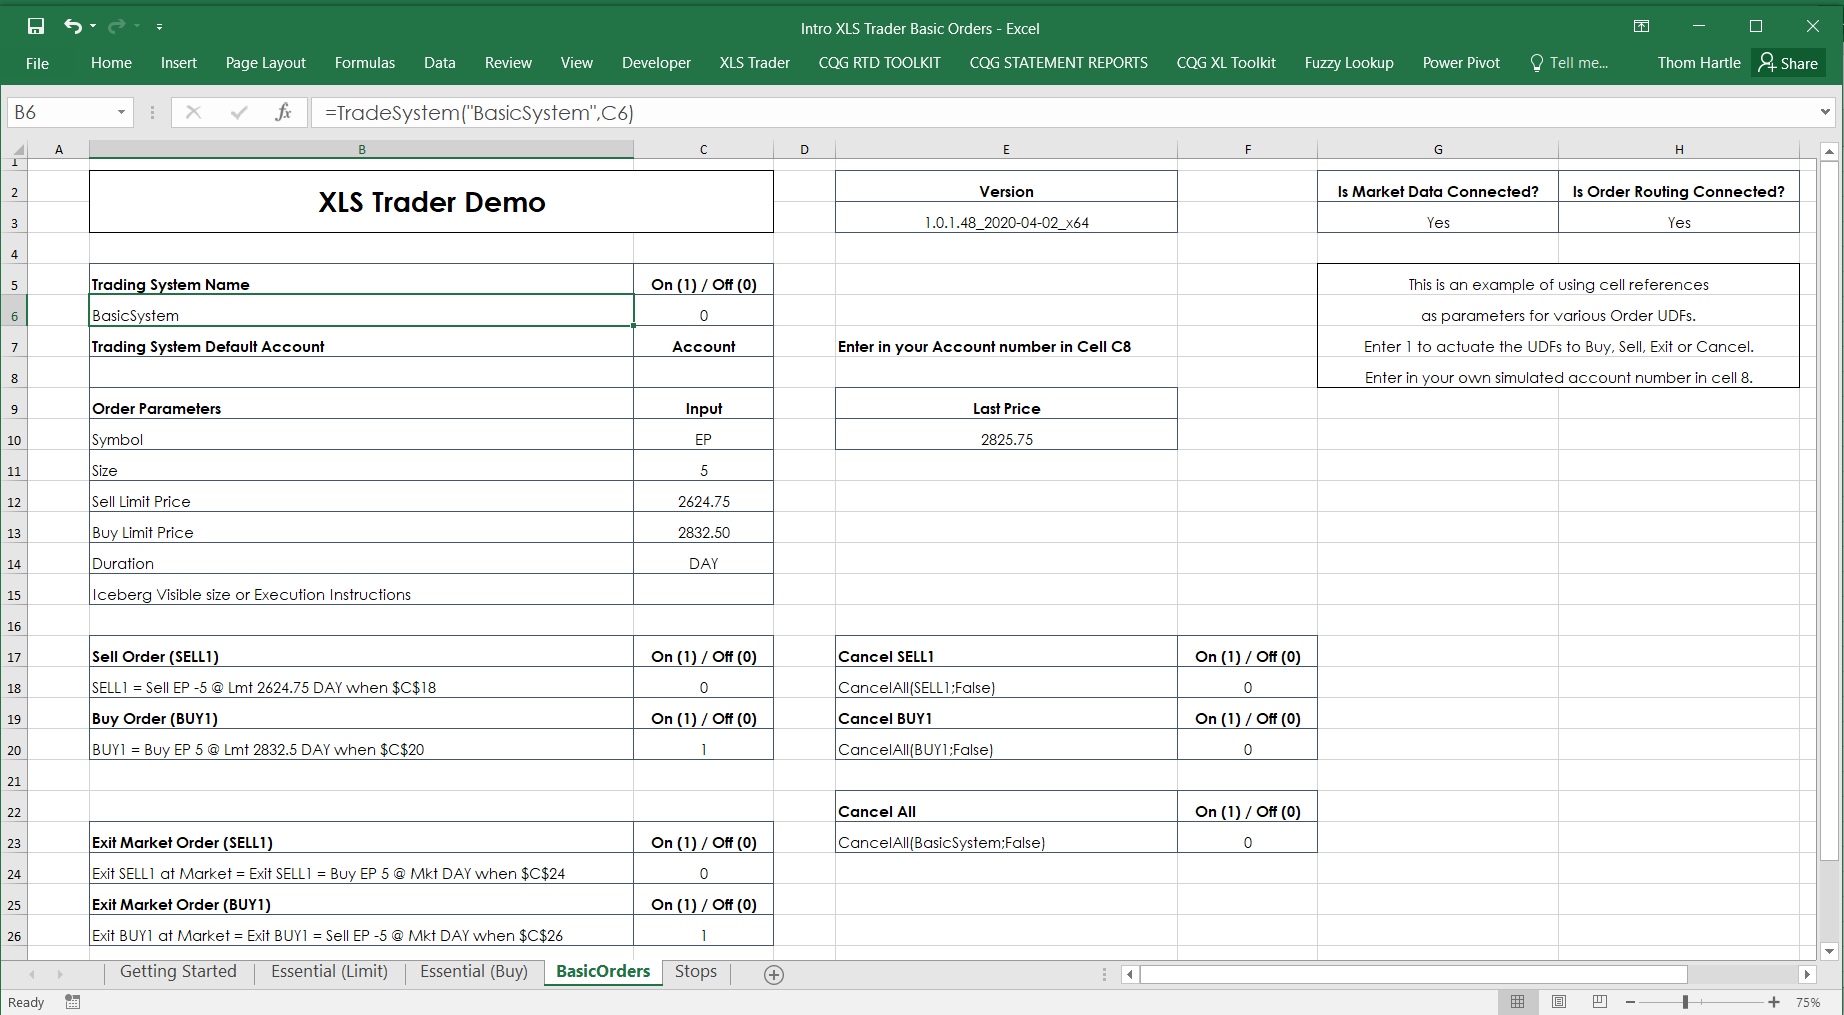
XLS Trader offers CQG Integrated Client customers the ability to route and manage orders directly from Microsoft Excel®. Now, you can create models within Excel that can be the basis for… more
Thom Hartle
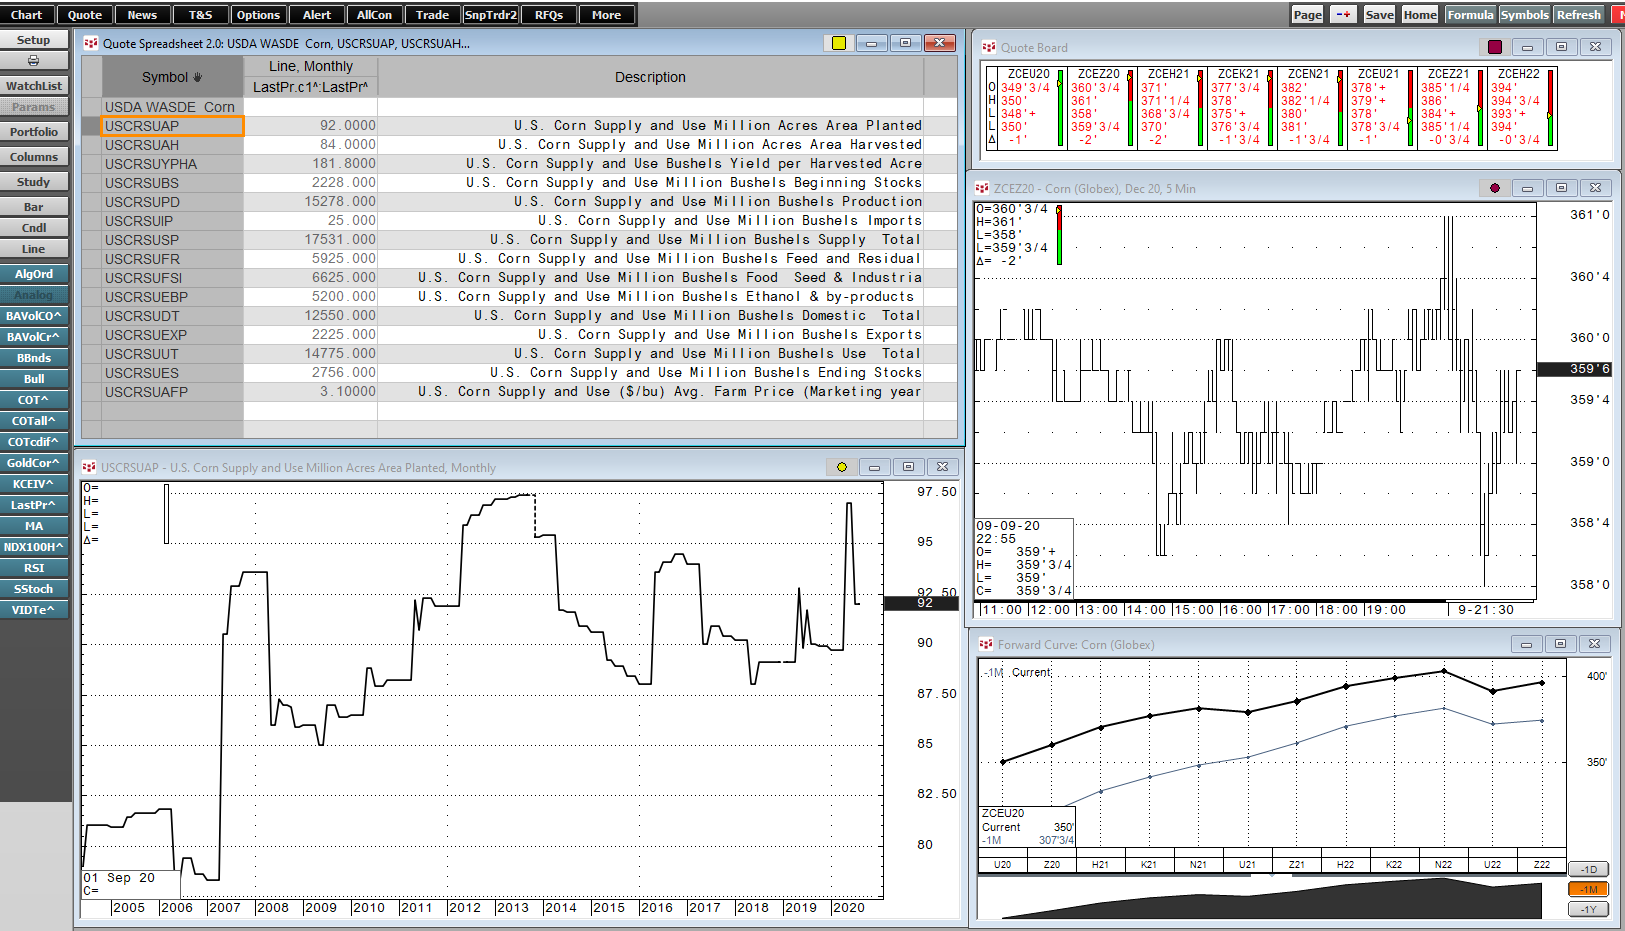
CQG has added the World Agricultural Supply and Demand Estimates (WASDE) data to the data feed. Published monthly by the United States Department of Agriculture (USDA), the World Agricultural… more
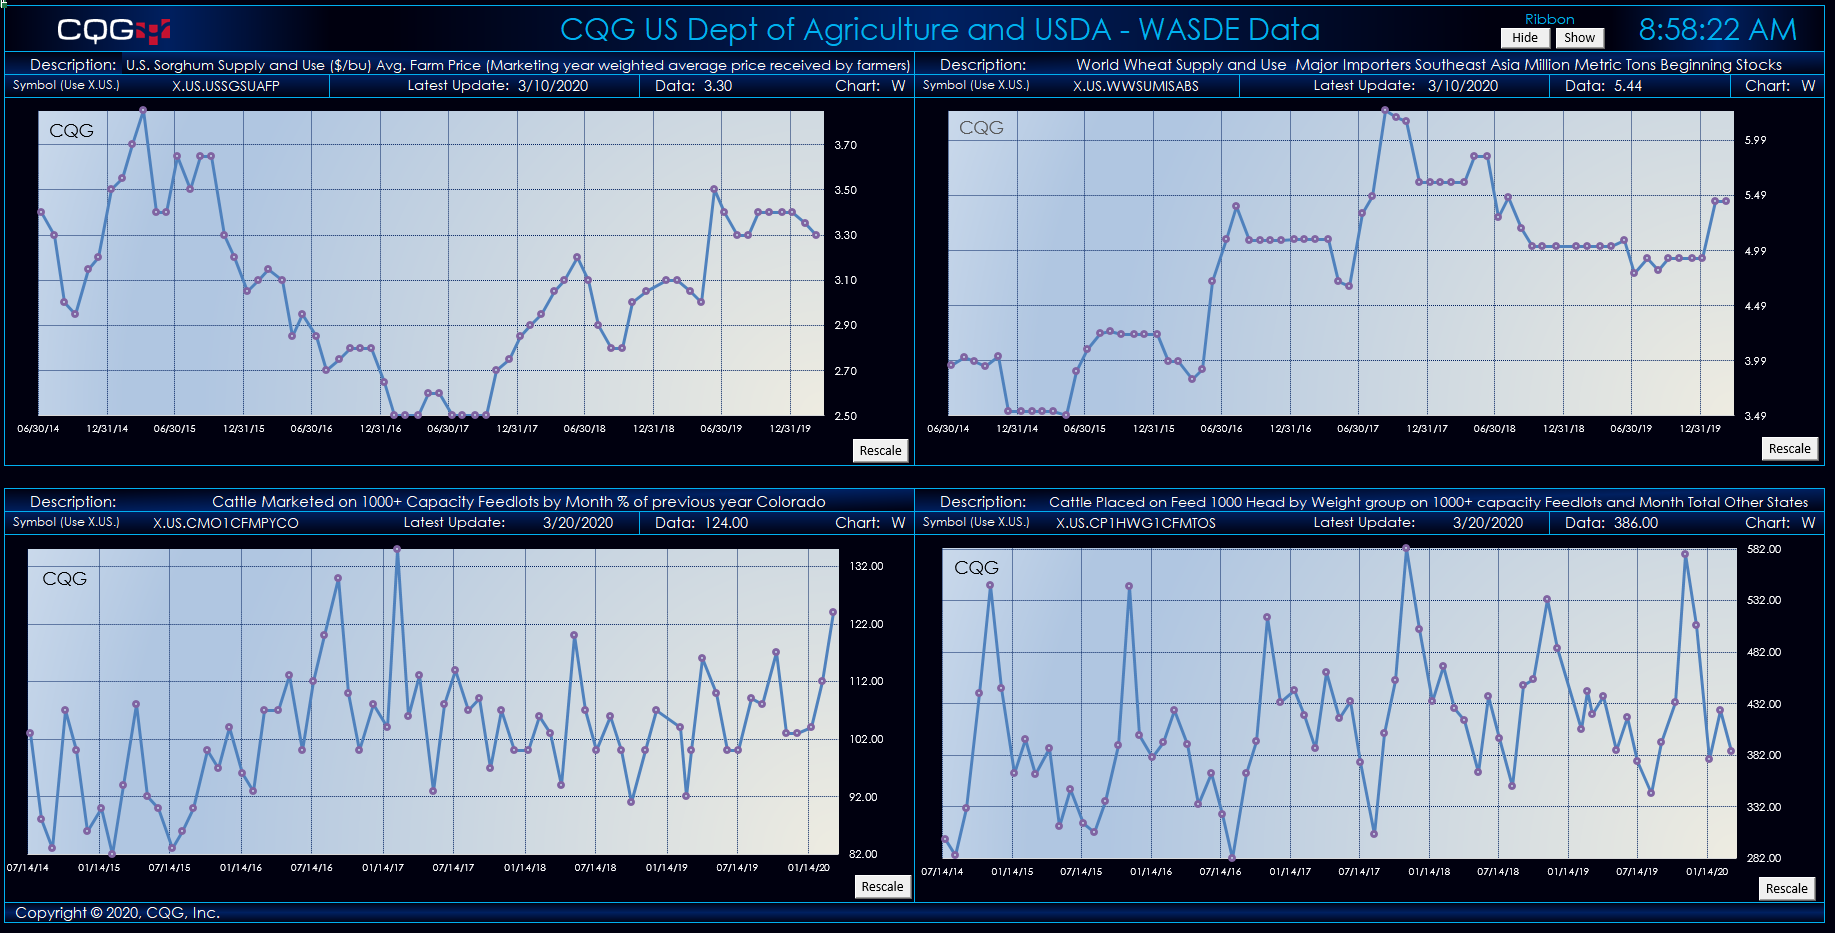
CQG has added United States Department of Agriculture (USDA) data and the World Agricultural Supply and Demand Estimates (WASDE) data to the data feed. Look for the data under the Exchanges list… more
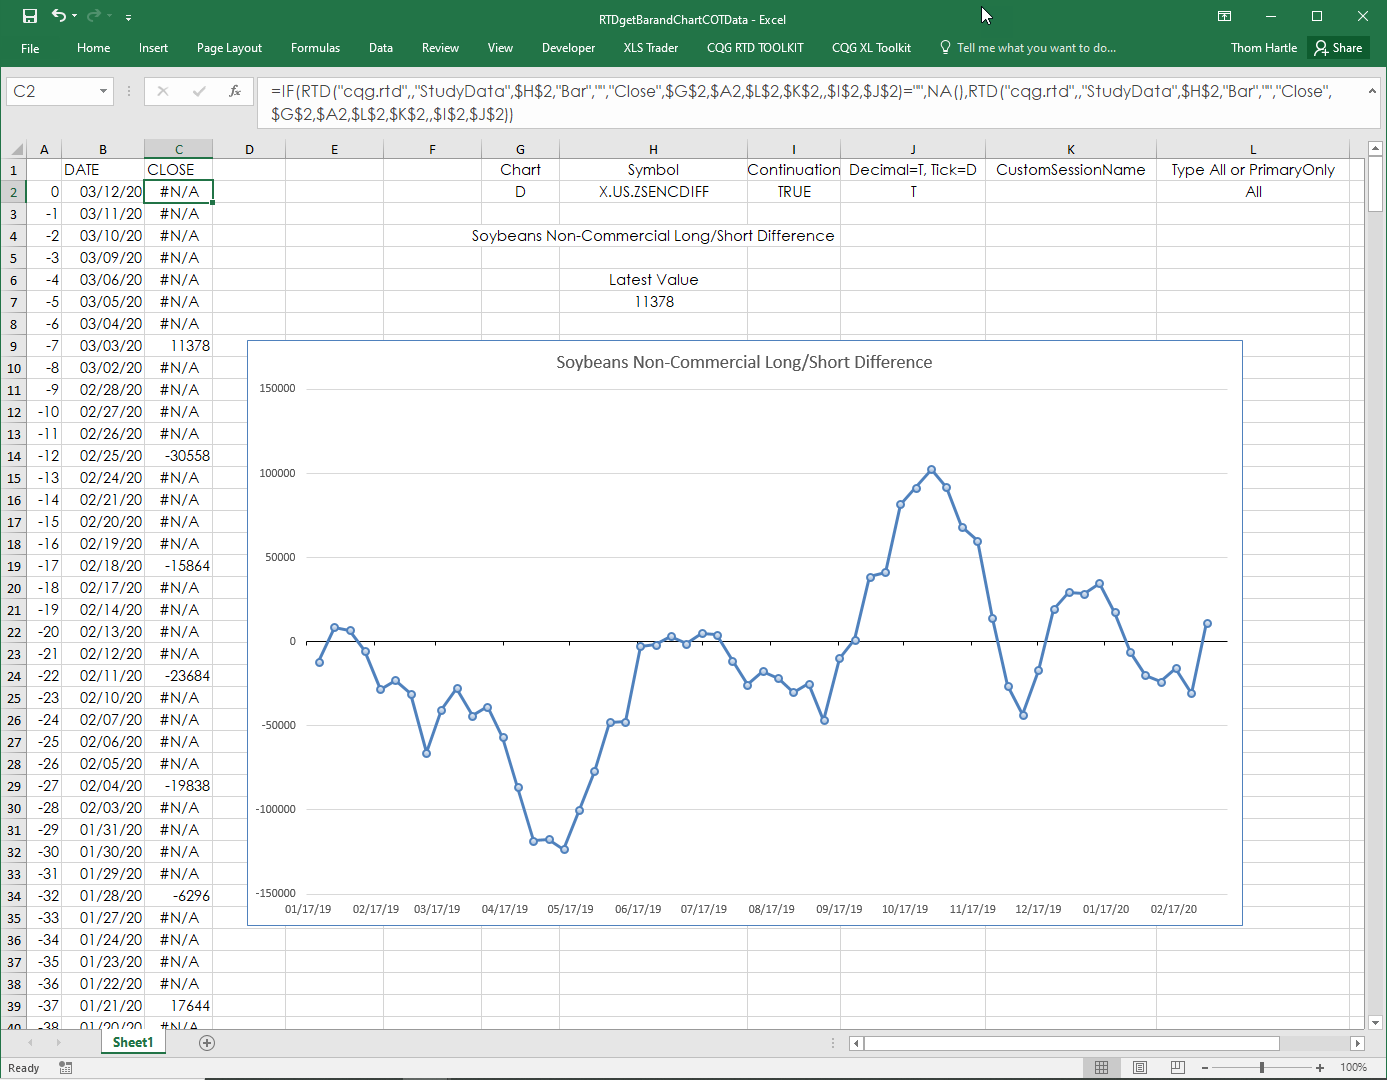
CQG has added the CFTC Commitment of Traders data to the data feed. You can read about working with COT symbols here.
If you are interested in pulling the latest COT updates and historical… more
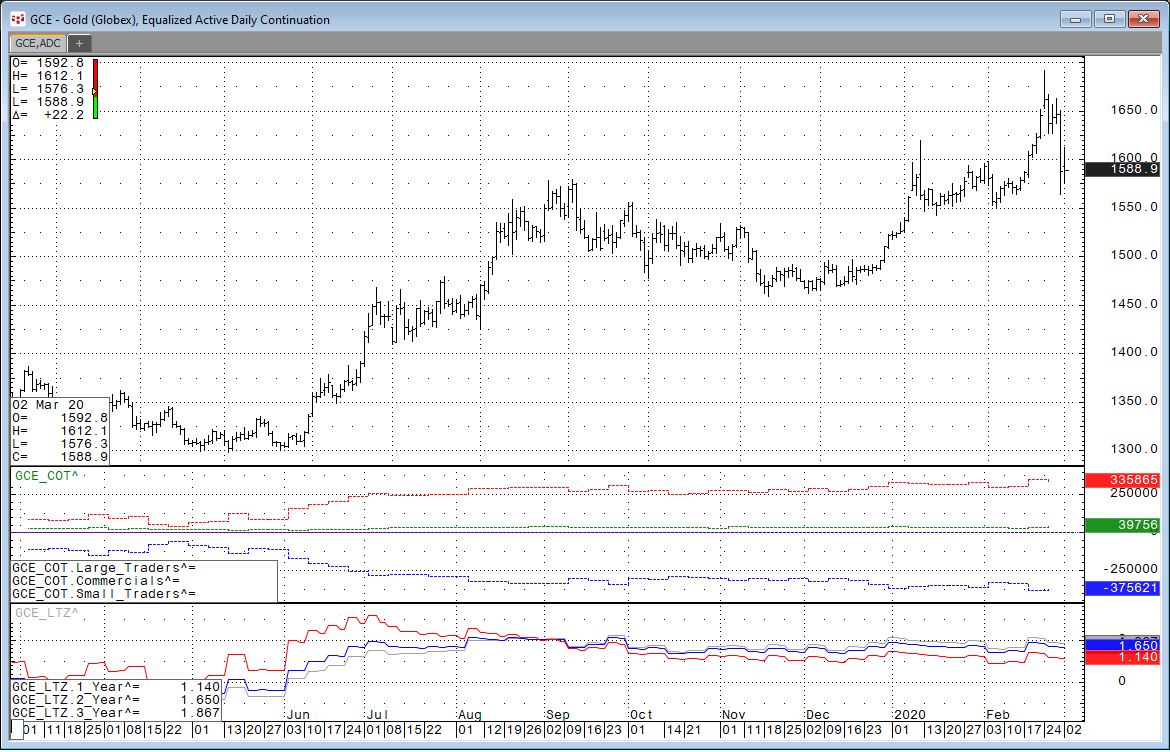
CQG has added the CFTC Commitment of Traders reports to the data feed. Under Exchanges in the CQG Symbol Finder you can find “CFTC Commitment of Traders.”
An easy way to find the… more
Customers using our flagship product, CQG Integrated Client (CQG IC) or QTrader, have access to a new study called Algo Orders. Using a proprietary algorithm, this trading activity indicator… more
Customers using our flagship product, CQG Integrated Client (CQG IC) or QTrader, have access to a new study called Algo Orders. Using a proprietary algorithm, this trading activity indicator… more
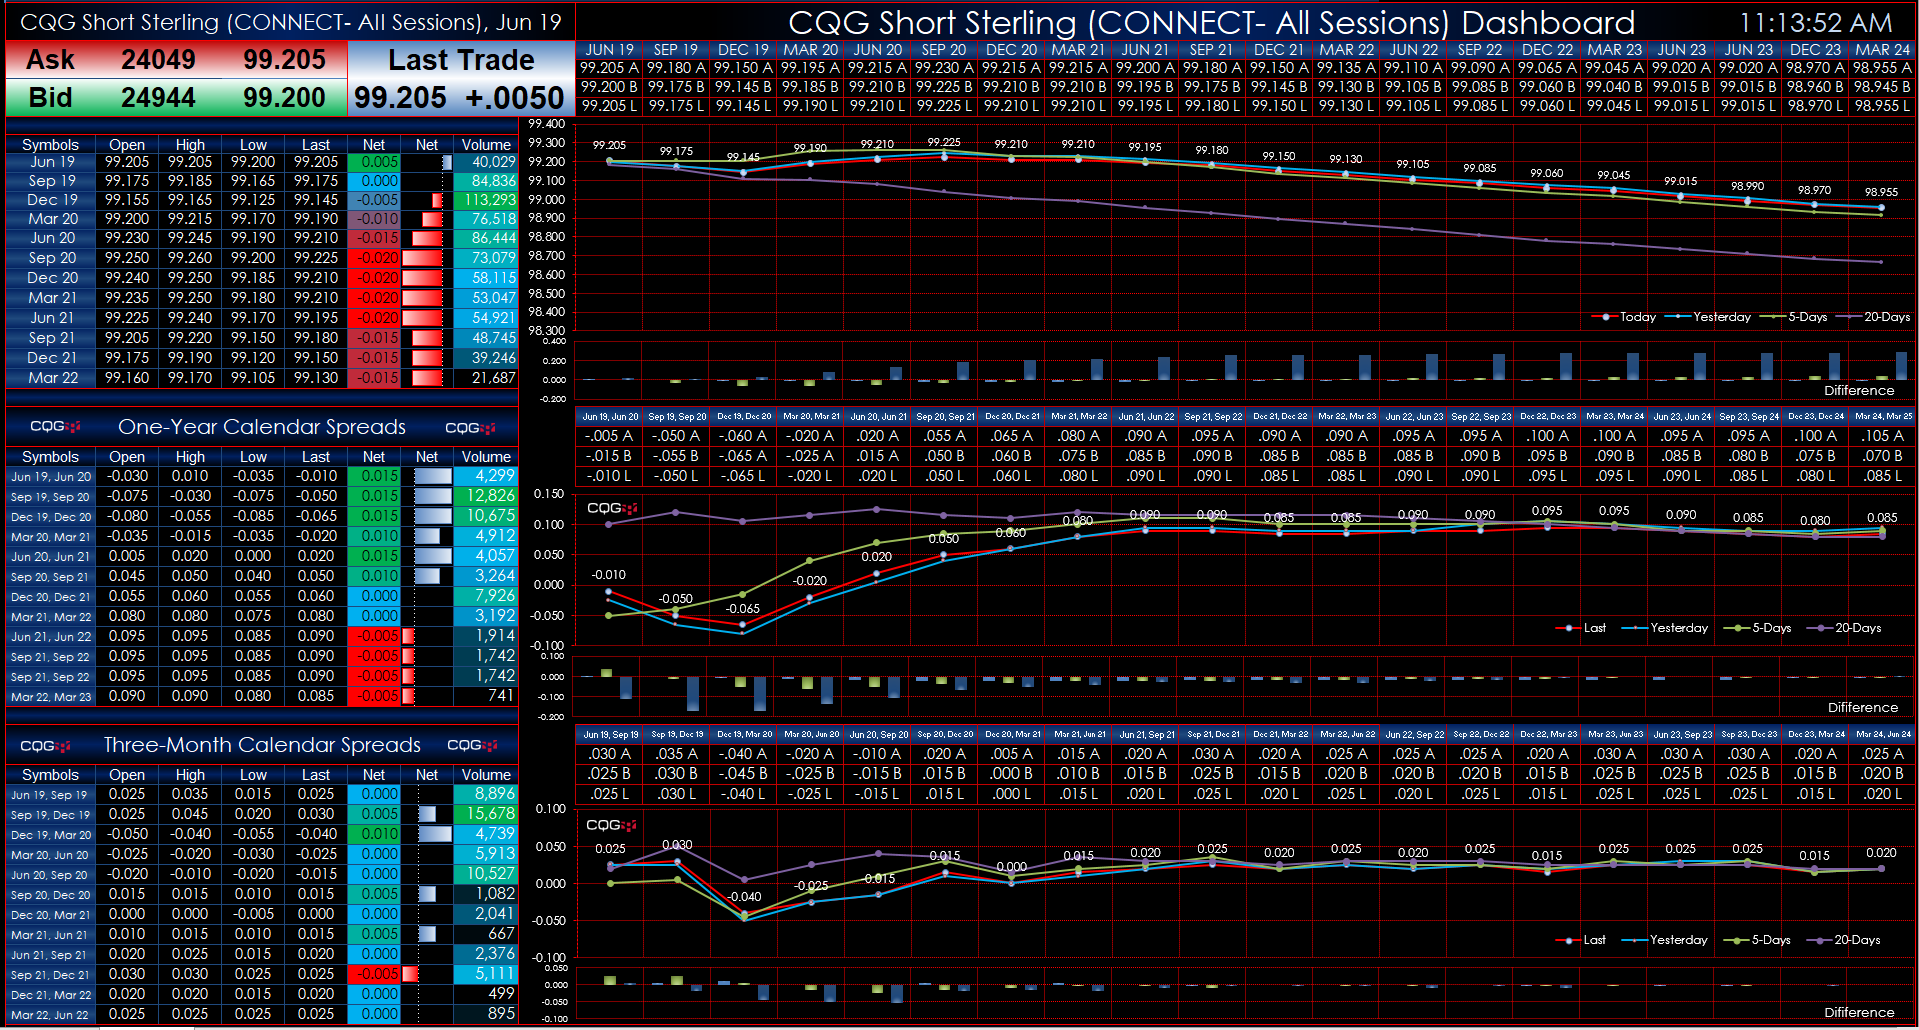
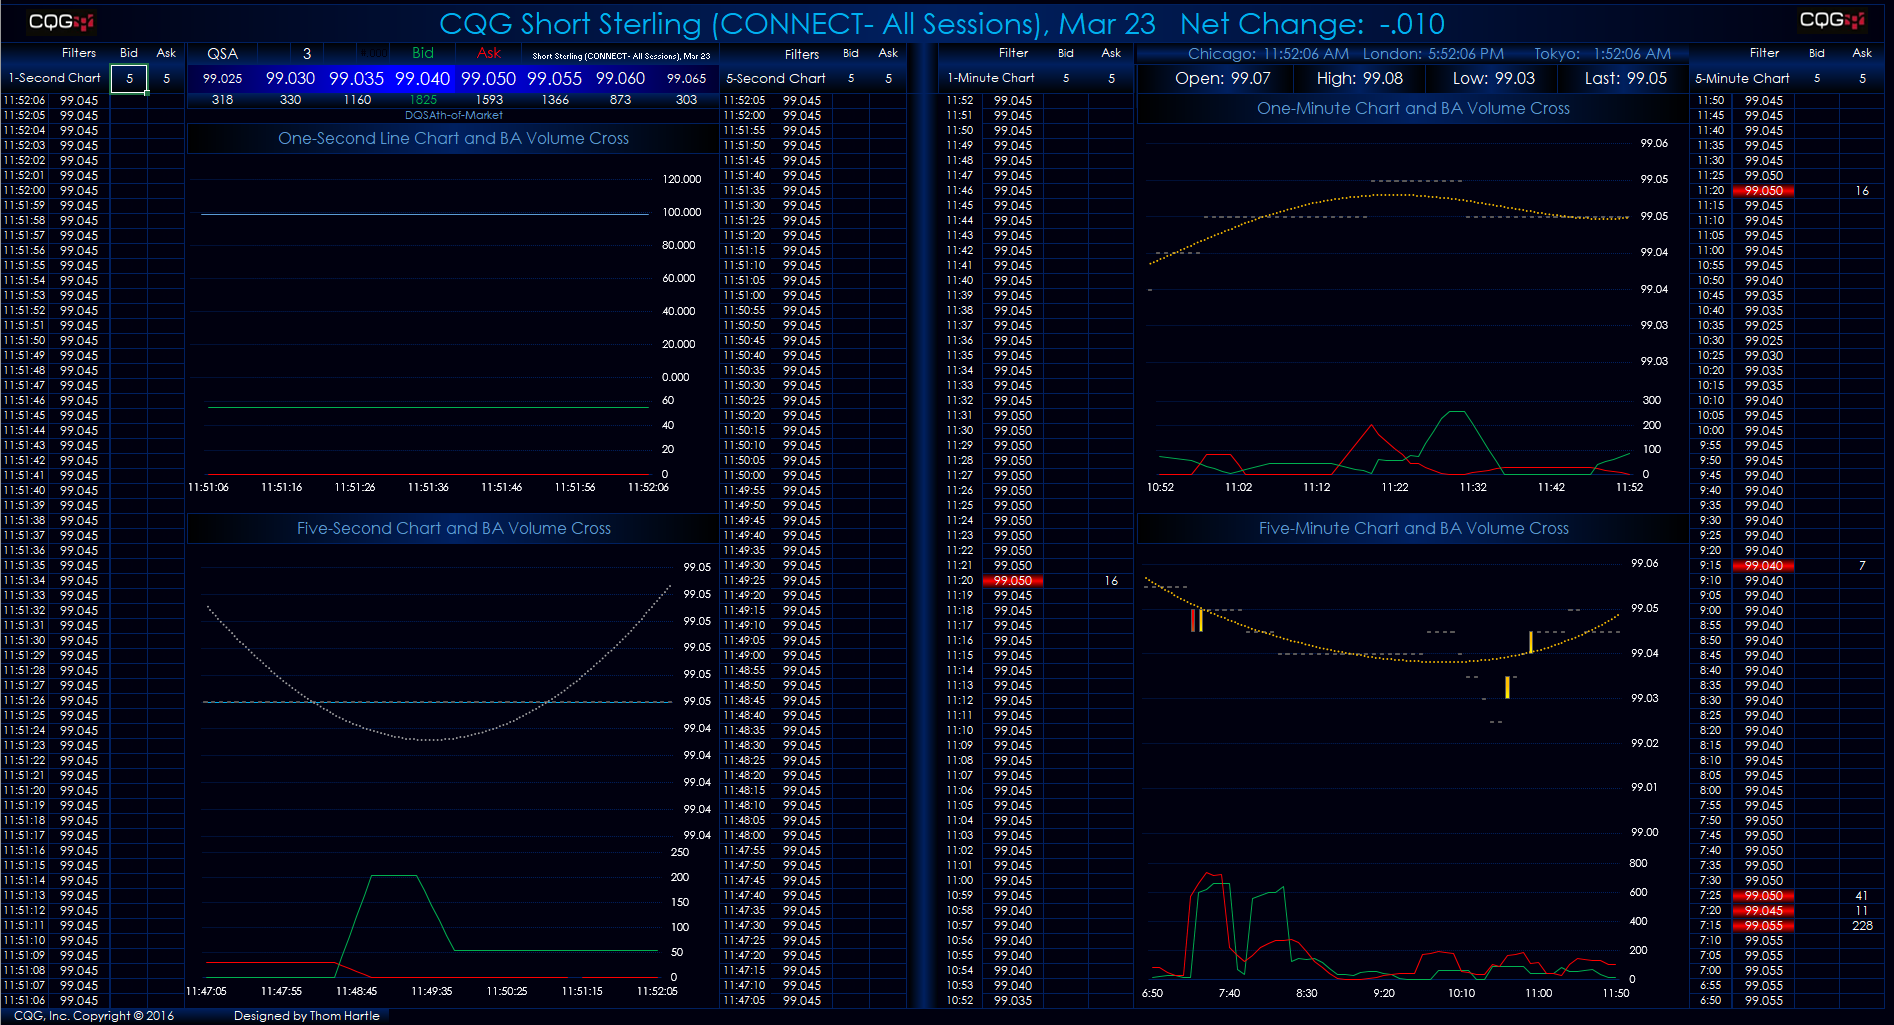
This Microsoft Excel® dashboard pulls in the Short Sterling market data traded on the ICE platform. There are three forward curve charts. The first chart displays the quarterly contracts forward… more
Customers using our flagship product, CQG Integrated Client (CQG IC) or QTrader, have access to a new study called Algo Orders. Using a proprietary algorithm, this trading activity indicator… more

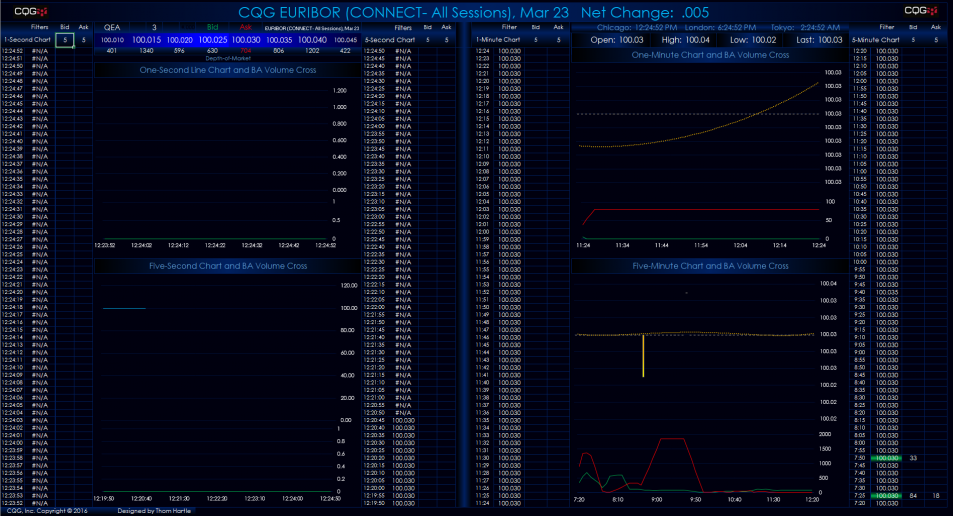
This Microsoft Excel® dashboard pulls in the Euribor market data traded on the ICE platform.
There are three forward curve charts. The first one displays the quarterly contracts… more