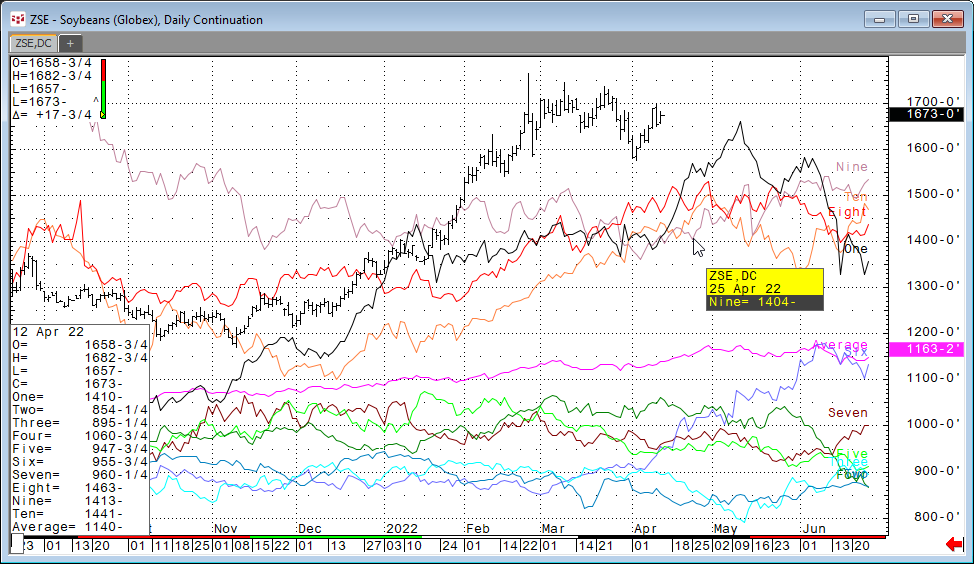
CQG offers the Seasonal Study for comparing the current market price action to the previous 10 individual years as line charts overlaid on the daily bar chart as shown below. In addition, the seasonal data lines can be pulled into Excel using RTD formulas.
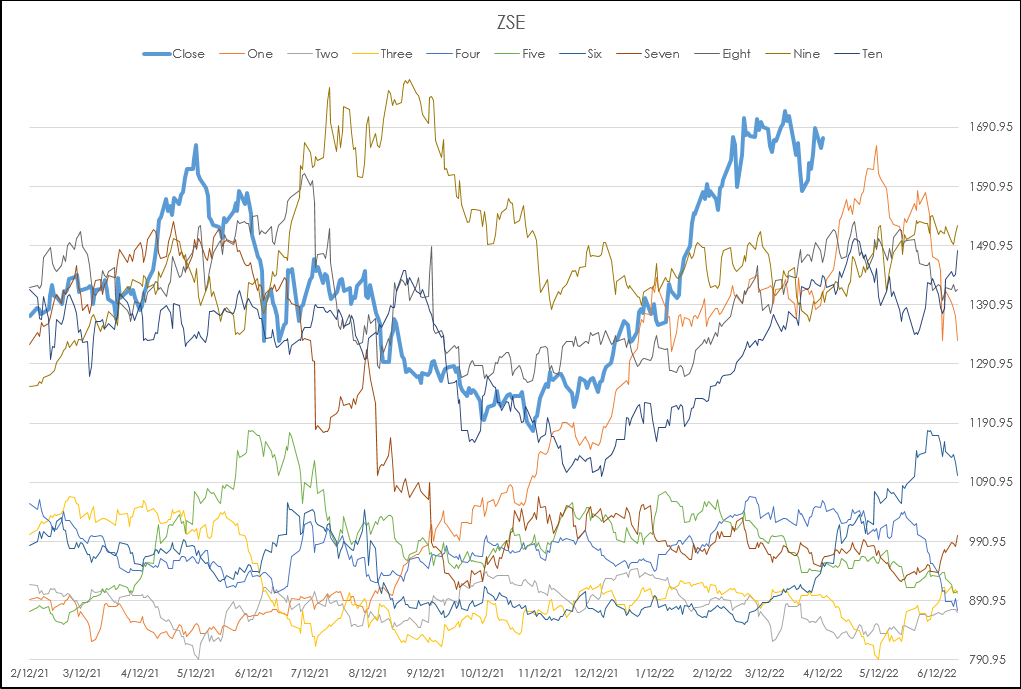
This same data using RTD formulas can be brought into Excel for further analysis. Here is the data displayed on an Excel chart.
There are two primary RTD functions used to pull in the data into the Excel sample.
This RTD call pulls in historical closing data for the symbol in fixed cell S2, continuation setting in fixed cell T2 and the lookback count in column A:
= RTD("cqg.rtd",,"StudyData",$S$2, "Bar", "", "Close",$T$2,A52,,,,,"T")
For pulling in Seasonal daily values forward from today’s date on the chart this RTD call uses Date data.
=RTD("cqg.rtd",,"StudyData","Close("&$S$4&") when (LocalYear("&$S$4&")="&O51&" and LocalMonth("&$S$4&")="&P51&" And LocalDay("&$S$4&")="&Q51&")", "Bar", "", "Close",$T$2,, "all",,,"False","T")
The year is in column O, the month is in column P and the day is in column Q.
To pull in the Seasonal Line data this formula below is used as the symbol for year One (the commodity symbol is in fixed cell S2):
="One("&$S$2&",NoPrd:=0,InputChoice:=Close)"
This symbol was found by using the procedures detailed in this post: Calling Custom and Standard Study Data into Excel.
The same symbol is used for year Two except the One is replaced with Two, etc. The “NoPrd” parameter is for the study parameters applied to a CQG chart to turn off projecting (the prediction) data on the chart.
The prediction is not a prediction, just simply what was the price action for each historical year from the current date for this particular commodity.
A modification to the symbol is used for plotting this forward data. An additional parameter is used. The number [51] is added to the symbol. This symbol is used to pull up to 50 days from today.
="One("&$S$2&",NoPrd:=0,InputChoice:=Close)[51]"
To pull in the Seasonal line forward from today the RTD formula uses the year, the month and the date going forward. However, you cannot simply continuously add a 1 to the previous day’s date going forward as you can end up returning a weekend date or a holiday date when there is no trading. Excel has the WORKDAY function which always returns a Monday through Friday date and holidays can be skipped. This requires a list of holidays, which are found on the Holidays tab in the sample spreadsheet. Column B provides the list of usable dates going forward from today to 50 days in the future.
=WORKDAY($R$52,INDIRECT("A51"),Holidays!$B$1:$B$44)
Column C is the historical daily closing prices for the commodity. Notice the first 50 cells displays the #N/A error. If Excel sees this as a data point on a chart then Excel simply skips that data point.
On the chart tab there is a Rescale Button. Clicking the button Excel will determine the maximum and minimum values from the Data tab and rescale the chart. Right-click on the chart and choose “Select Data” to choose which years to display by unchecking the years.
For more information about using the Seasonal study there is a post that includes a downloadable CQG PAC for monitoring the 20-, 50-, 100-, 200-day correlations of each Seasonal year to the current market using the CQG’s Instrument monitors and custom formulas.
The downloadable Excel sample expands on the above writings to pull in the data and display the chart.