This post details an Excel dashboard for tracking the performance of the US stock holdings of the VanEck Uranium + Nuclear Energy ETF (symbol: NLR).
NLR invests in companies building nuclear plants and reactors, uranium miners, utilities generating nuclear electricity, and nuclear technology firms.
This table details NLR Holdings (Company Name, Ticker, Exchange, as of 9/24/2025)
| Name | Ticker | Exchange |
|---|---|---|
| Oklo Inc | OKLO | NYSE (U.S.) |
| Constellation Energy Corp | CEG | NASDAQ (U.S.) |
| Cameco Corp | CCJ | NYSE (U.S.) / TSX (Canada) |
| BWX Technologies Inc | BWXT | NYSE (U.S.) |
| Centrus Energy Corp | LEU | NYSE American (U.S.) |
| NuScale Power Corp | SMR | NYSE (U.S.) |
| Denison Mines Corp | DNN | NYSE American (U.S.) / TSX (Canada) |
| Public Service Enterprise Group Inc | PEG | NYSE (U.S.) |
| NexGen Energy Ltd | NXE | NYSE (U.S.) / TSX (Canada) |
| Uranium Energy Corp | UEC | NYSE American (U.S.) |
| NAC Kazatomprom JSC | KAP | London Stock Exchange (LSE), GDRs |
| PG&E Corporation | PCG | NYSE (U.S.) |
| CGN Power Co Ltd | 1816 | Hong Kong Stock Exchange (HKEX) |
| Energy Fuels Inc | UUUU | NYSE American (U.S.) / TSX (Canada) |
| Paladin Energy Ltd | PDN | Australian Securities Exchange (ASX) |
| Nano Nuclear Energy Inc | NNE | NASDAQ (U.S.) |
| ČEZ a.s. | CEZ | Prague Stock Exchange |
| Yellow Cake Plc | YCA | London Stock Exchange (LSE) |
| Fortum Oyj | FORTUM | Nasdaq Helsinki (Finland) |
| Kepco E&C (Korea) | 52690 | Korea Exchange (KRX) |
| CGN Mining Co Ltd | 1164 | Hong Kong Stock Exchange (HKEX) |
| Deep Yellow Ltd | DYL | Australian Securities Exchange (ASX) |
| Silex Systems Ltd | SLX | Australian Securities Exchange (ASX) |
| Encore Energy Corp | EU | NASDAQ (U.S.) |
| Boss Energy Ltd | BOE | Australian Securities Exchange (ASX) |
At the end of this post are two downloadable Excel dashboards, one has an image background, and one has a black background.
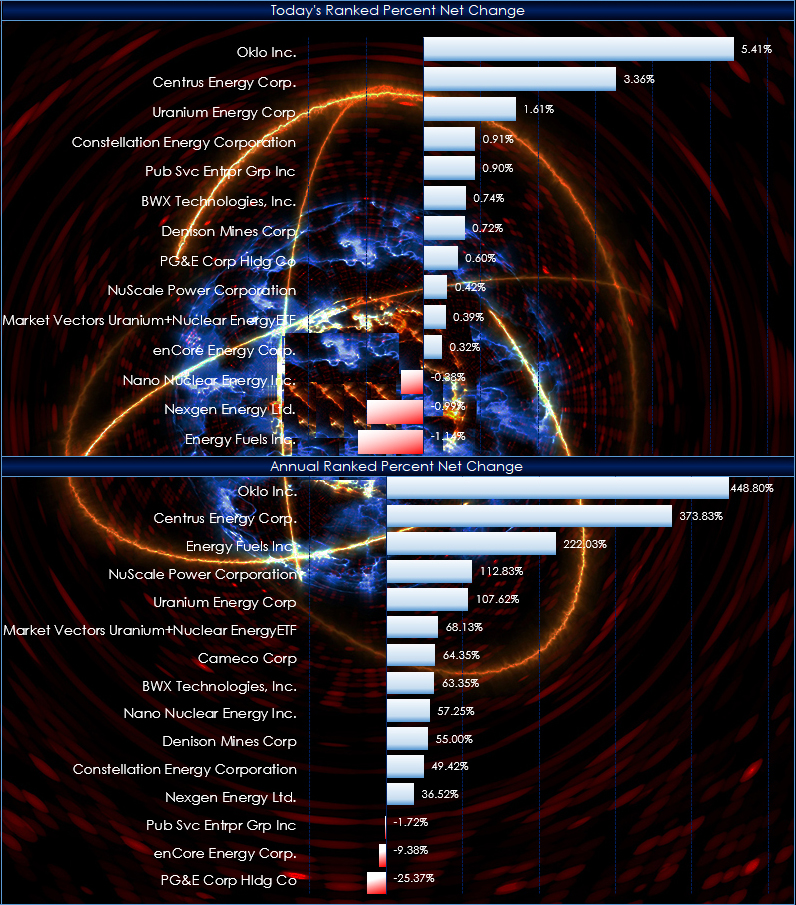
The dashboards have two charts; the top chart is dynamically ranked displaying today's net percent change, and the bottom chart displays the dynamically ranked annual percent change.
The top section of the quote display allows you to enter your own symbols.
The second section displays the stocks dynamically ranked by today's percentage net change. The third section displays the stocks dynamically ranked annual percent change.
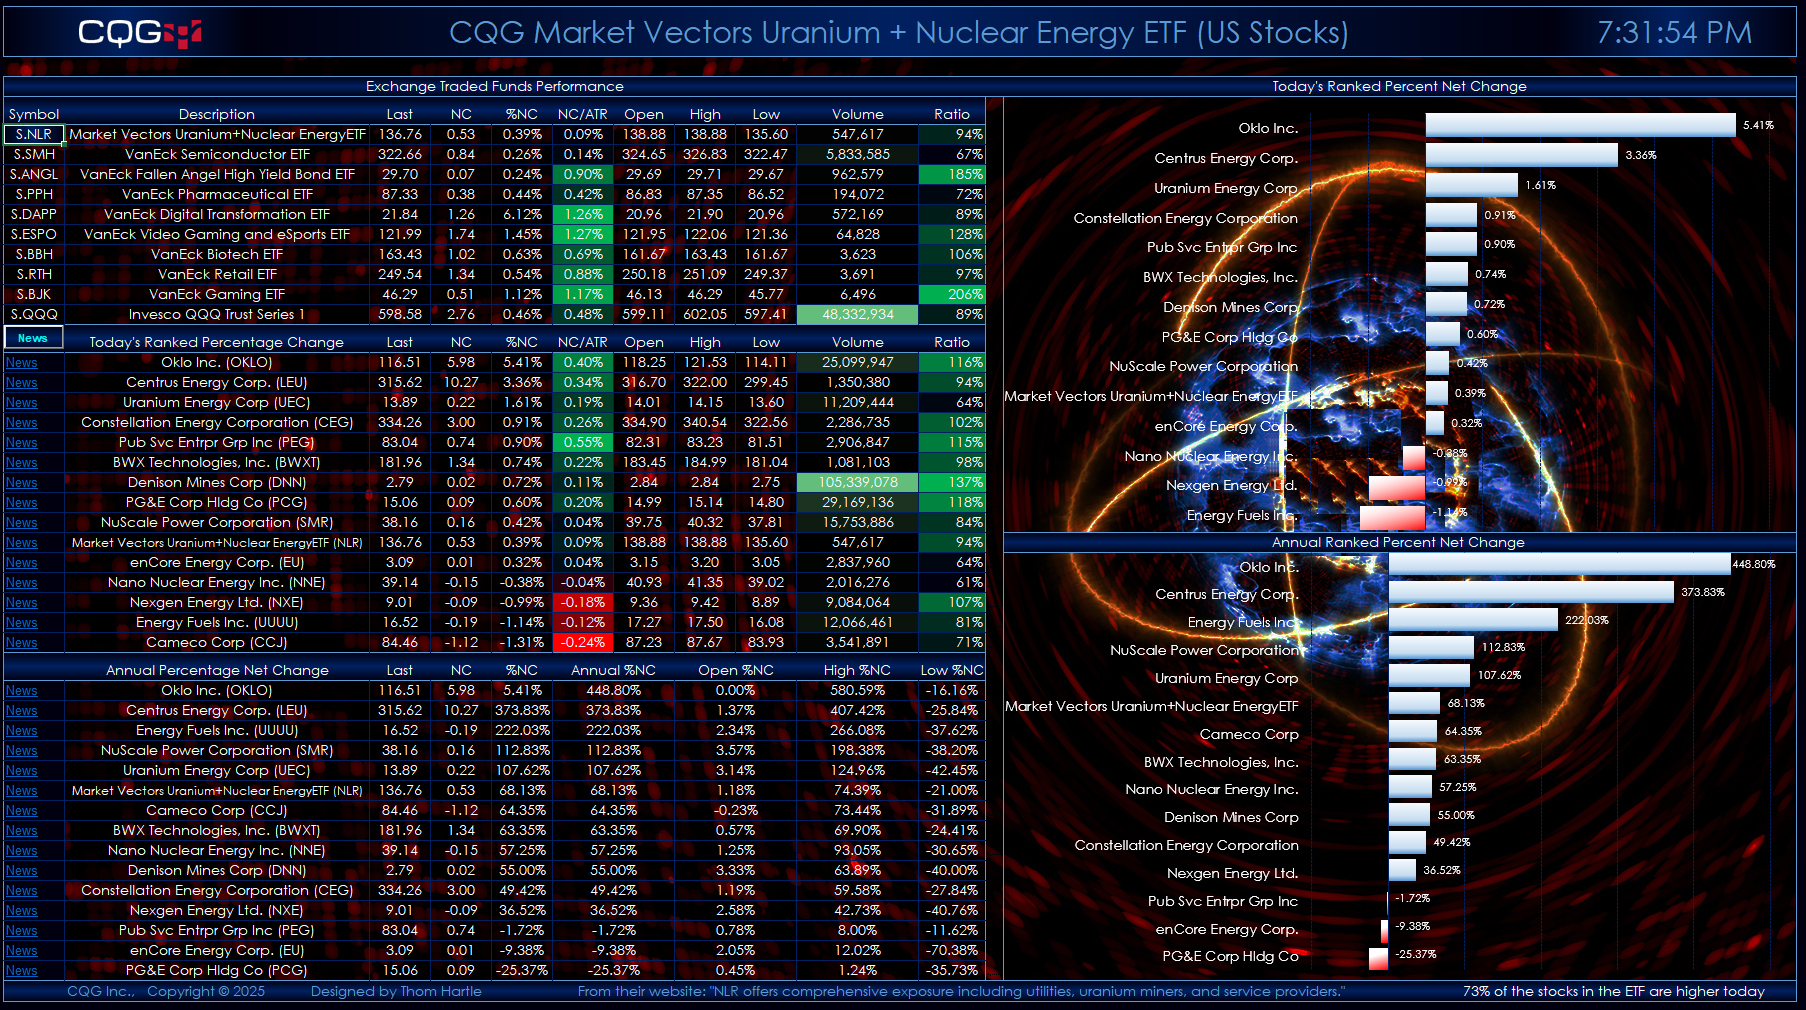
Quote data includes today's net change as a ratio to the 21-day Average True Range study. Next to today's traded volume is a column that calculates the ratio of today's volume versus the 21-day average of the volume. This ratio column gives you a sense of how active today's trading is relative to recent history. Readings of 100% and higher indicate active trading.
A key feature next to each company name is a link to Yahoo Finance. Clicking the News link will take you to the Yahoo page for that symbol. Note that this could take approximately 30 seconds to open in a browser. Turning off Extensions in your browser will make this happen faster.
If you open another Excel spreadsheet, then this dashboard will no longer be the active spreadsheet. The macro that updates the links and ranks the stocks by performance will stop. To start the macro, simply click the News toolbar button in the first column.
Requires CQG Integrated Client or CQG QTrader, data enablements for the NYSE and Nasdaq stocks. Excel 2016 or more recent locally installed, not in the cloud.
This post was assisted by AI and reviewed by Thom Hartle.