Developed by Marc Chaikin, the Chaikin Oscillator is a technical analysis tool traders and investors use to confirm trends and indicate possible trend reversals. The oscillator uses the Accumulation/Distribution (A_D) as the basis and then the difference between two exponential moving averages is plotted as an oscillator.
The Accumulation/Distribution (A_D) tracks the price action by determining where the close is relative to a price range and multiplies the ratio by the volume. The study is an accumulated line of the ratio times the volume.
The chart below is a continuous daily bar chart of Gold with the A_D study.
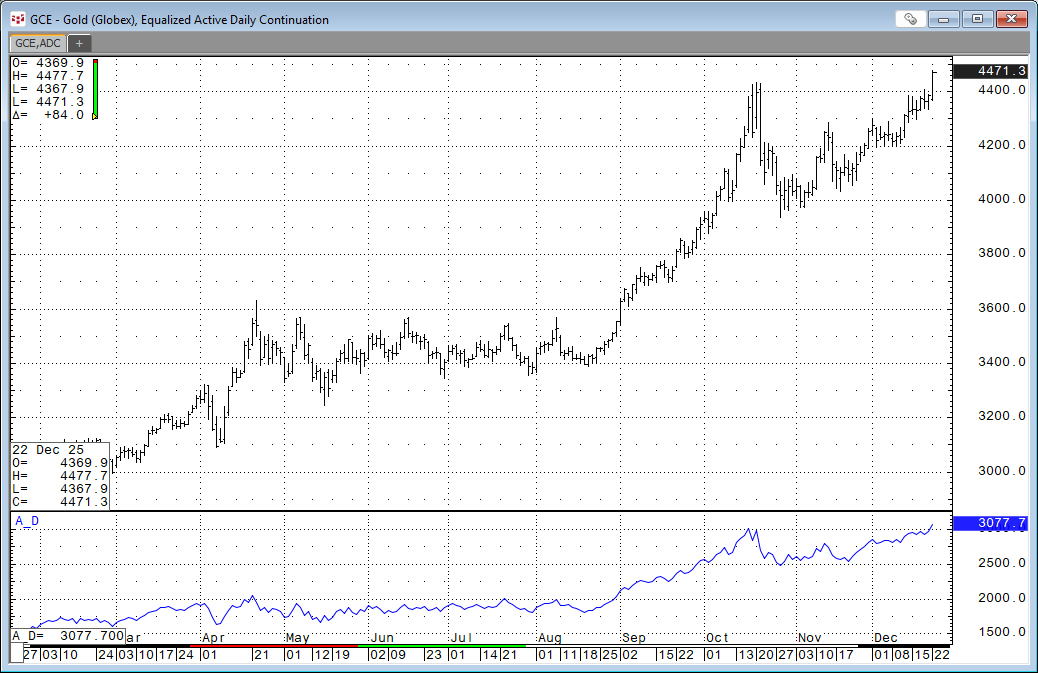
The study moves sideways when the price action is sideways and the study trended higher with the market.
The chart below is a continuous daily bar chart of Wheat with the A_D study.
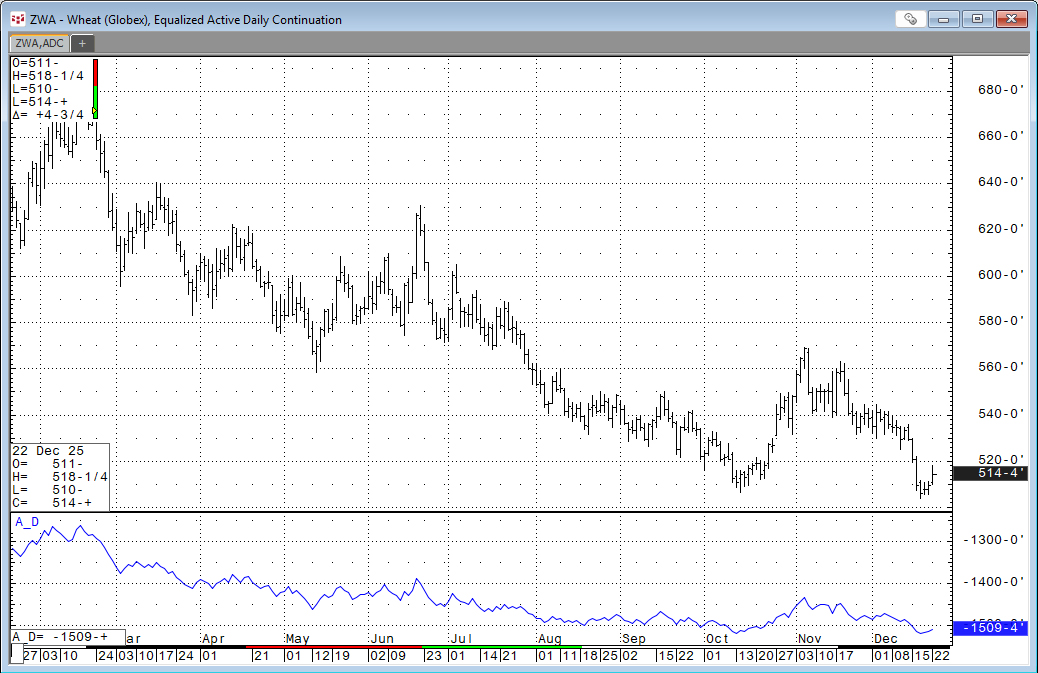
The study trended lower as the market trended lower.
The Chaikin Oscillator is the 3-period exponential moving average of the A_D study minus the 10-period exponential moving average of the A_D study. The code in CQG is:
MA(A_D(@),Exp,expma1)- MA(A_D(@),Exp,expma2)
Where expma1 and expma2 are the parameters for the EMAs. The default is 3 and 10 respectively.
The guidelines for applying the Chaikin Oscillator include:
- Values above zero indicate buying pressure.
- Values below zero indicate selling pressure.
- Crossing the zero line may indicate an emerging trend.
- Divergence (for example, price new highs but the oscillator fails to make new highs) may indicate a trend reversal.
Looking at the gold chart with the addition on the Chaikin Oscillator.
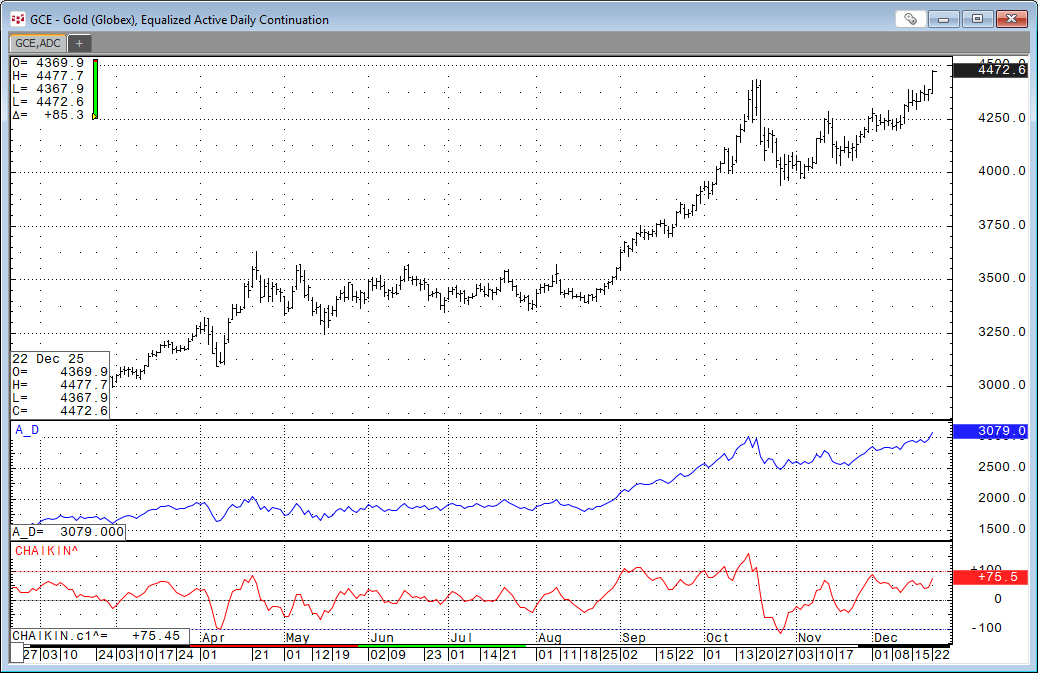
The price breakout of the four month sideways trend in Septemebr was confirmed with the Chaikin Oscillator making new highs.
Viewing the wheat chart with the addition on the Chaikin Oscillator.
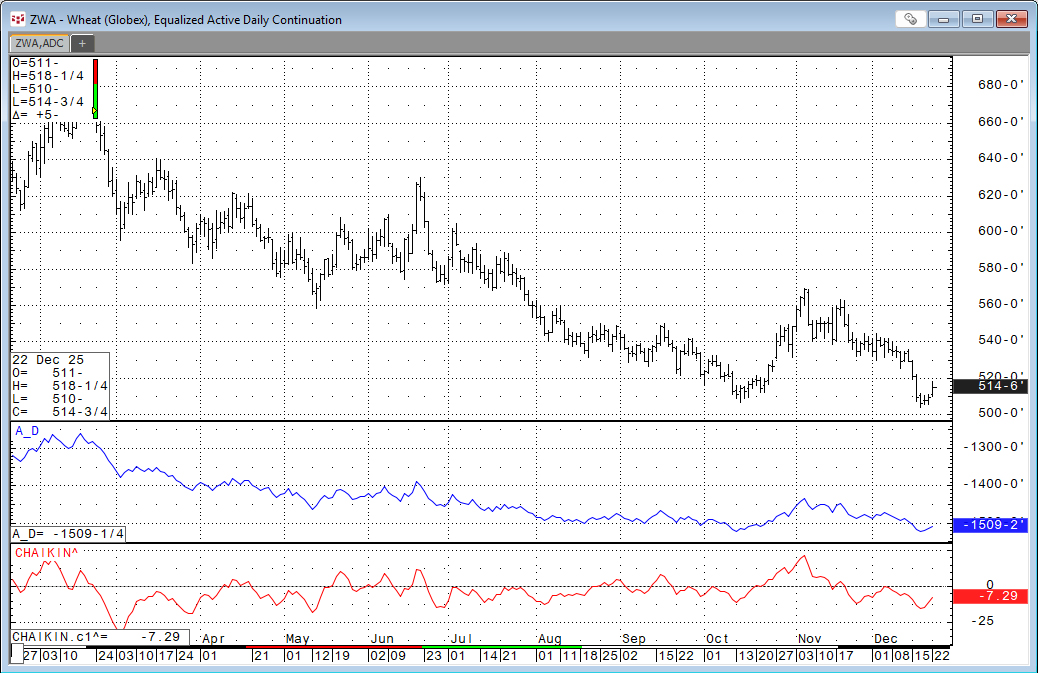
The Chaikin Oscillator was below zero during much of the down trend.
The Chaikin Oscillator is included in the CQG Pac below. A page is installed with four charts for CQG IC or QTrader.
Requires CQG Integrated Client or CQG QTrader.