
This post combines four Excel functions for managing market performance measurements. The market performance measurements are the top ten and bottom ten percentage net changes. The time periods are weekly, monthly, quarterly, and annual views. The markets are the stocks in the S&P 100 Index.
Here are the RTD formulas for each percentage net change (PCB). The Excel IFERROR function is used because the returned value has to be divided by 100 and if there is not a value, such as just before the start of the week, then the cell will be blank instead of the #VALUE! error. The symbols of the stocks in the S&P 100 Index are in column A.
Weekly (column B on the Data tab):
=IFERROR(RTD("cqg.rtd",,"StudyData",$A2, "PCB","BaseType=Index,Index=1", "Close", "W","0","all",,,,"T")/100,"")Monthly (column C on the Data tab):
=IFERROR(RTD("cqg.rtd",,"StudyData",$A2, "PCB","BaseType=Index,Index=1", "Close", "M","0","all",,,,"T")/100,"")Quarterly (column D on the Data tab):
=IFERROR(RTD("cqg.rtd",,"StudyData",$A2, "PCB","BaseType=Index,Index=1", "Close", "Q","0","all",,,,"T")/100,"")Annual (column E on the Data tab):
=IFERROR(RTD("cqg.rtd",,"StudyData",$A2, "PCB","BaseType=Index,Index=1", "Close", "A","0","all",,,,"T")/100,"")On the data tab there is a collection of display blocks for the top and bottom ten percentage net changes by weekly, monthly, quarterly and annual views.
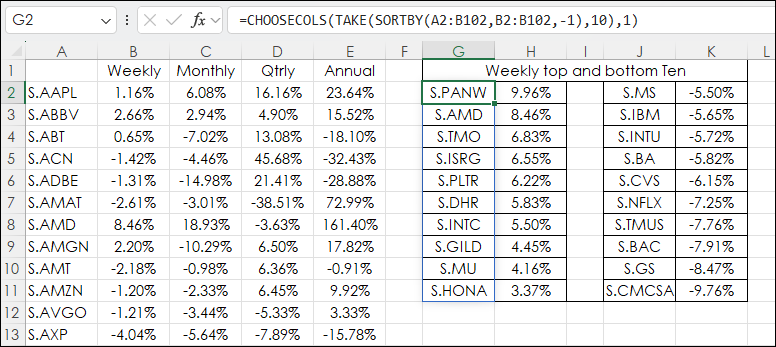
The Excel functions to pull this information are nested. The following is how the functions are nested. First is sorting the symbols (column A) by ranking the weekly percent changes (column B), the negative -1 is descending:
SORTBY(A2:B102,B2:B102,-1)
Next, is “Taking” the top ten:
TAKE(SORTBY(A2:B102,B2:B102,-1),10)
And, last “Choosing Column 1” returns the symbols
=CHOOSECOLS(TAKE(SORTBY(A2:B102,B2:B102,-1),10),1)
To pull in the top ten percentage weekly change values the “Choosing Column 2” is used.
=CHOOSECOLS(TAKE(SORTBY(A2:B102,B2:B102,-1),10),2)
The functions to pull in the bottom ten symbols and weekly percent net changes are similar except the Excel DROP function is used in place of TAKE. The DROP function requires an Array and the number of rows to drop. The number to drop is 91 because the first symbol in column A is cell A2.
SORTBY(A2:B102,B2:B102,-1)
DROP(SORTBY(A2:B102,B2:B102,-1),91)
=CHOOSECOLS(DROP(SORTBY(A2:B102,B2:B102,-1),91),1)
To pull in the bottom ten percentage weekly change to “Choosing Column 2”.
=CHOOSECOLS(DROP(SORTBY(A2:B102,B2:B102,-1),91),2)
This next image is a block on the Display tab for the top ten weekly net percentage change symbols.
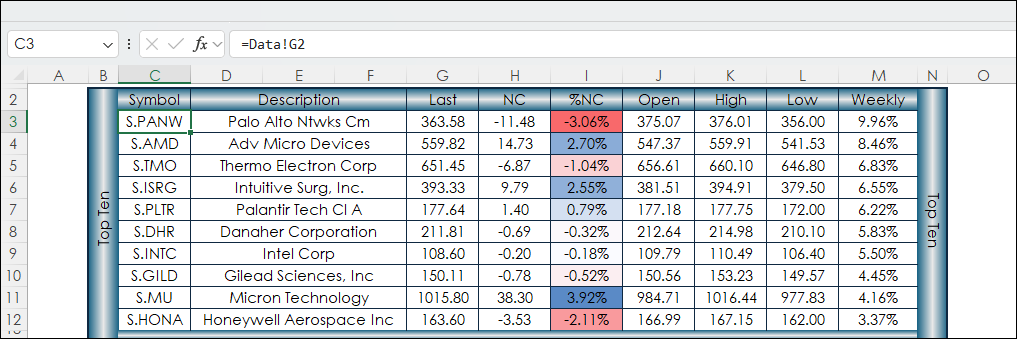
The symbols are in cells C3:C12. Here are the Excel and RTD formulas. The RTD calls are using the parameters in row 2 except the “LongDescription” and the “PercentNetLastTrade” parameters.
    =Data!G2

    =PROPER(RTD("cqg.rtd", ,"ContractData",C3, "LongDescription",, "T"))

    =RTD("cqg.rtd", ,"ContractData",$C3,$G$2,, "T")

    =RTD("cqg.rtd", ,"ContractData",$C3,$H$2,, "T")

    =IFERROR(RTD("cqg.rtd", ,"ContractData",$C3,"PerCentNetLastTrade",, "T")/100,"")

    =RTD("cqg.rtd", ,"ContractData",$C3,$J$2,, "T")

    =RTD("cqg.rtd", ,"ContractData",$C3,$K$2,, "T")

    =RTD("cqg.rtd", ,"ContractData",$C3,$L$2,, "T")

    =Data!H2
The last Excel call above is pulling the value from the Data tab for the weekly percent net change for the symbol in cell C3.
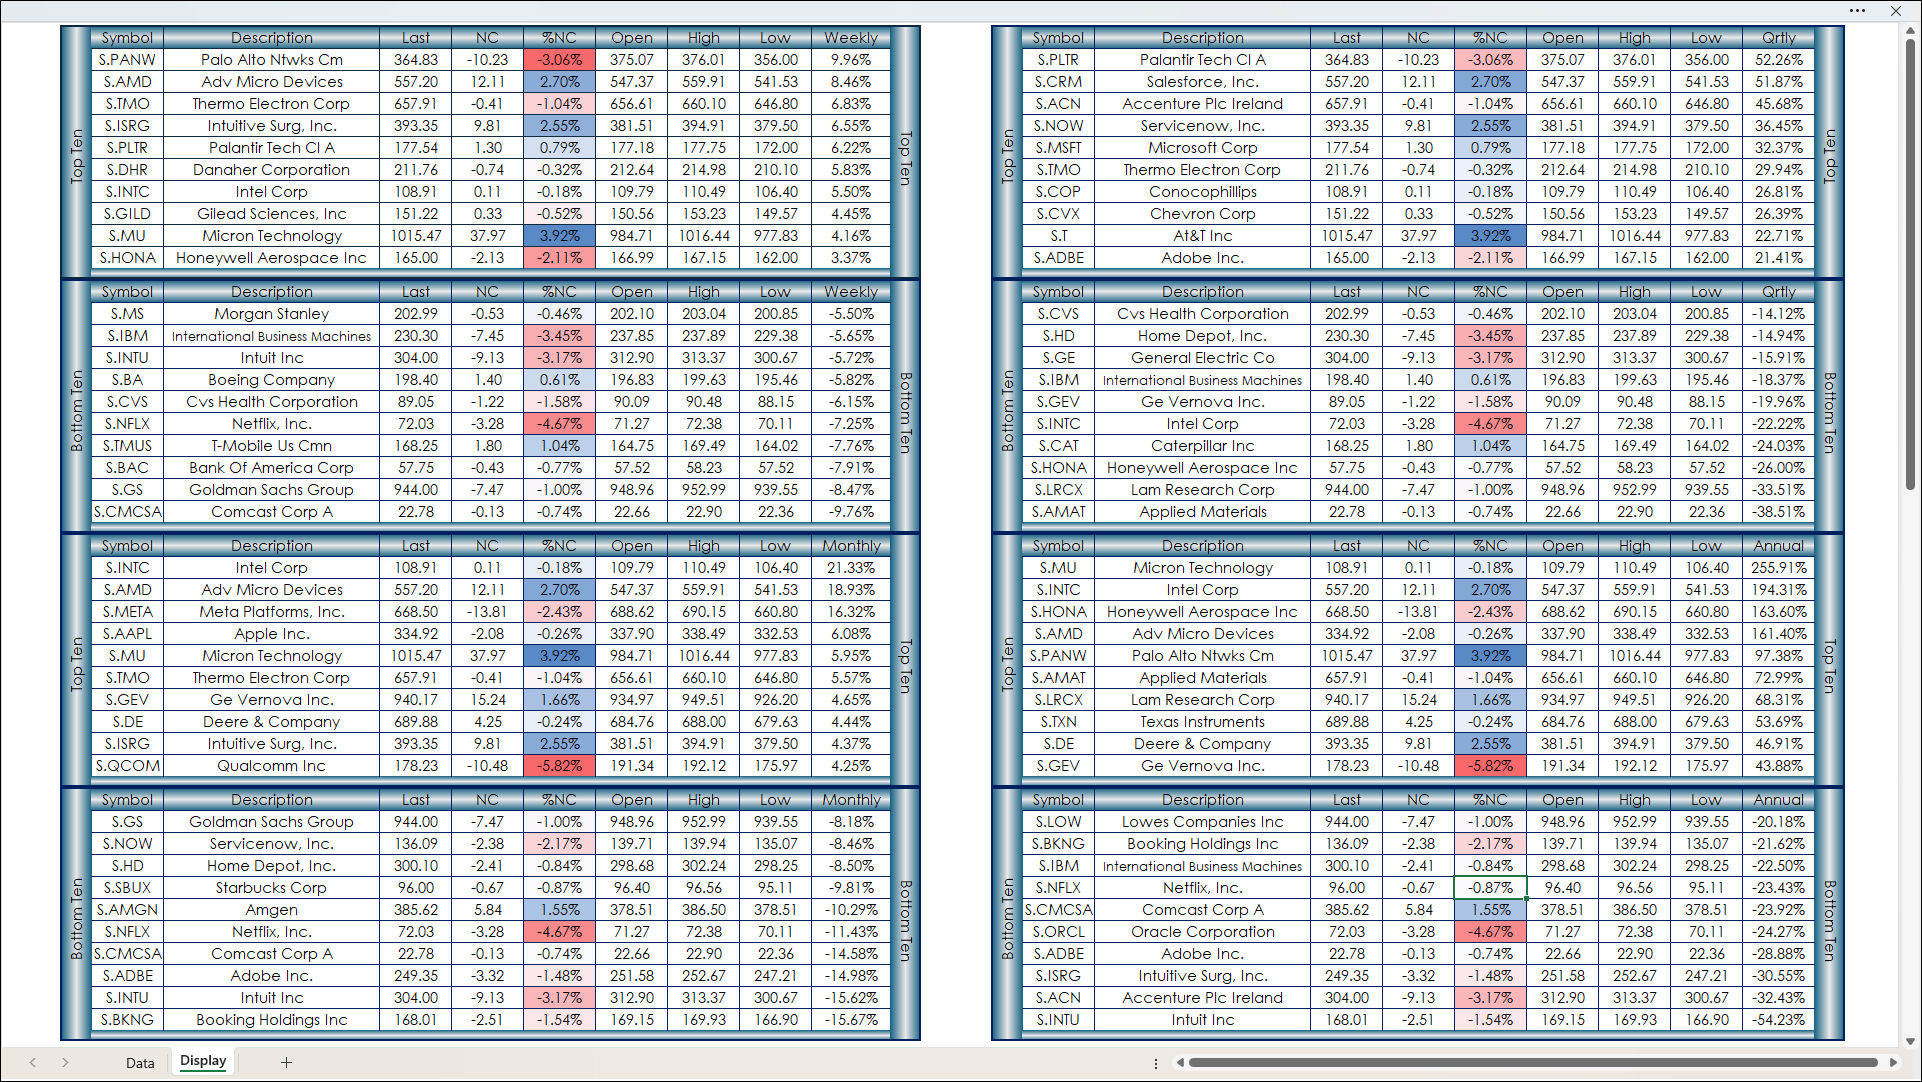
The image below is the Display tab and shows the six blocks grouped by the percentage change in the far right column for each block.
Make sure to lower your Excel Realtime Data (RTD) throttle to 100 milliseconds. Learn how to do that here.
Requires CQG Integrated Client or CQG QTrader, data enablements for the exchanges, and Excel 365 or more recent locally installed, not in the Cloud.