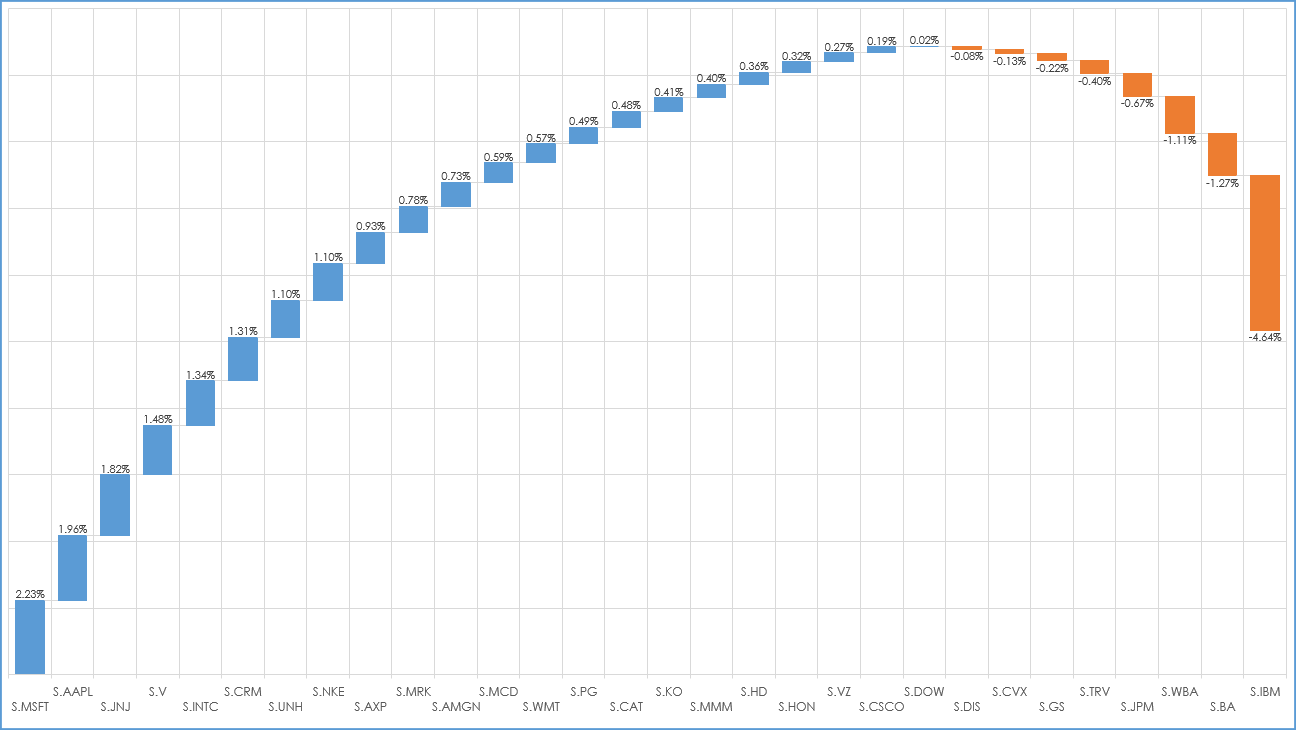
Microsoft® Excel 2016 and higher offers the Waterfall Chart. The Waterfall Chart is also known as a bridge chart or a cascade chart. Typically, this kind of chart is used to see how positive or… more
Equity
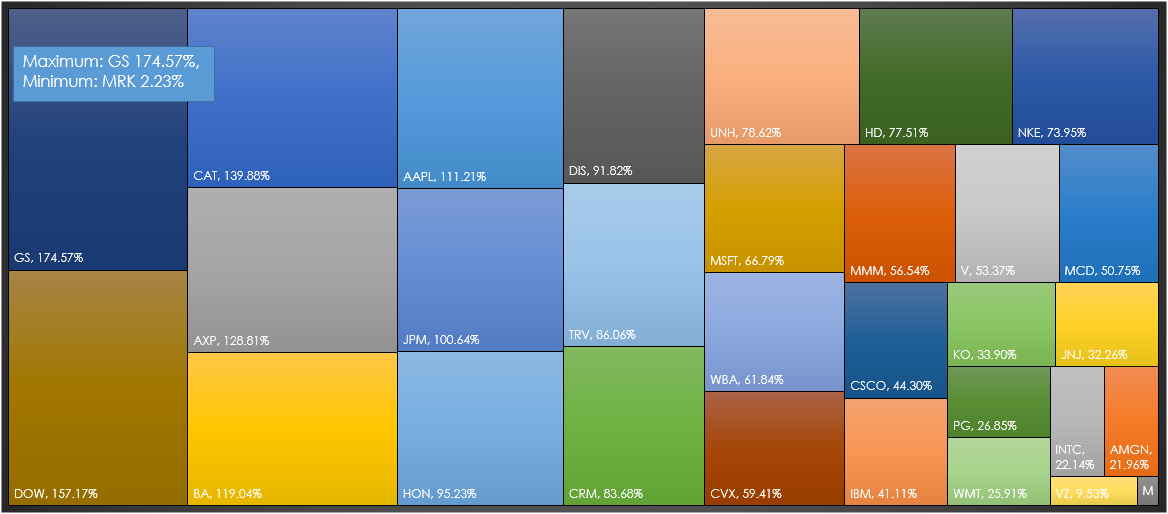
Microsoft® Excel 2016 and higher offer a new chart type: The Treemap. A treemap chart provides a hierarchical view of your data. This view makes it easy to spot patterns, such as which markets are… more
This article builds upon the post titled “Evaluate ETF Constituents Performance Using Excel” that detailed gauging the current price of a stock relative to the high as an indication of relative… more
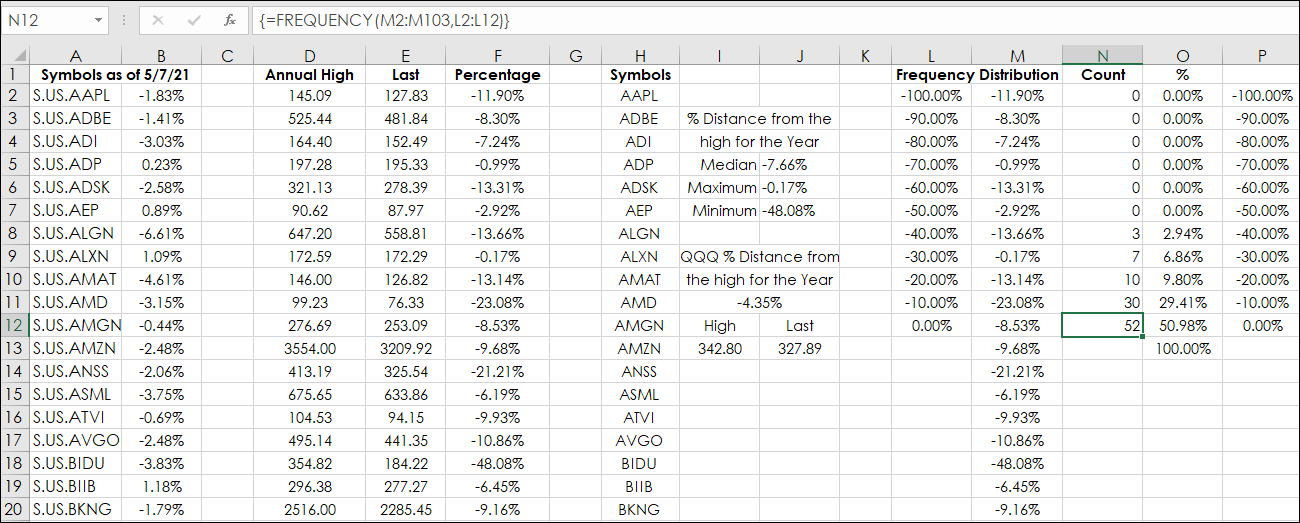
If you track the performance of ETFs you may be interested in evaluating the performance of the stocks that are held by the ETF, such as the Invesco QQQ ETF, which tracks the Nasdaq-100 Index. Two… more
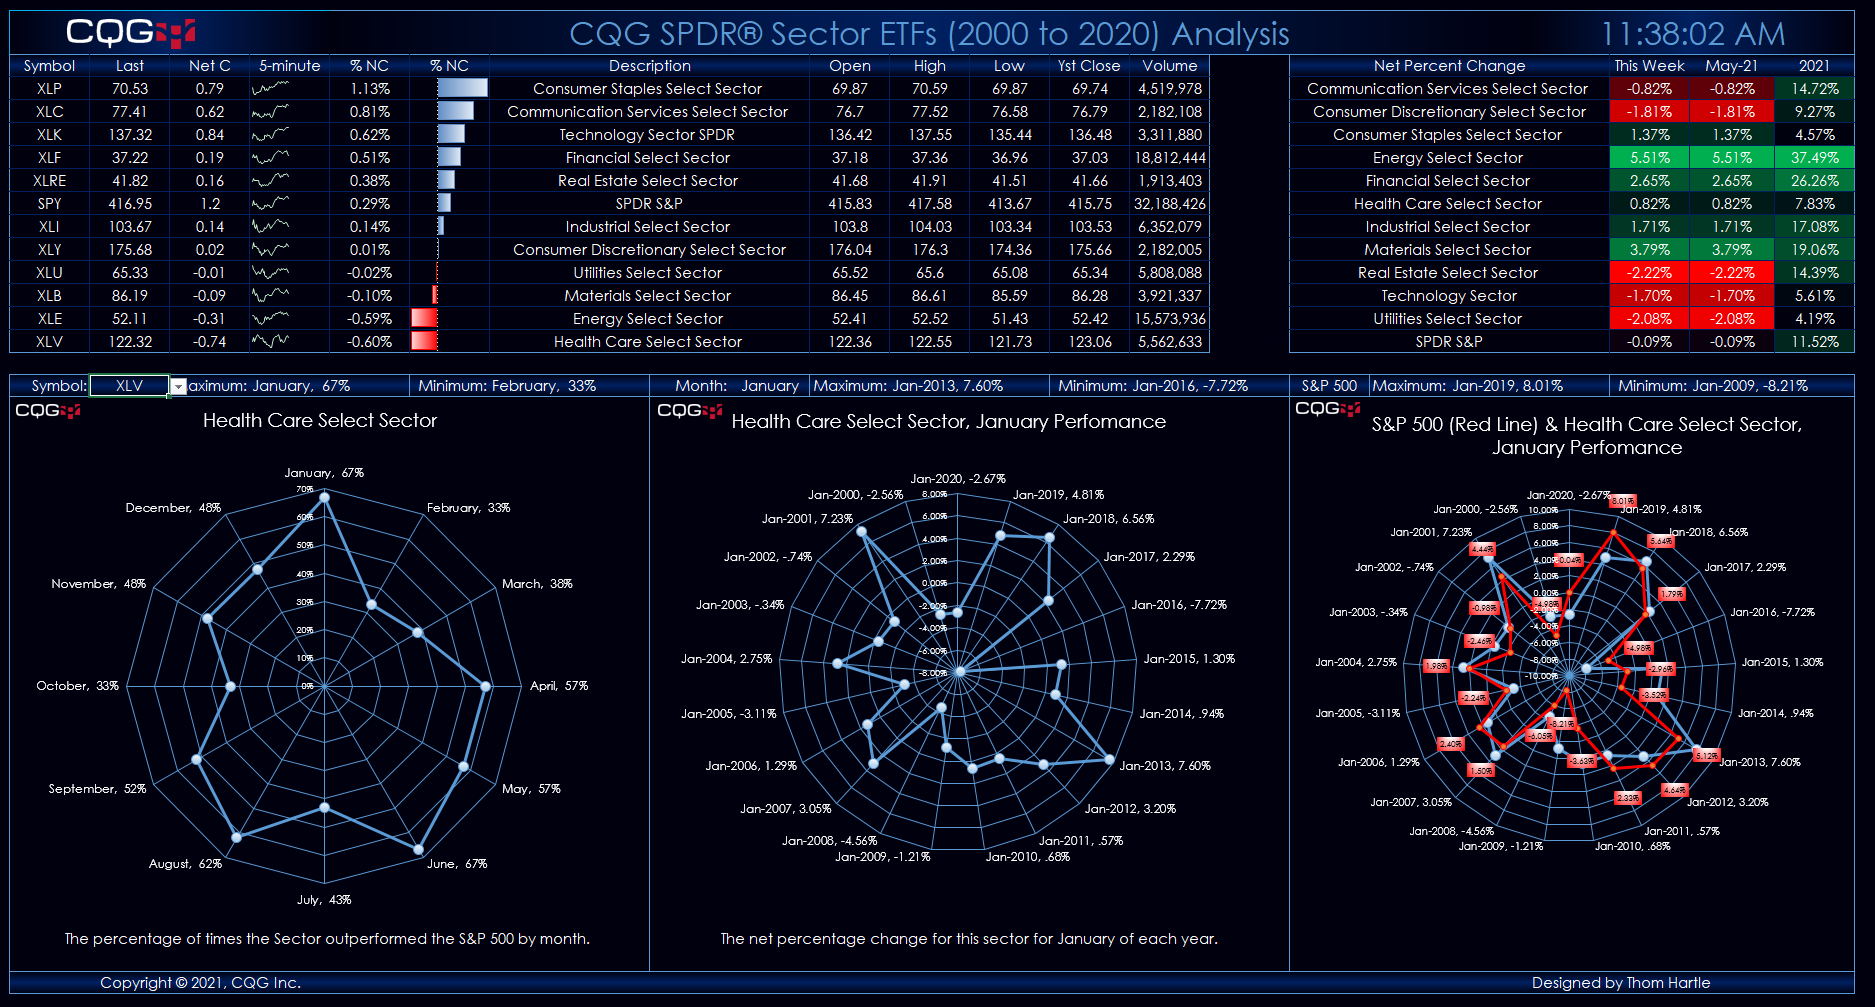
SPDR® Sector ETFs Analysis Dashboard This Microsoft® Excel dashboard provides analysis of S&P Sectors based on ETFs. The collection of ETFs are:
Symbol Description XLC Communication… more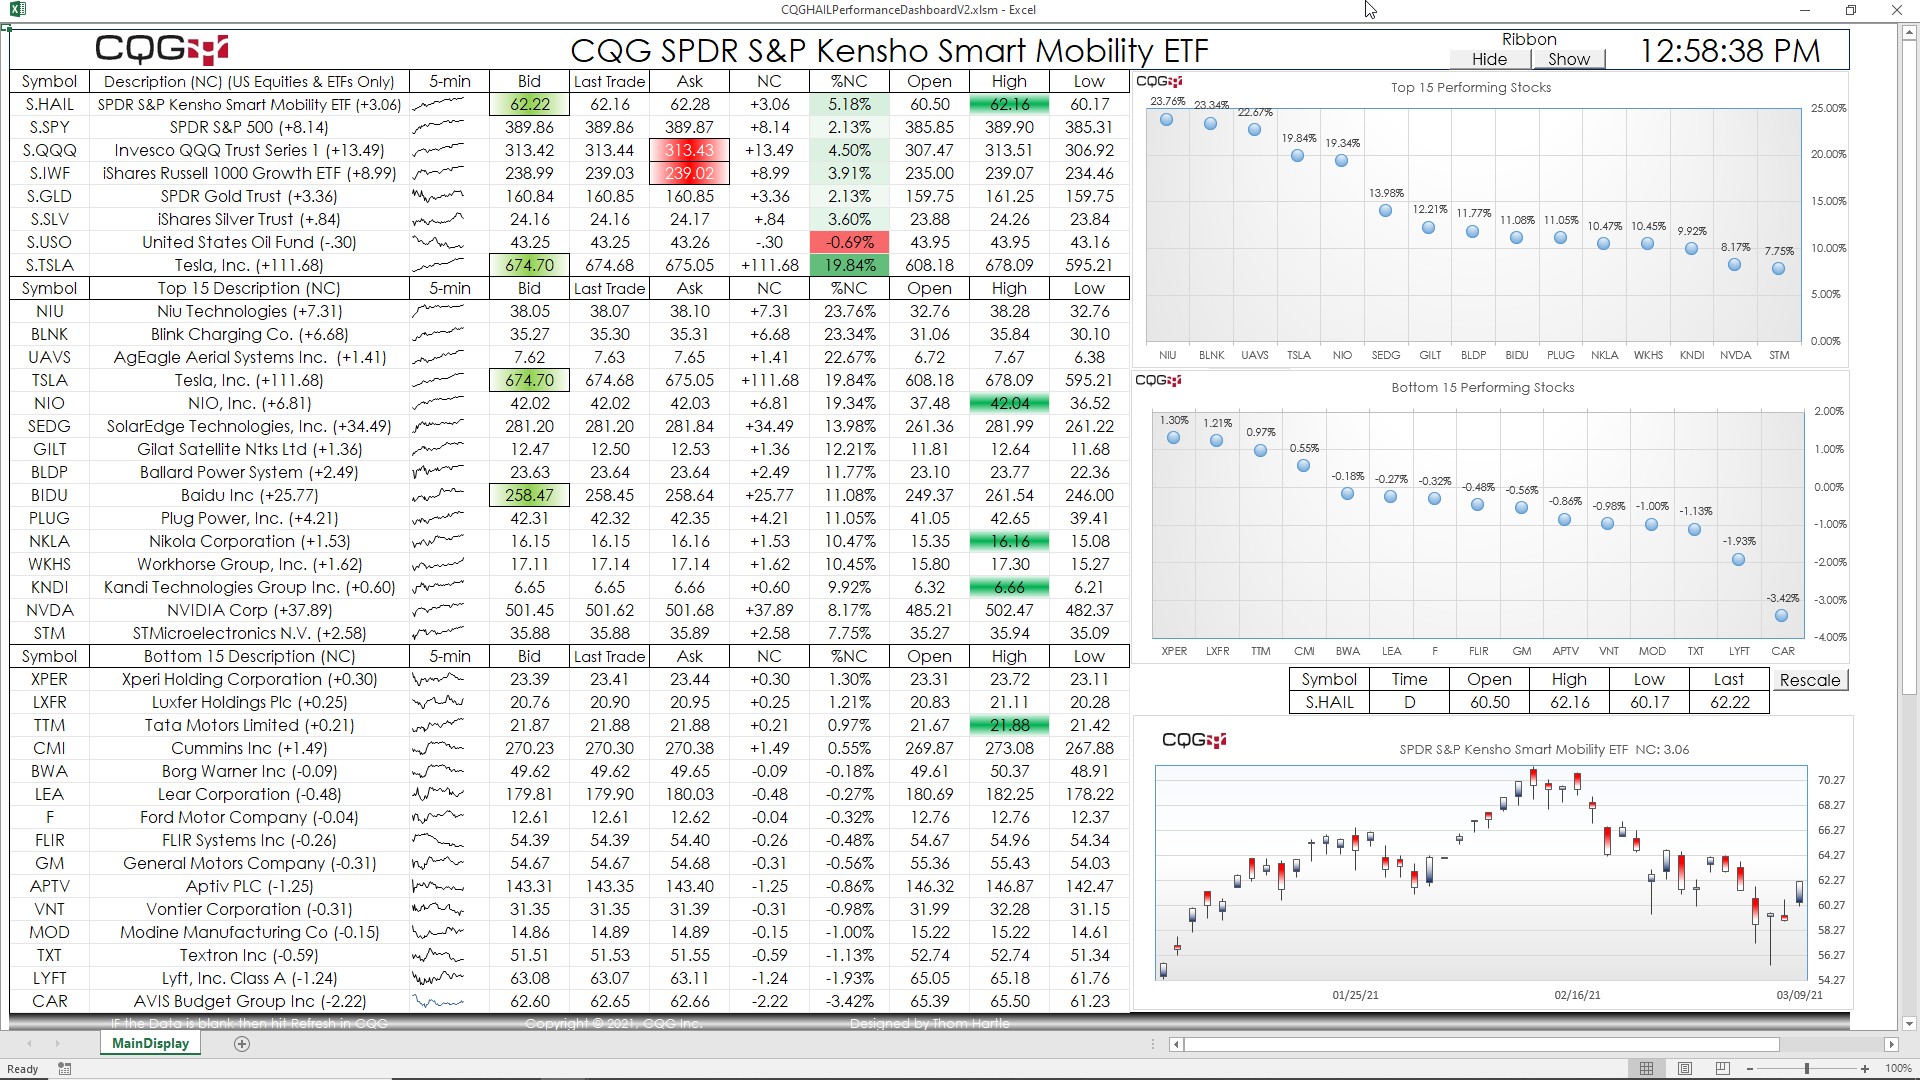
Traders and investors have a multitude of opportunities for theme investing. That is, ETFs are structured to invest in companies that are part of an industry, such as Biotech, Internet, Aerospace… more
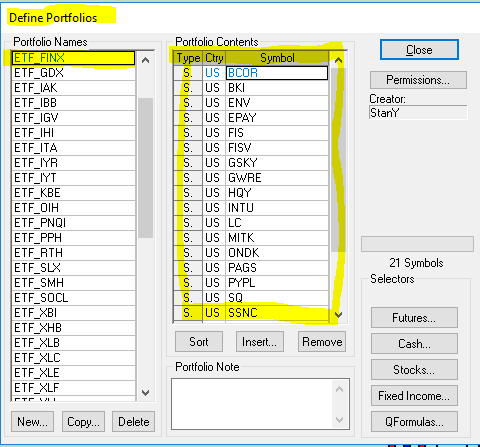
The pac files available below for download represent equity sectors. ;Each sector is composed of specific Exchange Traded Funds (ETF). Each EFT contains a portfolio of the individual equities that… more
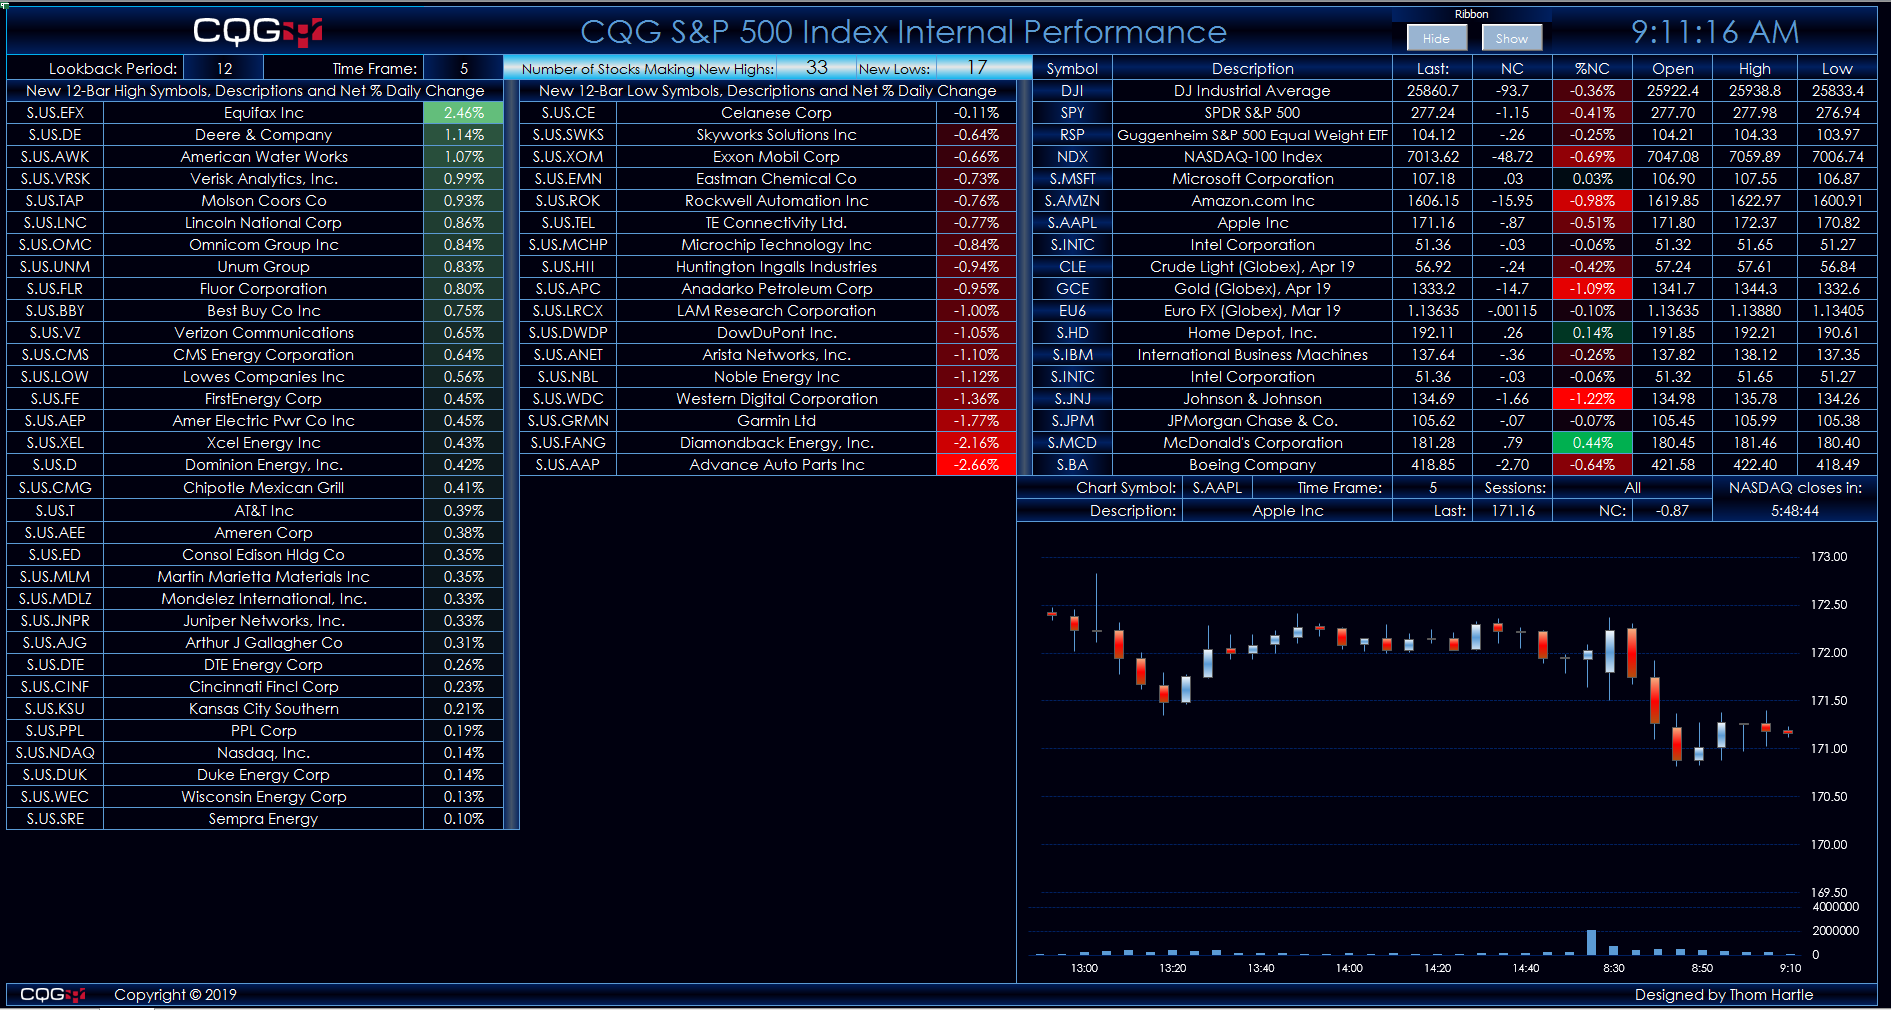
This Microsoft Excel® dashboard tracks the 506 stocks in the S&P 500 index using CQG’s Level function. The Level function plots two lines, which identify the highest and lowest price levels… more
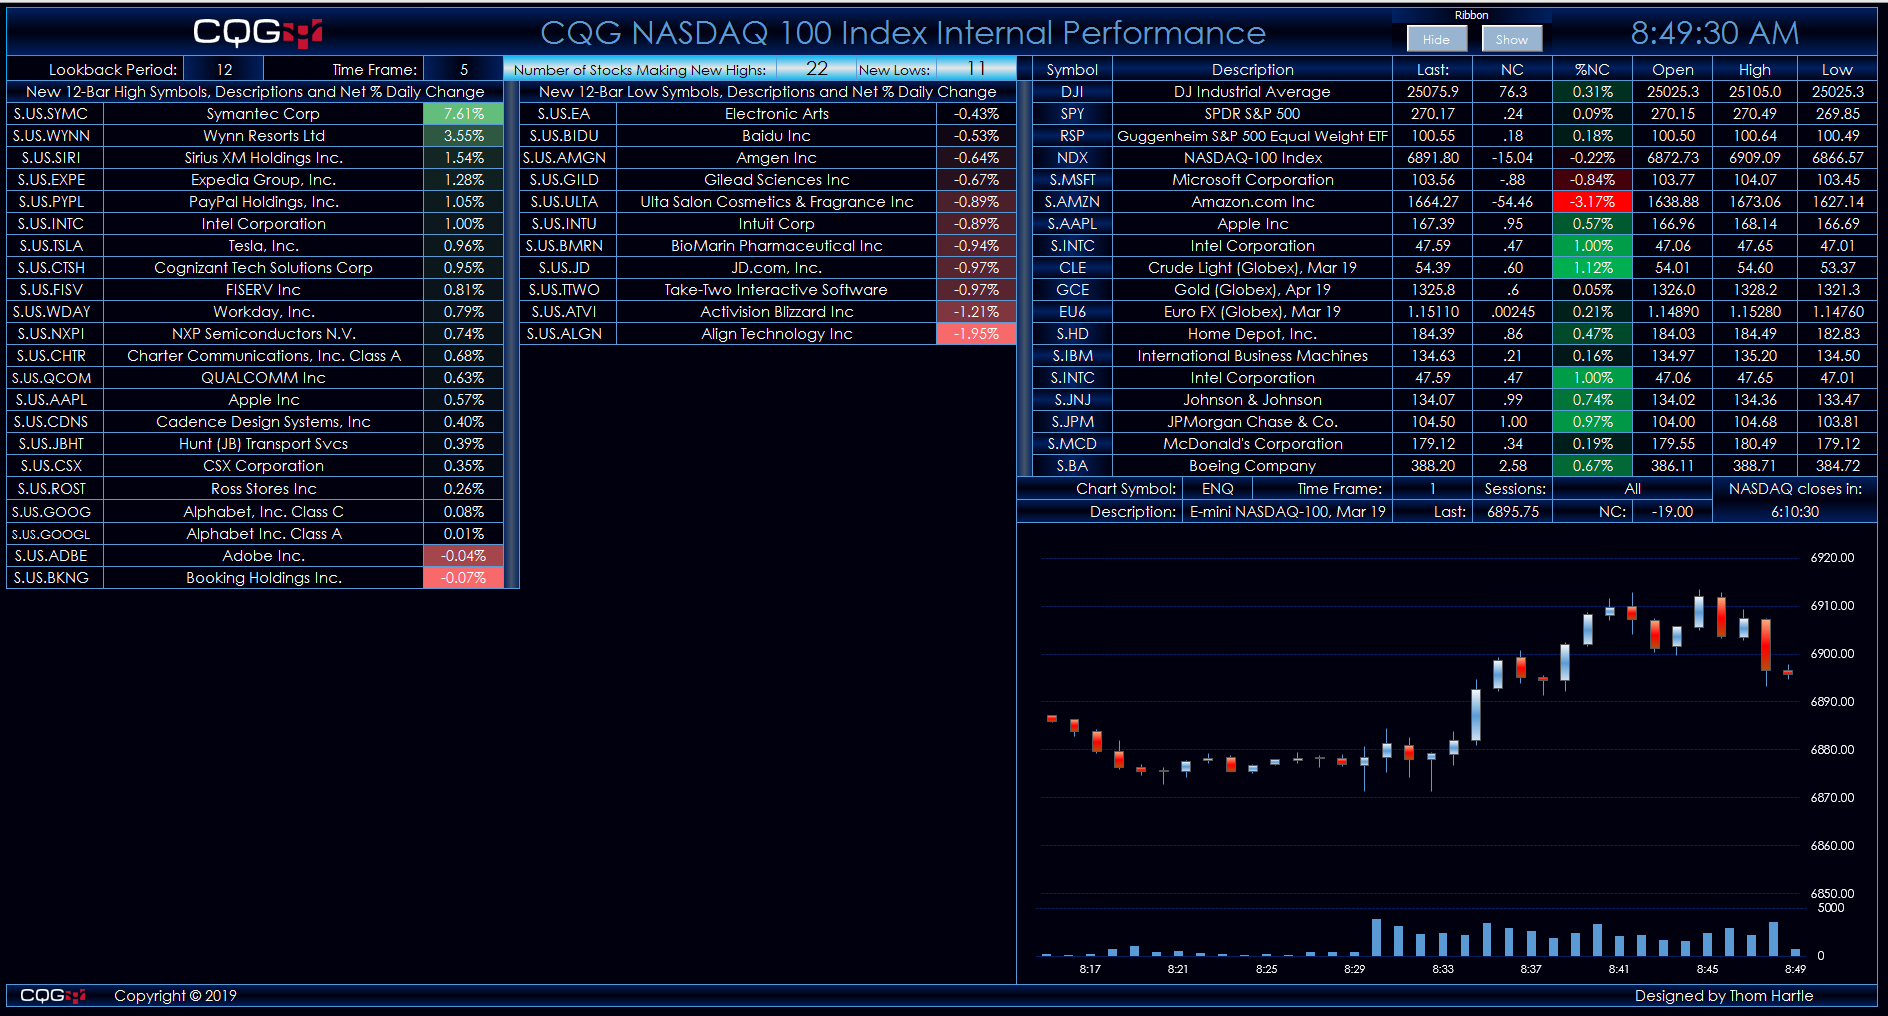
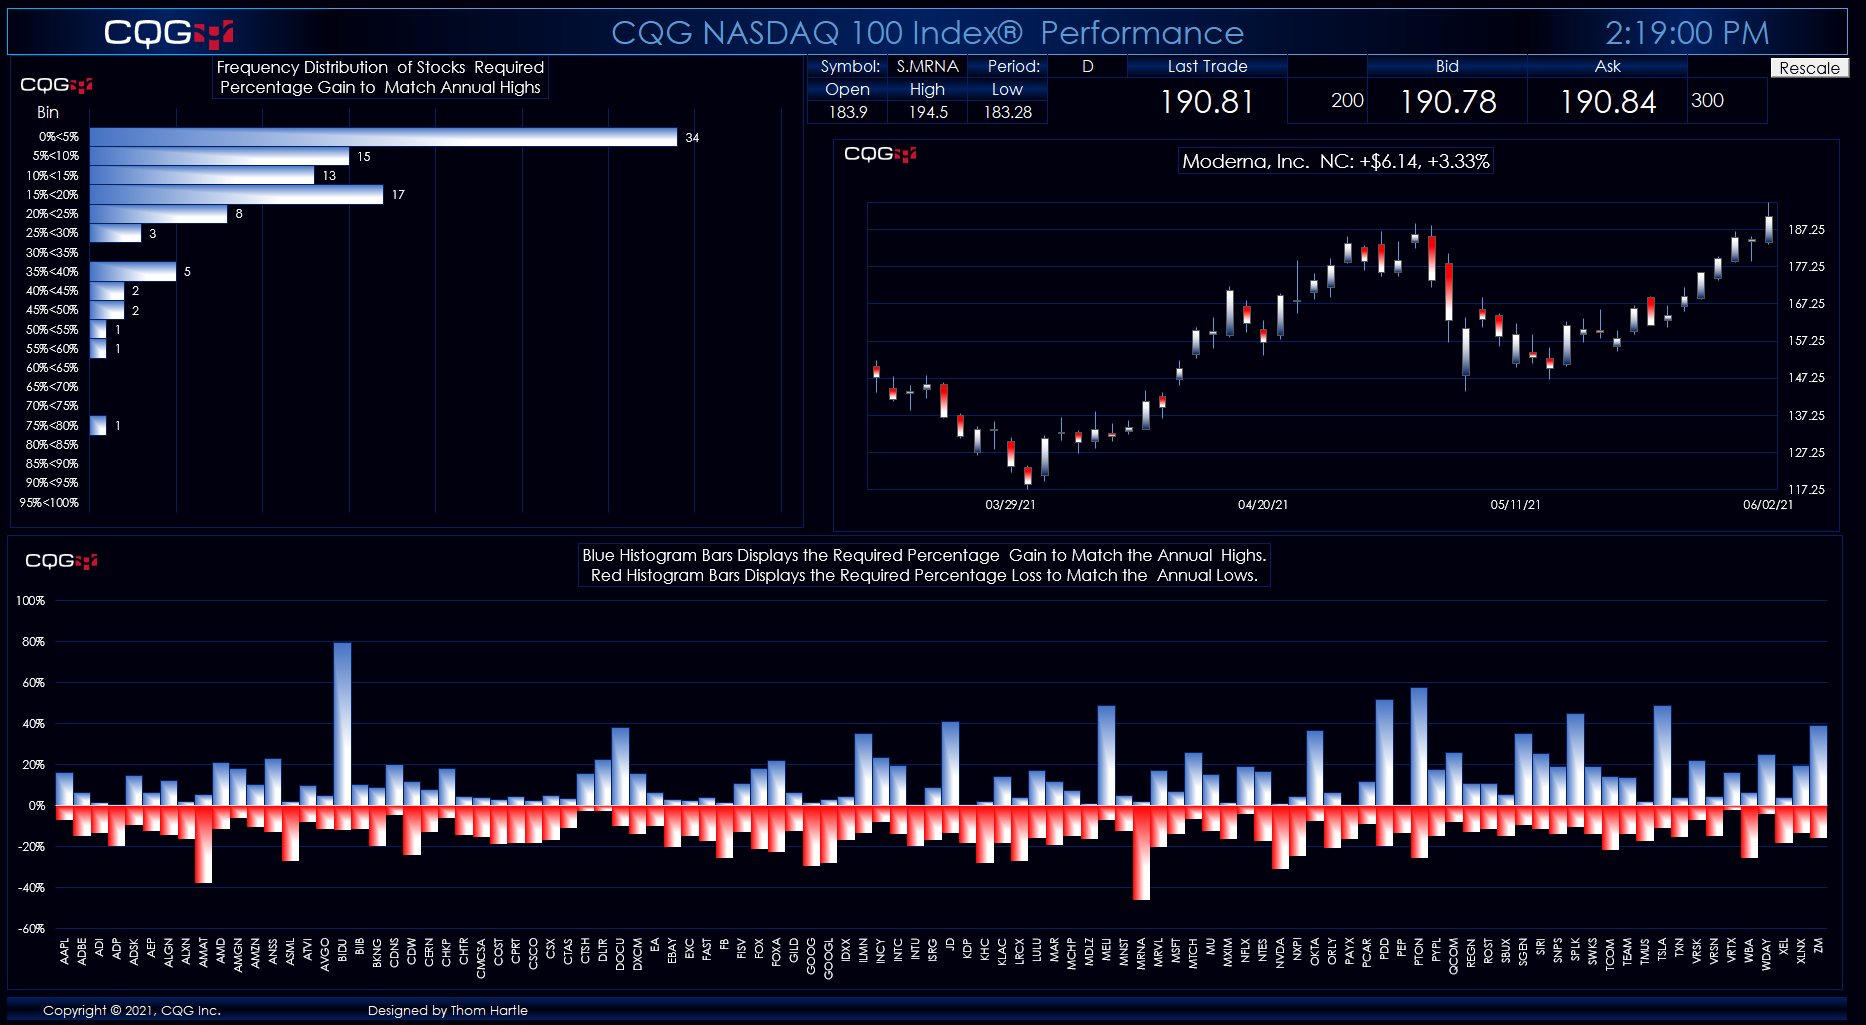
This Microsoft Excel® dashboard tracks the 104 stocks in the Nasdaq-100 index using CQG’s Level function. The Level function plots two lines, which identify the highest and lowest price levels… more
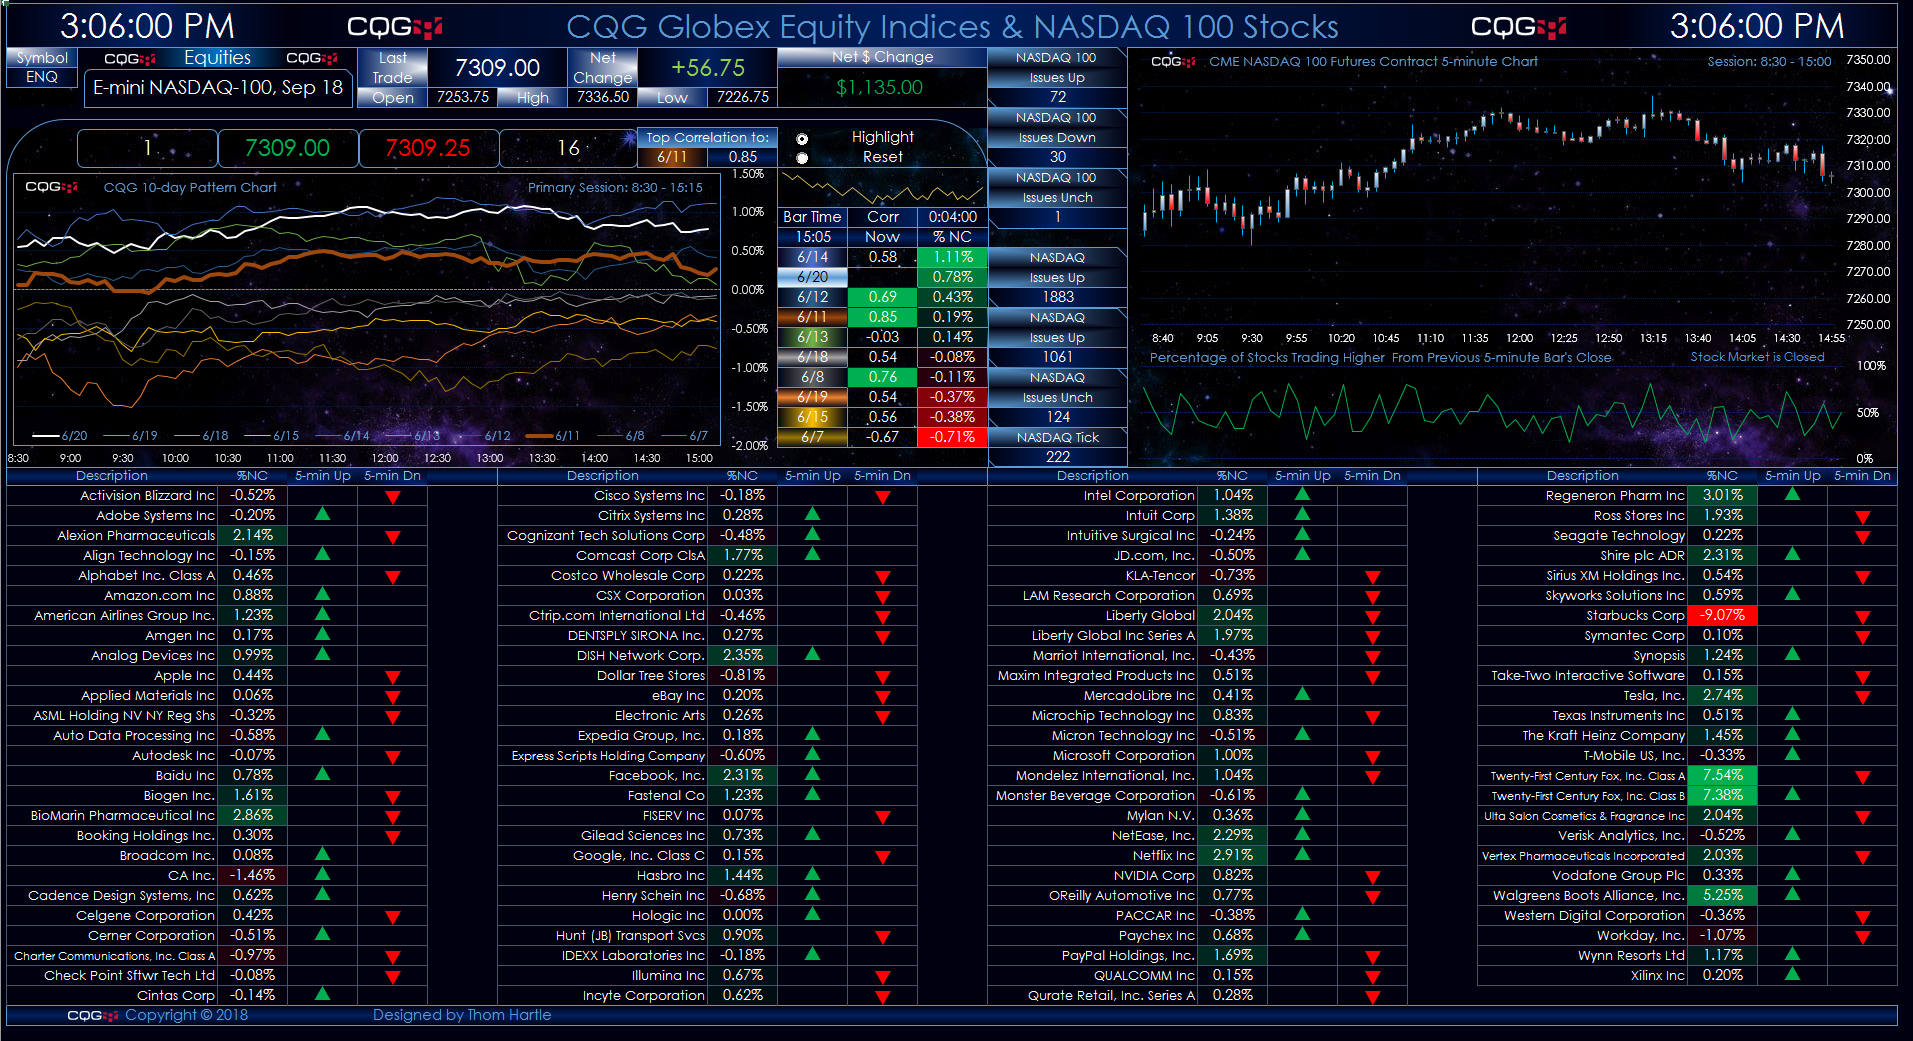
This Microsoft Excel® dashboard presents two charts of the Nasdaq-100 futures contract and market data for the one hundred stocks that are constituents of the Nasdaq 100 Index.
… more