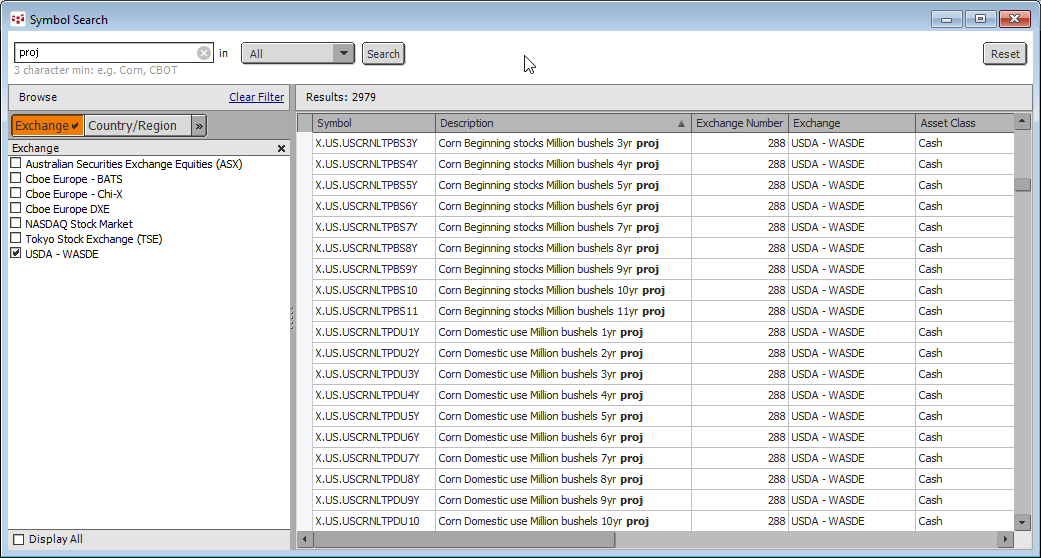
CQG's Data Quality team has added USDA WASDE Long-Term Projections to the data base. This data is published each February and the report provides projections for the agricultural sector out eleven… more
Workspaces
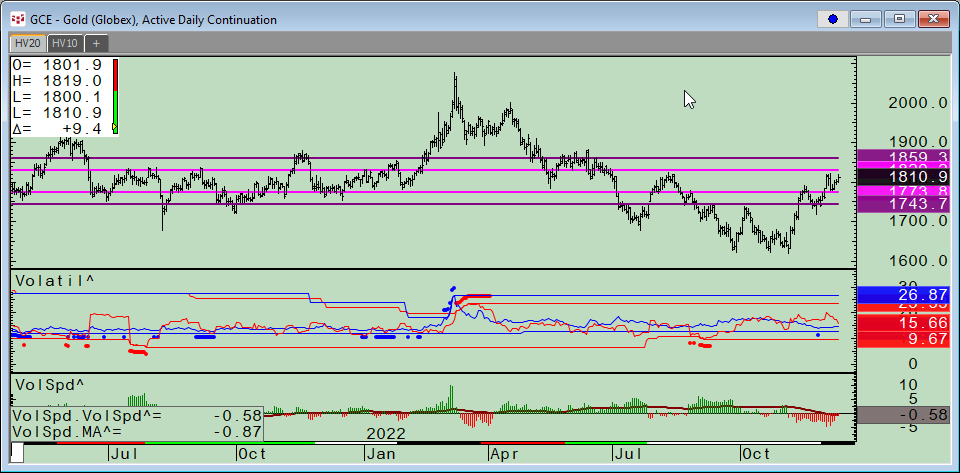
CQG Product Specialist Stan Yabroff designed a CQG page for customers to track and analyze a market’s implied volatility and historical volatility. This post details the features and functionality… more
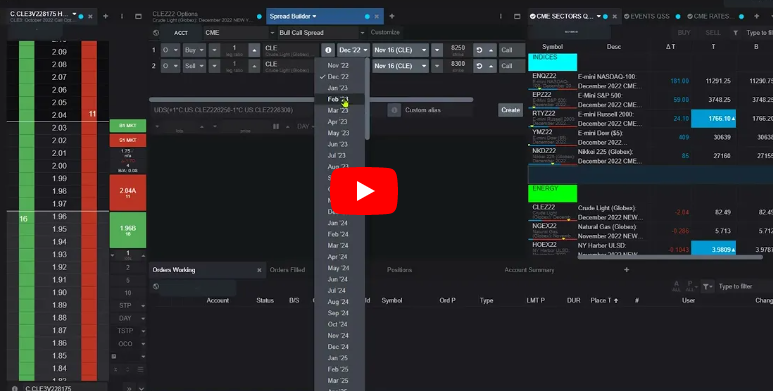
CQG One, the next generation flagship trading and data visualization product for the financial markets now offers the Spread Builder and User Defined Strategies (UDS).
Watch this video to… more
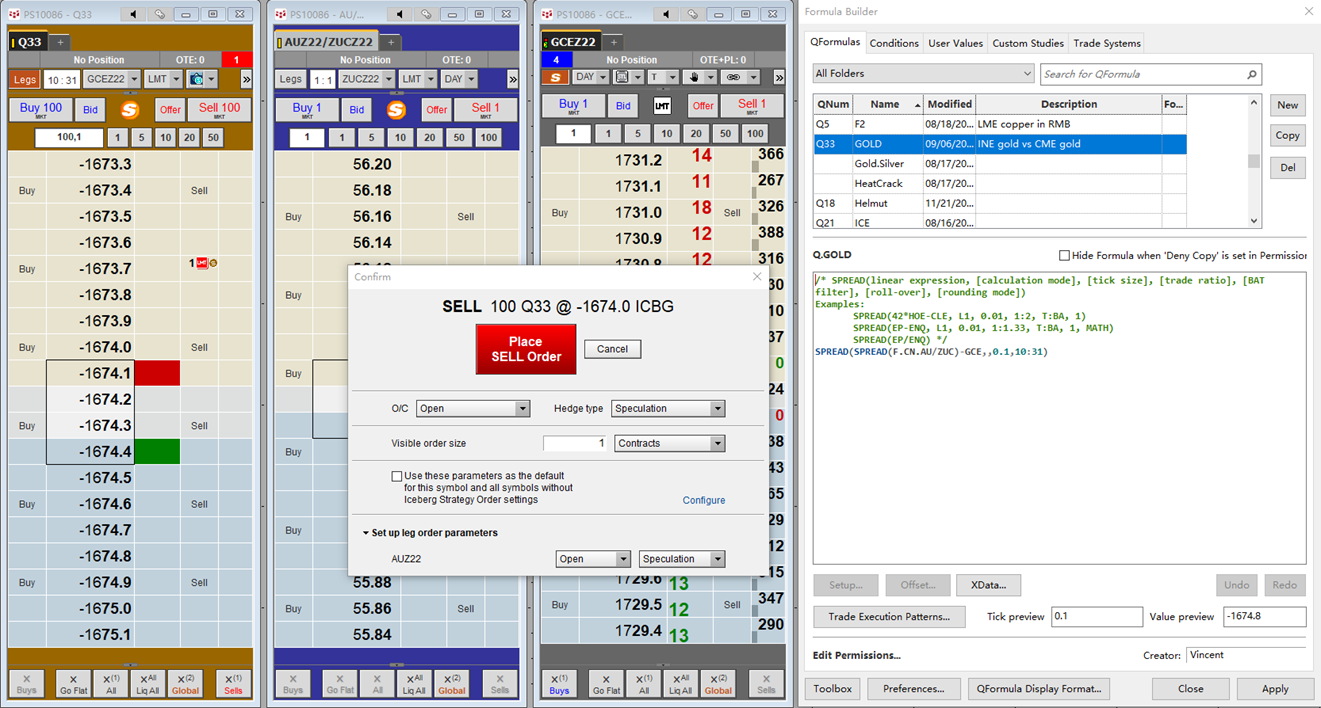
Shanghai Futures Exchange (SHFE) has announced approval for participation of Qualified Foreign Institutional Investors (QFII) and RMB Qualified Foreign Institutional Investors (RQFII) in commodity… more
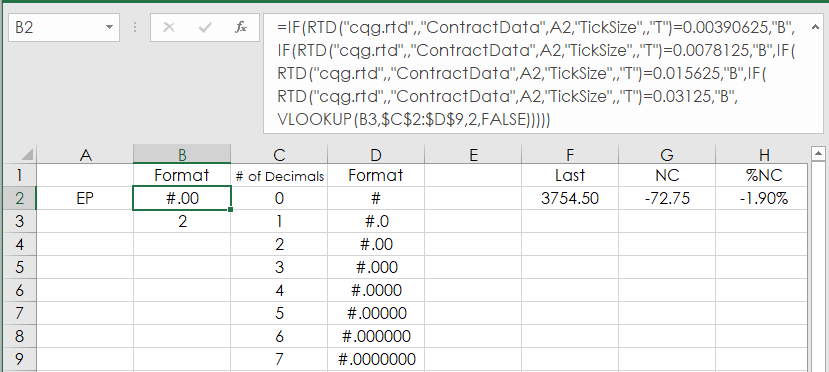
When using RTD functions in Excel to pull in market prices you have to manually format the prices. Excel does not know that the E-mini S&P 500 price has two decimals places (i.e. 3909.25) and… more
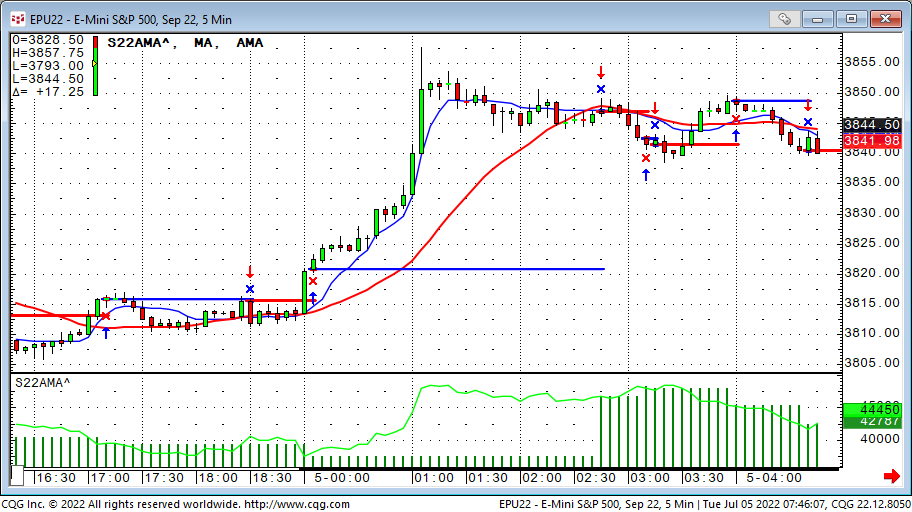
In July 2022 CQG Product Specialist Helmut Mueller updated his Super Template, which is a sample trading system ready to run that has a long and short entry, and many programmed different exits.… more
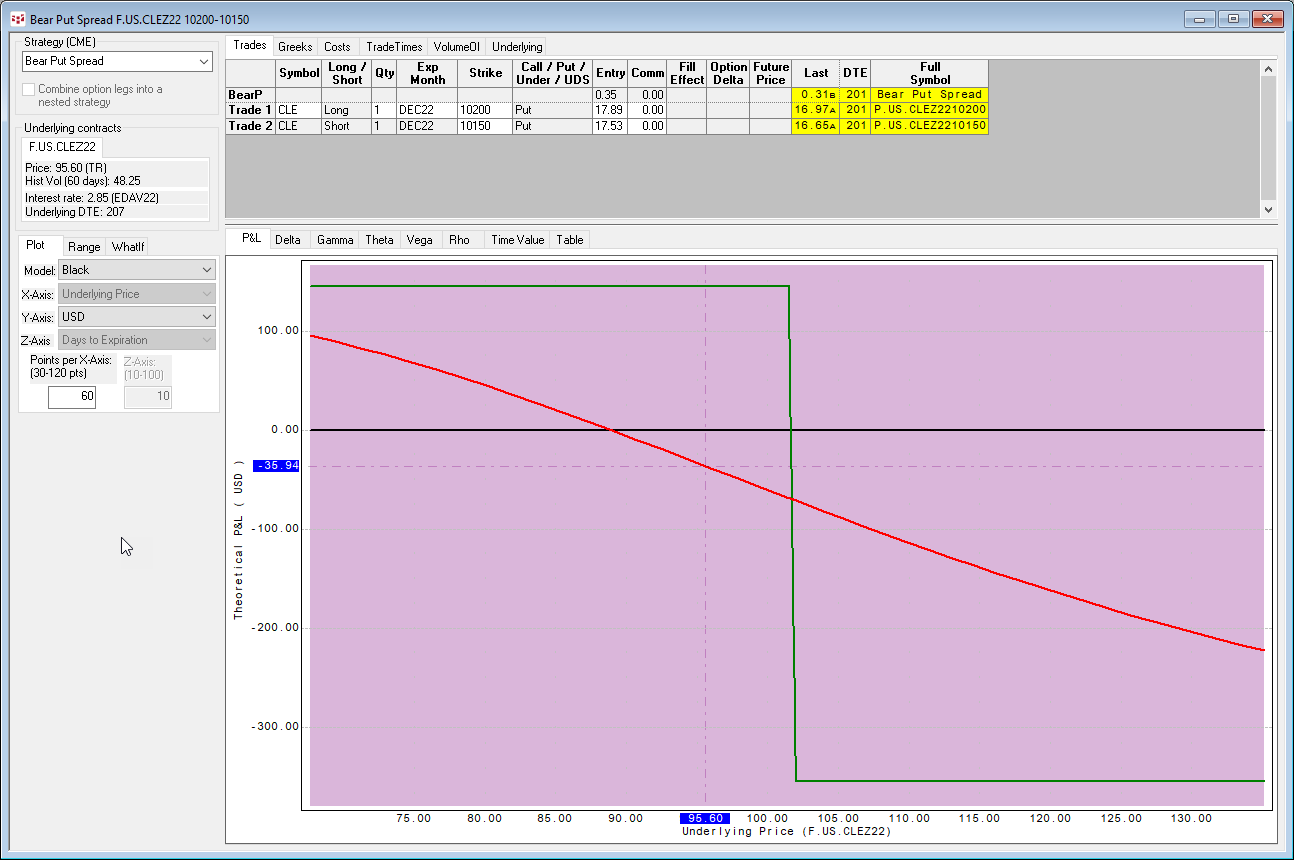
The UDS functionality in CQG Version 2022 has been significantly updated with many more strategies, as well as the available strategies are now grouped by exchanges. This post introduces UDS… more
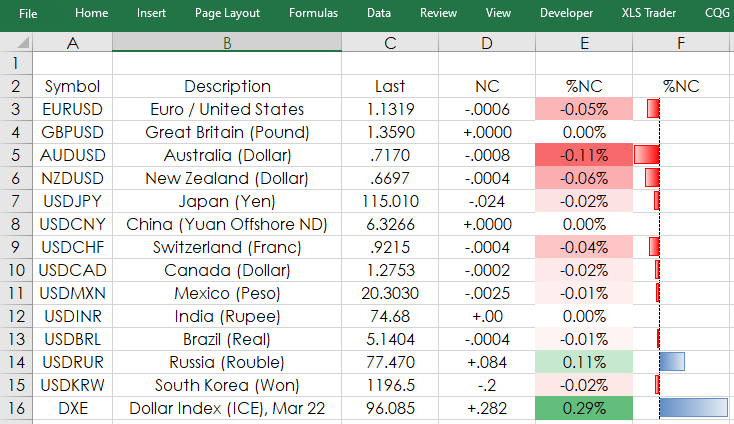
Microsoft Excel spreadsheets have functionality to format cells based on conditions. This feature is also referred to as data visualization. This post details two types of data visualizations… more
The BarInt function can be useful when creating Custom Studies or Conditions which can be applied to different timeframe but where a point of reference may be different whether you are looking at… more
One of the simplest examples for this function is to find out whether a value is an even number.
Modulus (Close(@),2) = 0In other words, the result of the formula above would give us the… more