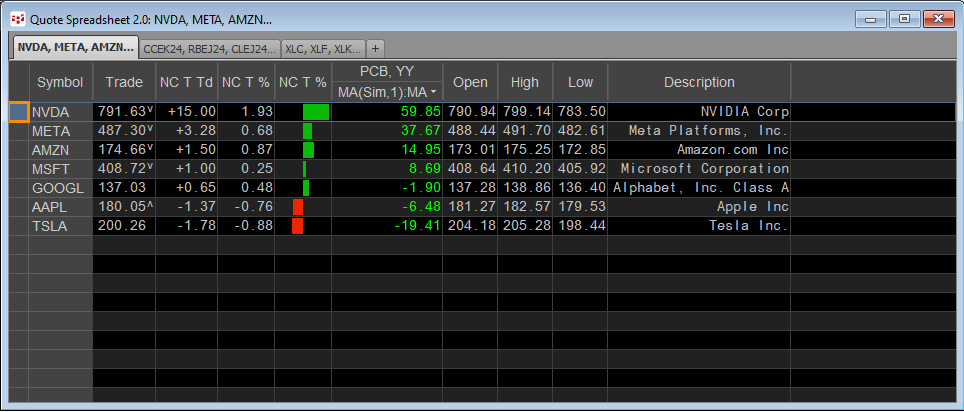
A popular form of market analysis is to maintain a real-time table of market performance based on an annualized basis. For example, the QSS 2.0 displayed below has a sorted column highlighted with… more
Workspaces
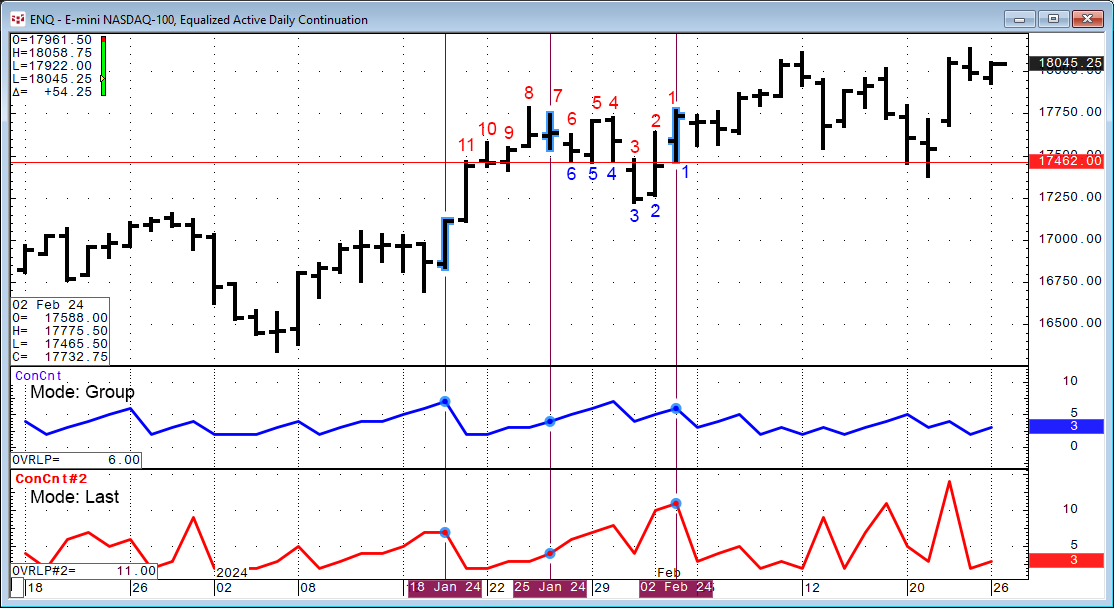
Markets tend to trend up, down, and sideways. Another name for trending sideways is congestion. A period of congestion is when the Open, High, Low, and Close price bars are overlapping. CQG IC and… more
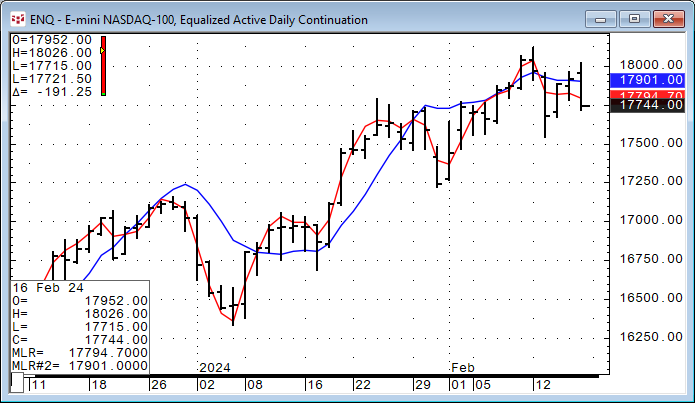
This study goes by a number of other names, including the end point moving average, least squares moving average, moving linear regression, and time series forecast.
To explain this study… more
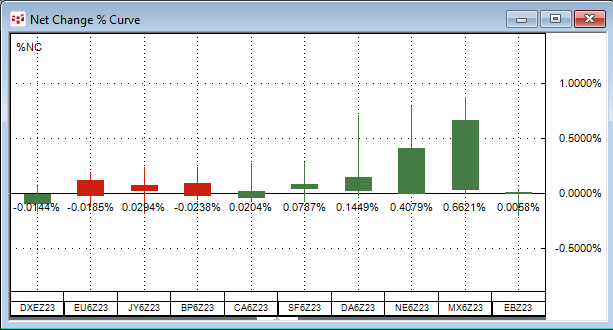
The Net Change Curve chart displays a collection of symbols’ daily net price change or daily net percentage change making it easy to compare on a relative basis each market’s current session’s… more
CQG One provides an "Active RFQ" widget. A Request for Quote (RFQ) is functionality provided for traders to access electronic quotes on multi-leg options strategies. It is an electronic message… more
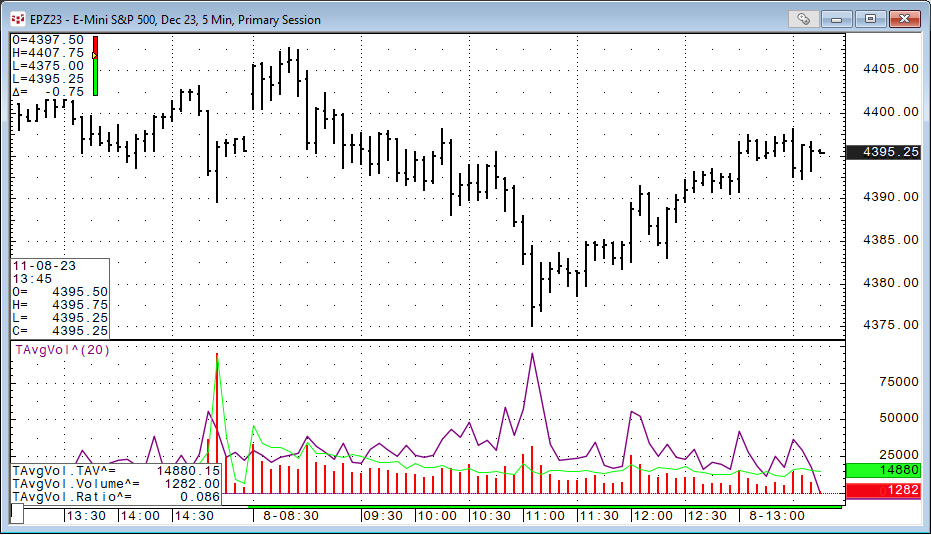
This post details the use of the CQG function: Time Average (TimeAvg), which calculates the average for values taken at the same time of day over the lookback period.
In this example, the… more
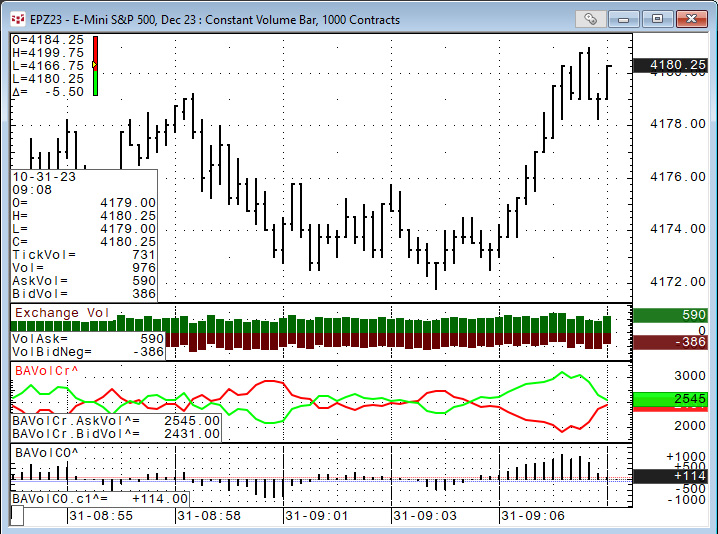
CQG IC and QTrader offer charts that utilize volume for the horizontal scale, not time. The first chart type to discuss is Constant Volume Bars.
Constant Volume Bar (CVB)
The Constant… more
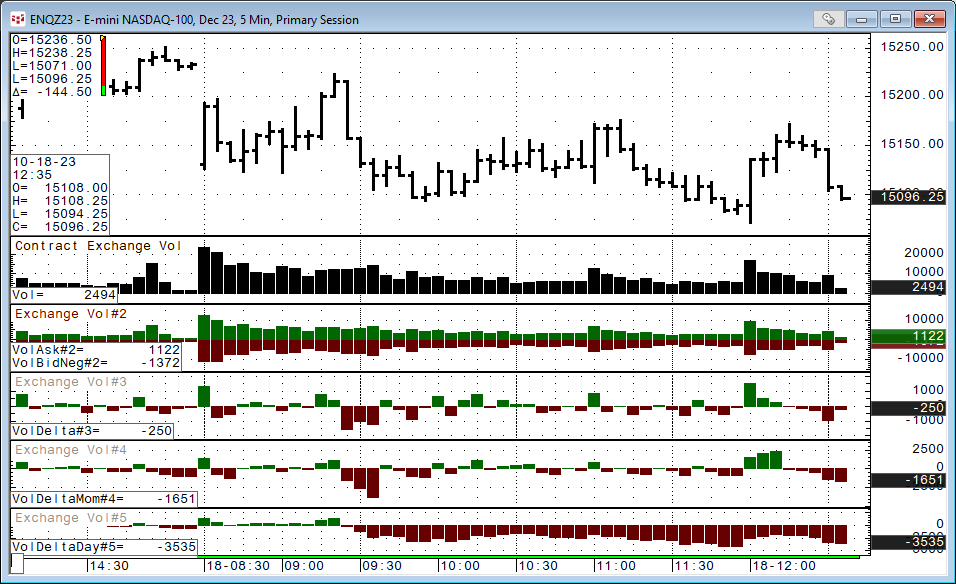
There are a number of volume-based studies available to customers using CQG IC or QTrader. This post walks you through the basic details of the various studies, then correlation analysis is… more
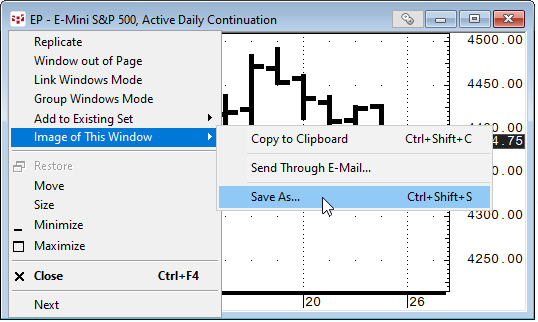
If you are an analyst, blogger, or simply want to post a screen capture of an IC or QTrader chart on social media then the steps to copying a screen capture to your clipboard are very easy.
… more
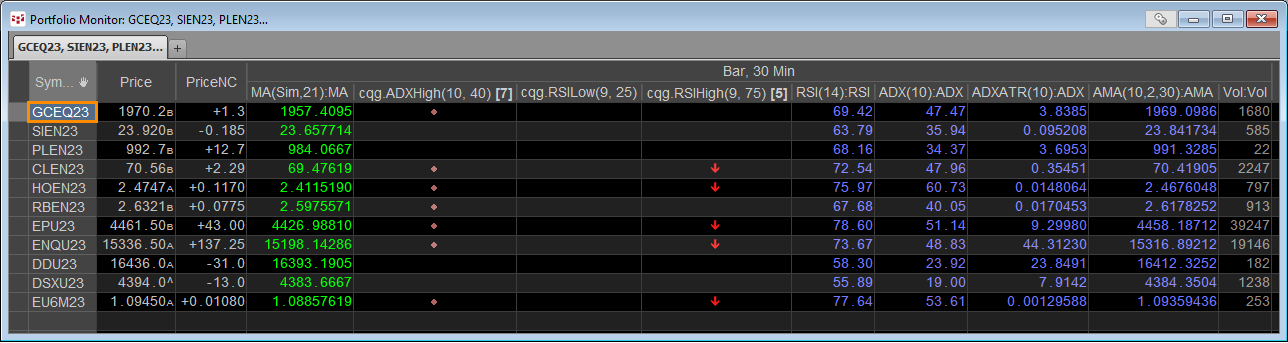
The Portfolio monitor is a combination market quotes and study values display. In addition, the Portfolio monitor can display the status of conditions, such as a study has hit an overbought level… more