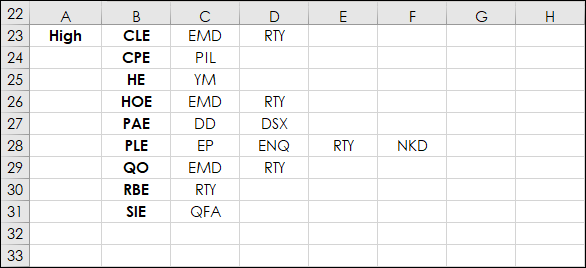
This post details how to extract data from a large array, such as a correlation matrix, to make your workflow more efficient.
First, as the LAMBDA function is used, a brief overview is… more
This post details how to extract data from a large array, such as a correlation matrix, to make your workflow more efficient.
First, as the LAMBDA function is used, a brief overview is… more
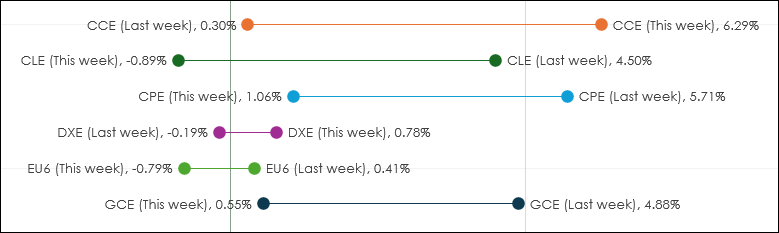
Dumbbell charts have the name due to the look of the data displayed having the appearance of a dumbbell.
In other words, a circle at each end connected by a line. In the image above… more
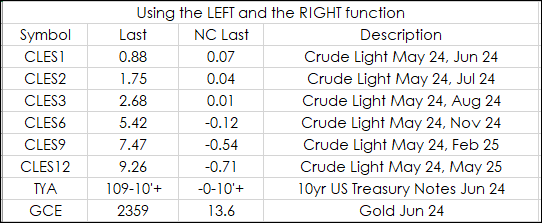
This post offers solutions to parsing data in Excel using string functions. As an example, this RTD formula returns the long description of a Crude Oil calendar spread:
=RTD("cqg.rtd", ,"… more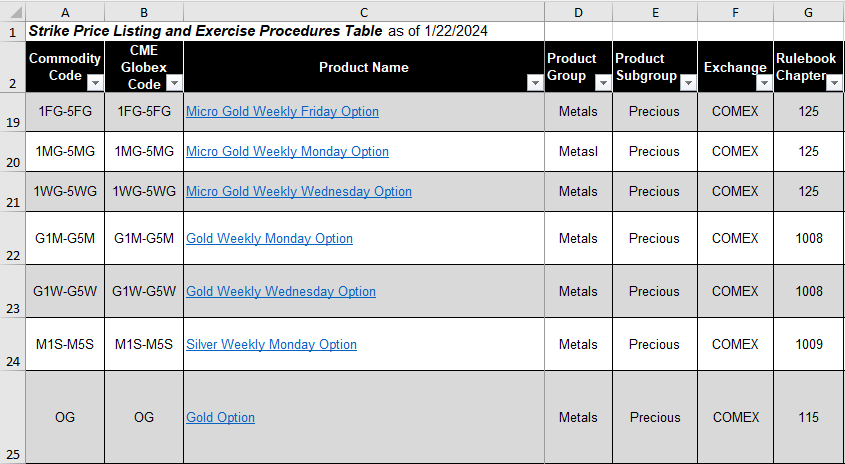
The CME Website has information resources for options traders in the form of downloadable Excel tables with important needed details such as:
Commodity CodeCME Globex CodeProduct NameProduct… more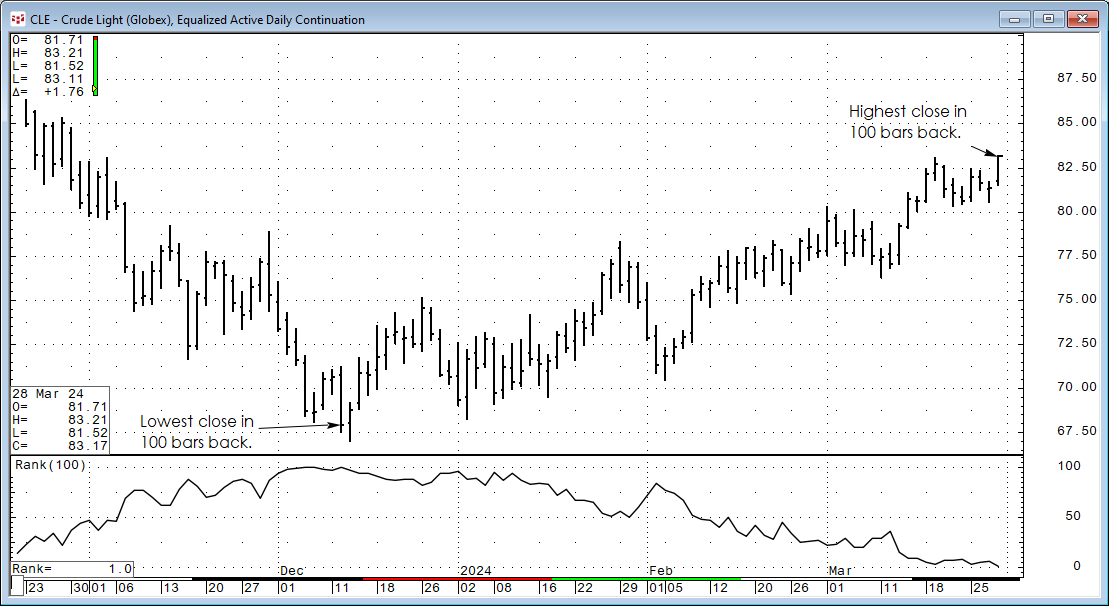
The CQG Rank Study ranks the individual chart points of a market over a specified number of previous trading periods. For example, if the current bar's close had a rank of 3, and the periods were… more
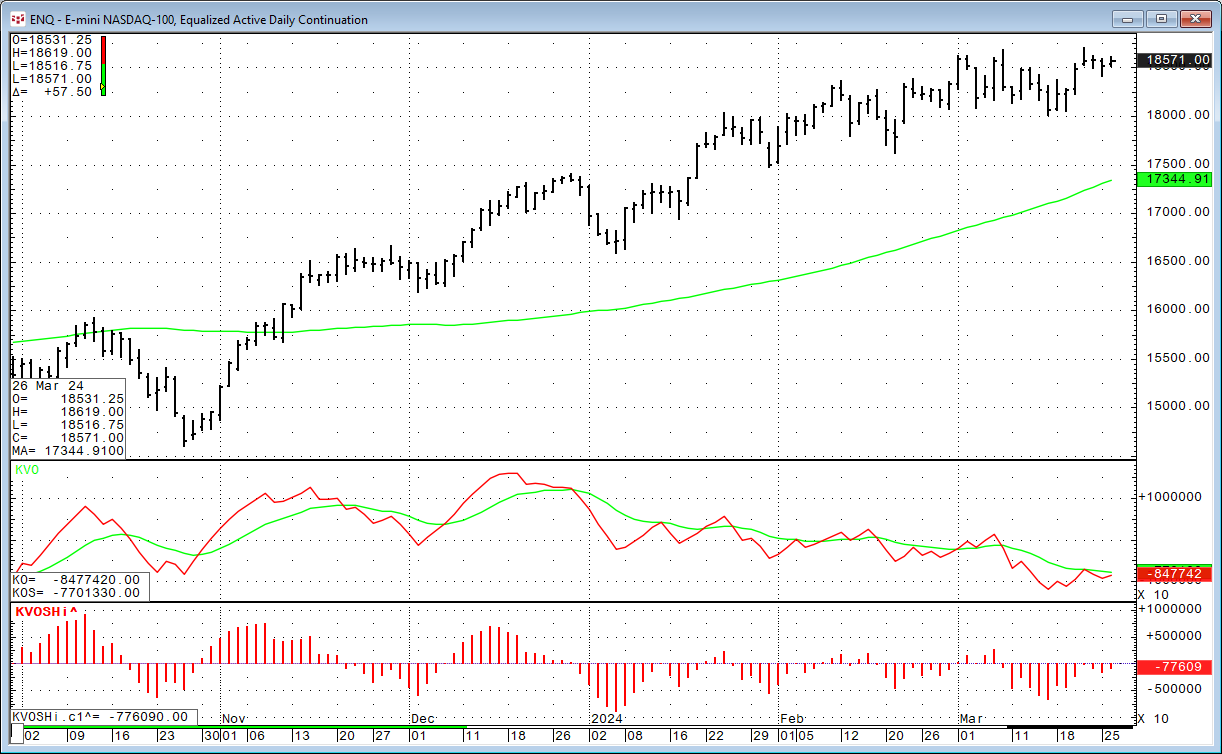
The Klinger Volume Oscillator (KVO) was developed by Stephen Klinger. The study uses the difference between two exponential smoothed moving averages (EMA) of the "Volume Force" and includes a… more
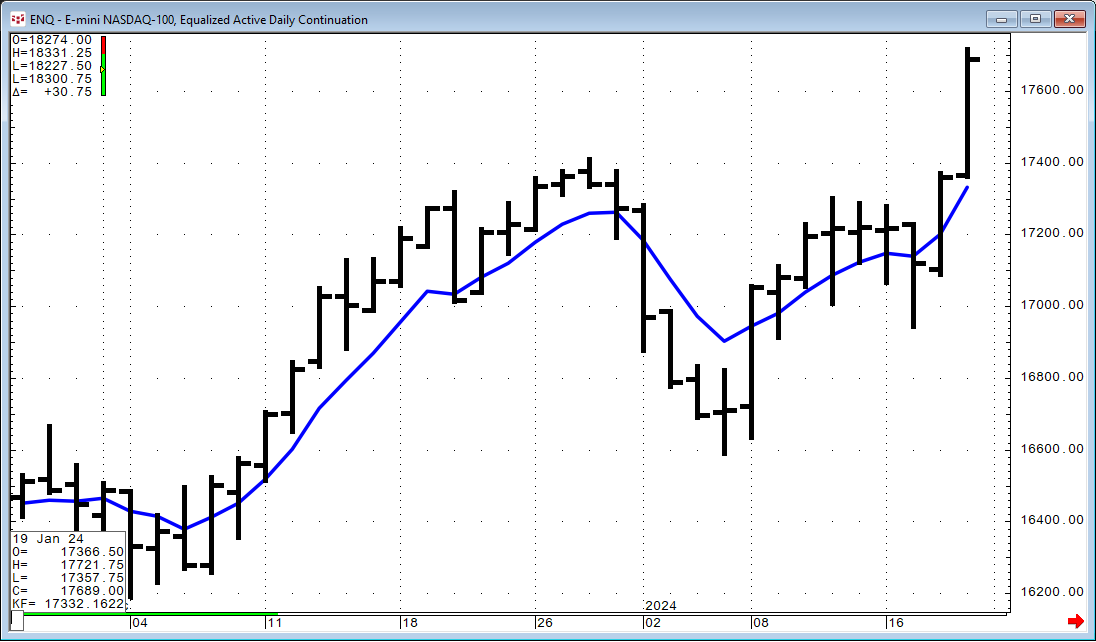
The Kalman Filter is a recursive algorithm invented in the 1960s to track a moving target from noisy measurements of its position and predict its future position. The Kalman filter is an optimal… more
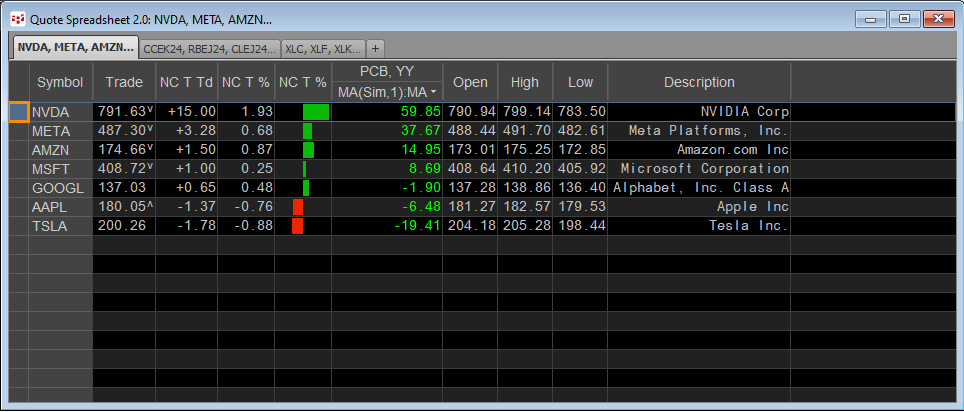
A popular form of market analysis is to maintain a real-time table of market performance based on an annualized basis. For example, the QSS 2.0 displayed below has a sorted column highlighted with… more
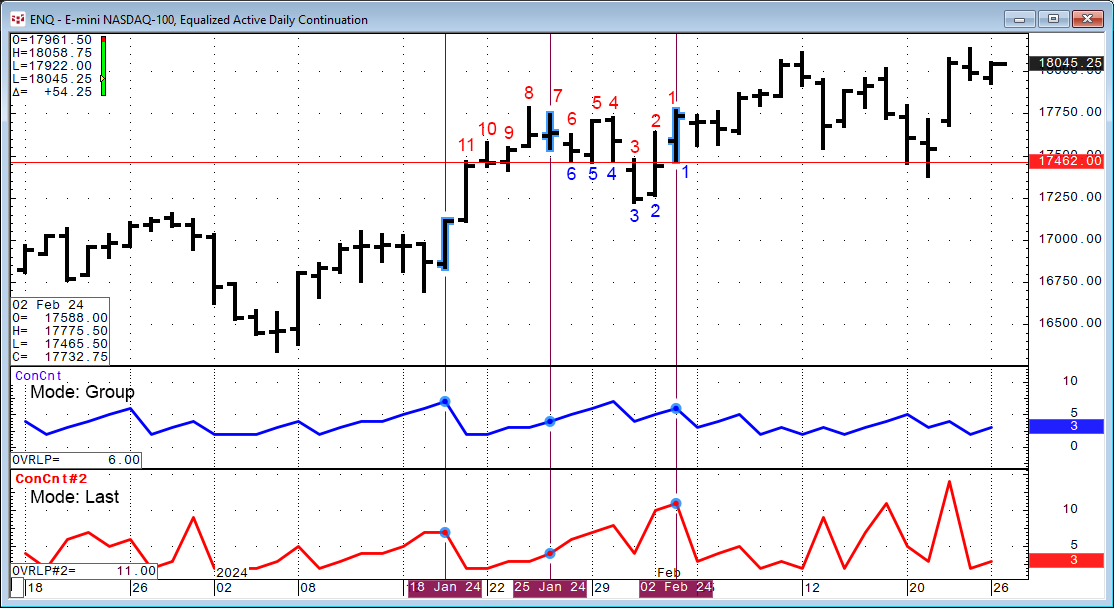
Markets tend to trend up, down, and sideways. Another name for trending sideways is congestion. A period of congestion is when the Open, High, Low, and Close price bars are overlapping. CQG IC and… more
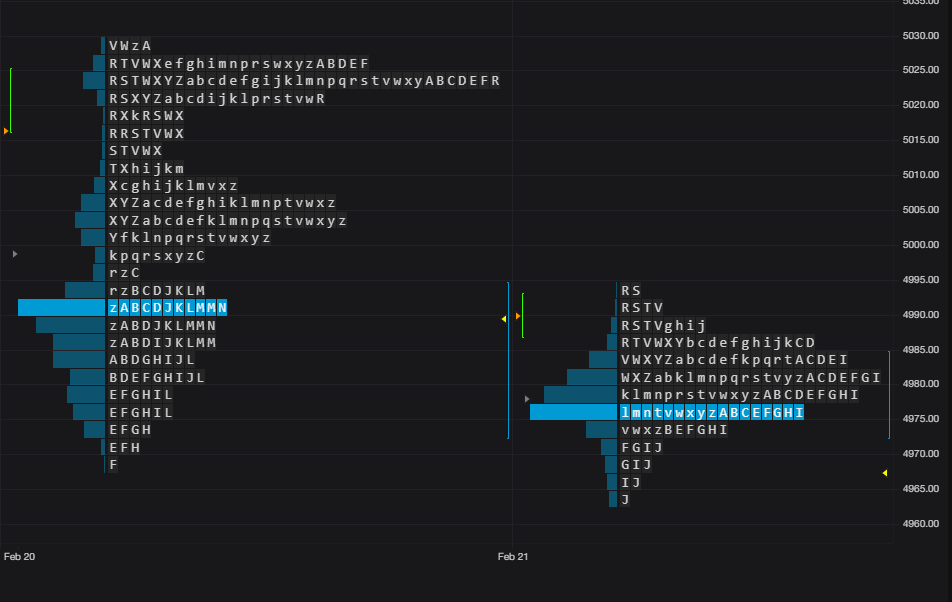
CQG One carries on the tradition of CQG product offerings with best-in-class market data visualization with the introduction in CQG One version 9.1.45025 the CQG Profile chart type and the CP… more