Excel's GROUPBY function offers the ability to create a summary of data. The data can be grouped, aggregated, sorted, and filtered based on the fields you specify.
The syntax of the GROUPBY… more

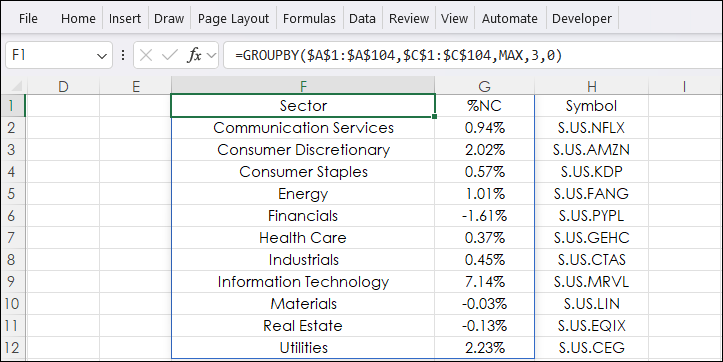
Excel's GROUPBY function offers the ability to create a summary of data. The data can be grouped, aggregated, sorted, and filtered based on the fields you specify.
The syntax of the GROUPBY… more
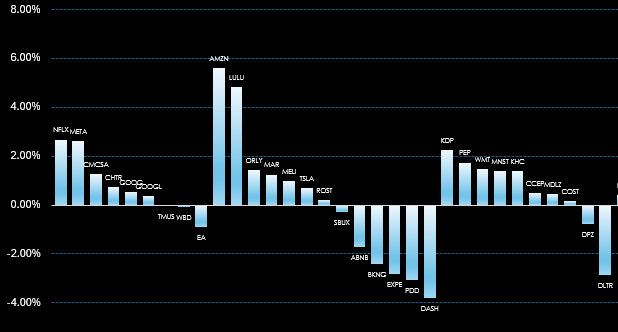
The Excel dashboard at the bottom of the post displays the stocks tracked in the NASDAQ 100 Index broken down by the 11 Global Industry Classification Standard (GICS) sectors.
The NASDAQ 100… more
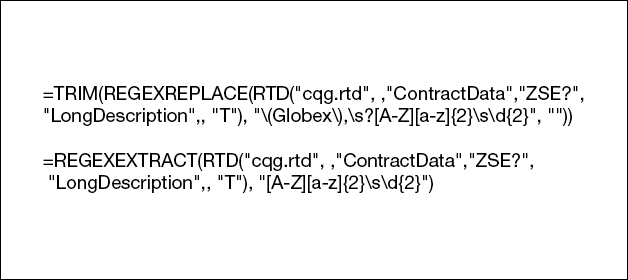
Excel's REGEXEXTRACT function enables enhanced text extraction based on patterns using regular expressions (regex) rather than fixed positions. This function enables you to pull specific data from… more

Microsoft Excel's PROPER Function simply "Capitalizes the first letter in a text string and any other letters in text that follow any character other than a letter. Converts all other letters to… more
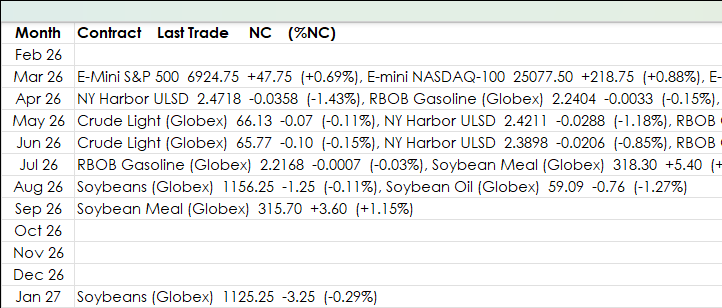
The previous post: "Excel 365 REDUCE and LAMBDA Functions" detailed using Excel's REDUCE and LAMBDA functions to display a table of markets that are sorted by the contract month from a table of a… more
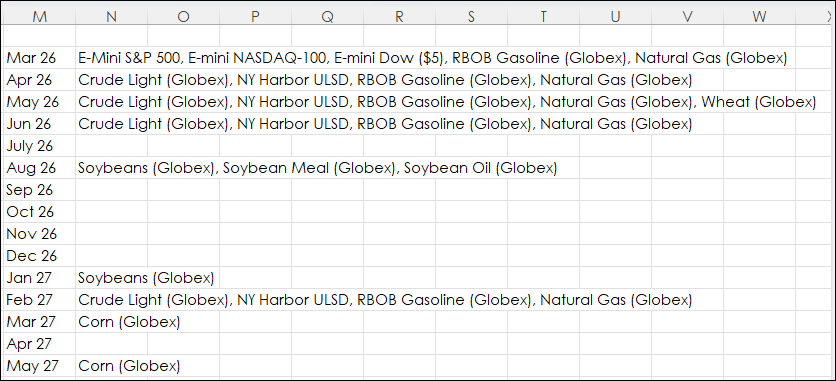
This post details using Excel's REDUCE and LAMBDA function to extract particular data from an Excel dashboard tracking many different markets. For example, the image below displays market data for… more
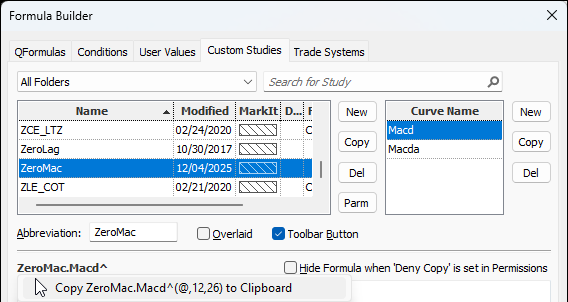
This post details the steps to pulling custom study values into Excel using RTD formulas. First, an overview of RTD formulas and parameters.
When CQG IC or QTrader are installed, a DLL… more
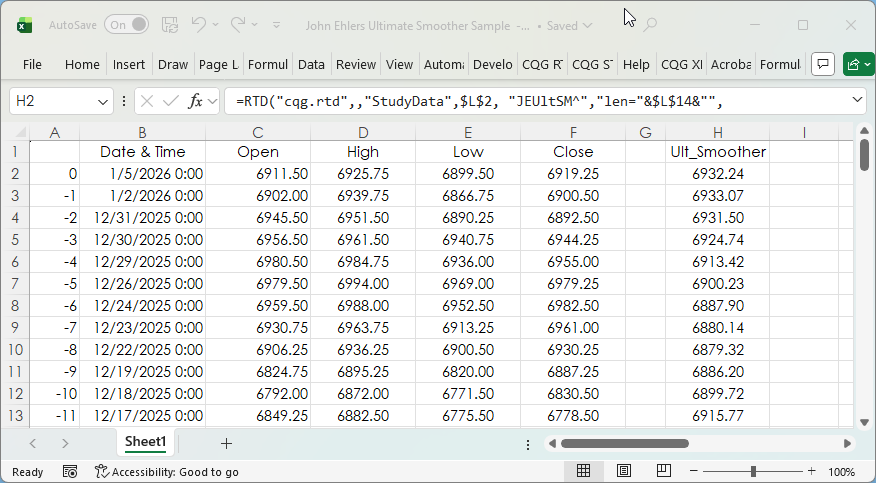
The post CQG Primer: The Ultimate Smoother detailed a study developed by John Ehlers. You can find a detailed description of the Ultimate Smoother on the MESA Software website.
This post… more
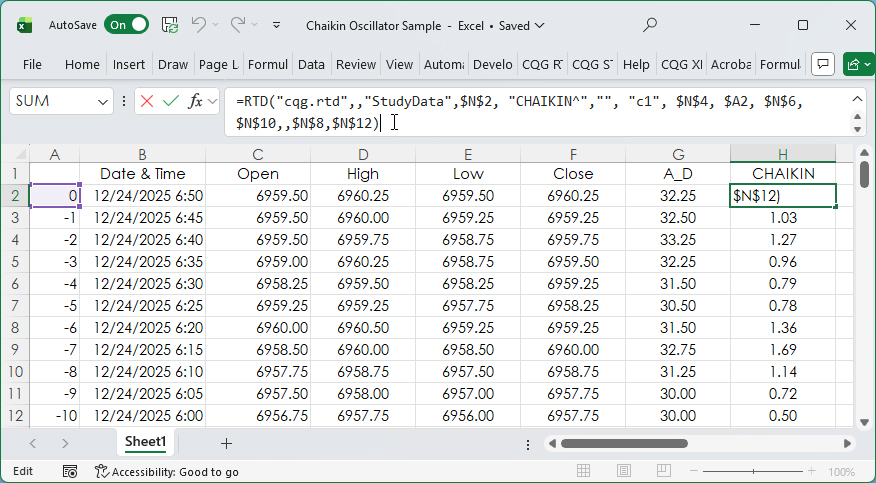
The Accumulation/Distribution Study and the Chaikin Oscillator were introduced in the post titled CQG Primer: The Chaikin Oscillator.
The Chaikin Oscillator is the difference between two… more
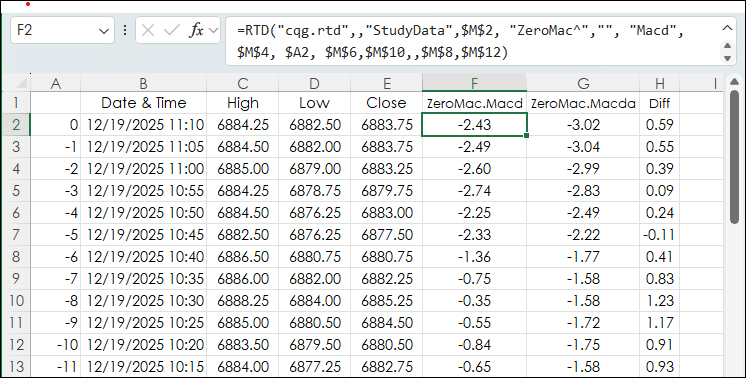
This post, DEMA Based MACD Oscillator, introduced using the Double Exponential Moving Average Study for smoothing the data to create an MACD study that would have less lag than the classic MACD… more