Traders who look to forward curves for analysis can create forward curves using Excel RTD calls. This post details some ways to create forward curves and some "tricks" to make the forward curves reflect the market details.
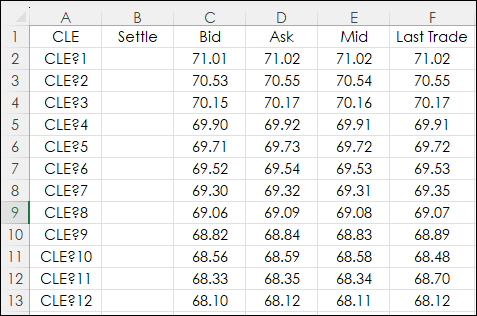
The common way to create a forward curve chart would be to plot the last trade for the series of contracts, such as using this RTD formula for each data point. This RTD formula is used in cell F2 and copied down:
=RTD("cqg.rtd",,"ContractData",A2, "LastTrade",, "T")Where the symbol is in cell A2.
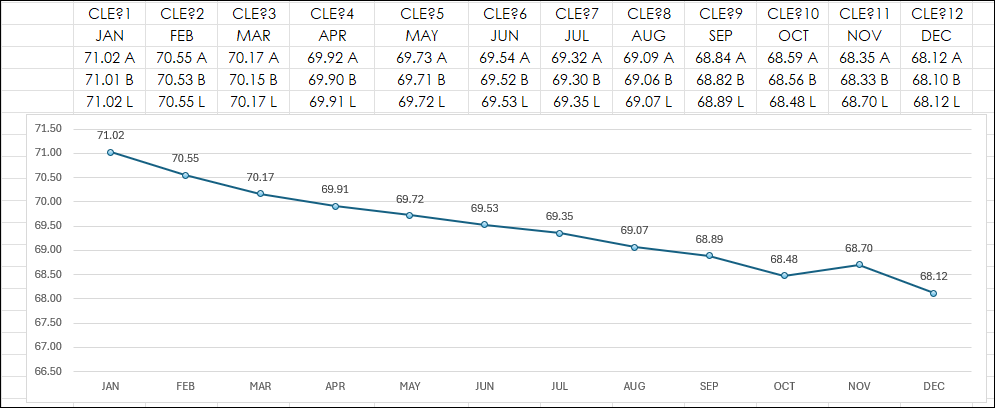
Cells F2:F13 are displayed on the chart.
Notice that the line is fairly consistent in the downward steps of the values except the last few data points. There is an RTD call for time of the last trade:
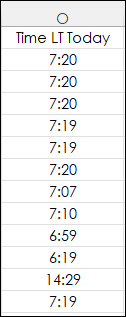
=RTD("cqg.rtd", ,"ContractData",A2, "TMLastTradeToday",, "T")This formula was used in cell O2:O13.
And the time of the last trade was used as a Label value on this chart.
Looking at the above chart the time of the last trade was 7:10 for the August contract, 6:19 for the October contract and (yesterday) 14:29 for the November contract.
One solution to determine the data points is to use an if Then formula to use the mid-point of the Best Bid and Best Ask if the Last Trade is outside of the Best Bid and Best Ask.
F2 = Last Trade
C2 = Best Bid
D2 = Best Ask
E2 is the midpoint between the Best Bid and Best Ask
IF(OR(F2<C2,F2>D2),E2,F2)
The actual Excel RTD Formula used includes the IF Error function to display NA(), which the Excel chart will skip the value instead of displaying a 0 if there is an error. The sample downloadable spreadsheet uses this in cells G2:G13.
This substitution for the mid-point of the Best Bid and Best Ask when the Last Trade is stale creates a smoother forward curve.
In the downloadable Excel sample, there this quote display:
The Ask, Bid, and Last Trade prices are converted to text and then merged with the letter:
=TEXT(RTD("cqg.rtd",,"ContractData",C15, "Ask",, "T"),"#.00")&" A"=TEXT(RTD("cqg.rtd",,"ContractData",C15, "Bid",, "T"),"#.00")&" B"=TEXT(RTD("cqg.rtd",,"ContractData",C15, "LastTrade",, "T"),"#.00")&" L"If you enter in a different root symbol in cell A1 then modify the Text function for the appropriate number of decimals.
A fast way to find RTD functions for building Forward Curve charts can be found here.
Requirements: CQG Integrated Client or QTrader, and Excel 2016 (locally installed, not in the Cloud) or more recent.


