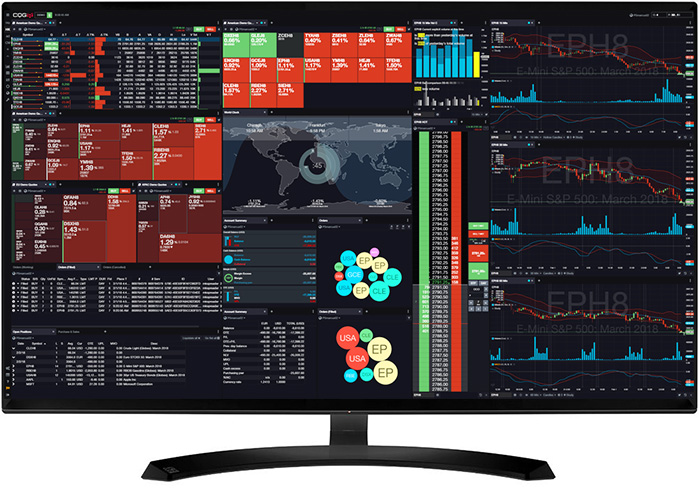
This Microsoft Excel® dashboard displays market data for a user-selected symbol. The standard market data includes the CQG Algo Orders study, which is only available in CQG’s flagship product, CQG… more
Watch our recorded webinar to learn about the benefits of RCM-X algorithmic strategies, which are available in CQG Integrated Client and CQG QTrader.
Learn about:
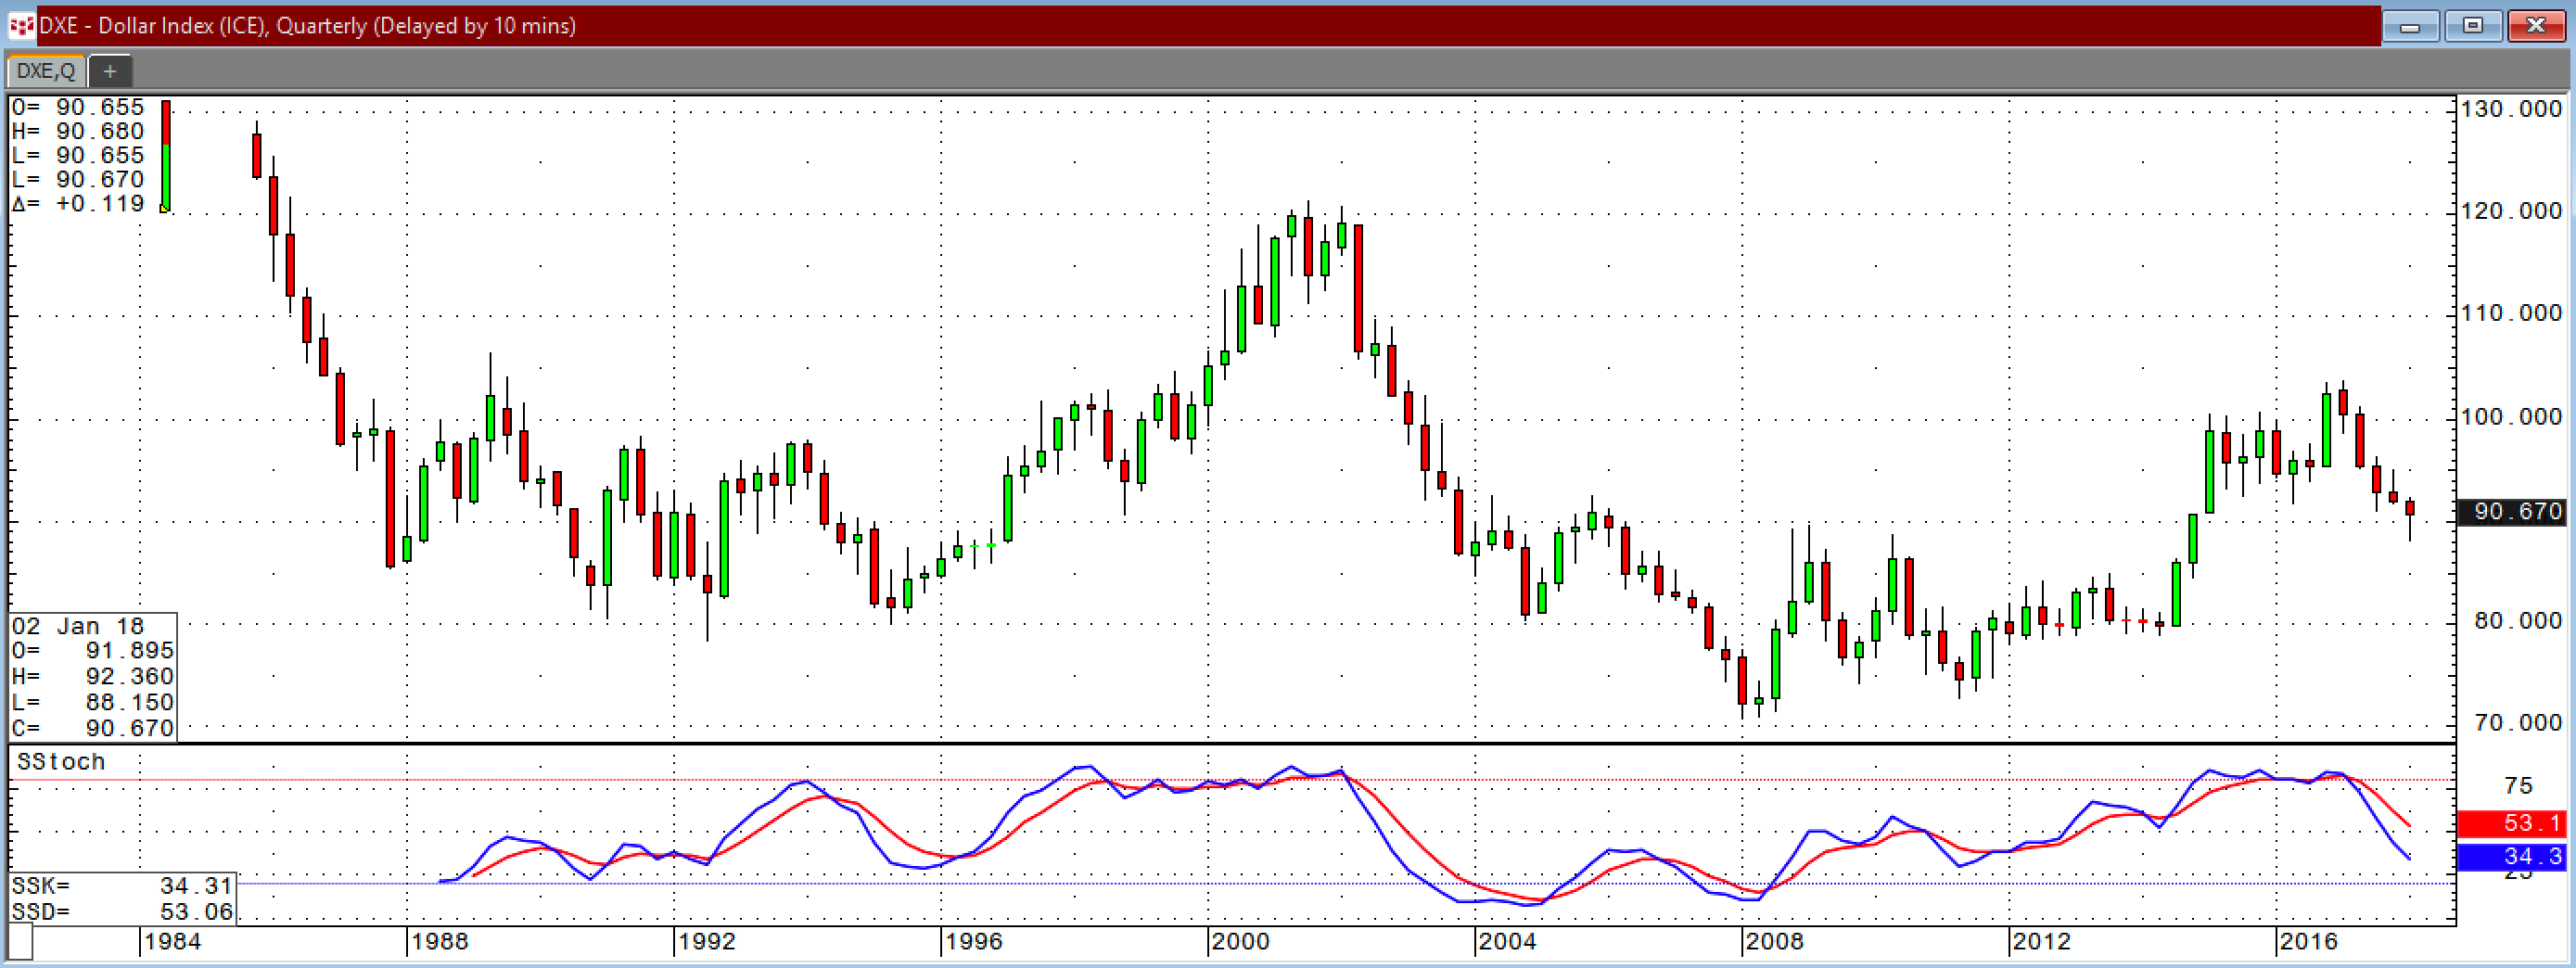
The benefits of RCM-X… moreMarkets became highly volatile during February. A decline in the bond market and rising rates weighed on stocks. At the same time, the dollar index fell to the lowest level since 2014. Rising US… more
Various markets have different times for their trading sessions. Some markets, such as the Bund contract (symbol: DB) traded on Eurex, has only one session. Other markets, such as the E-mini S… more
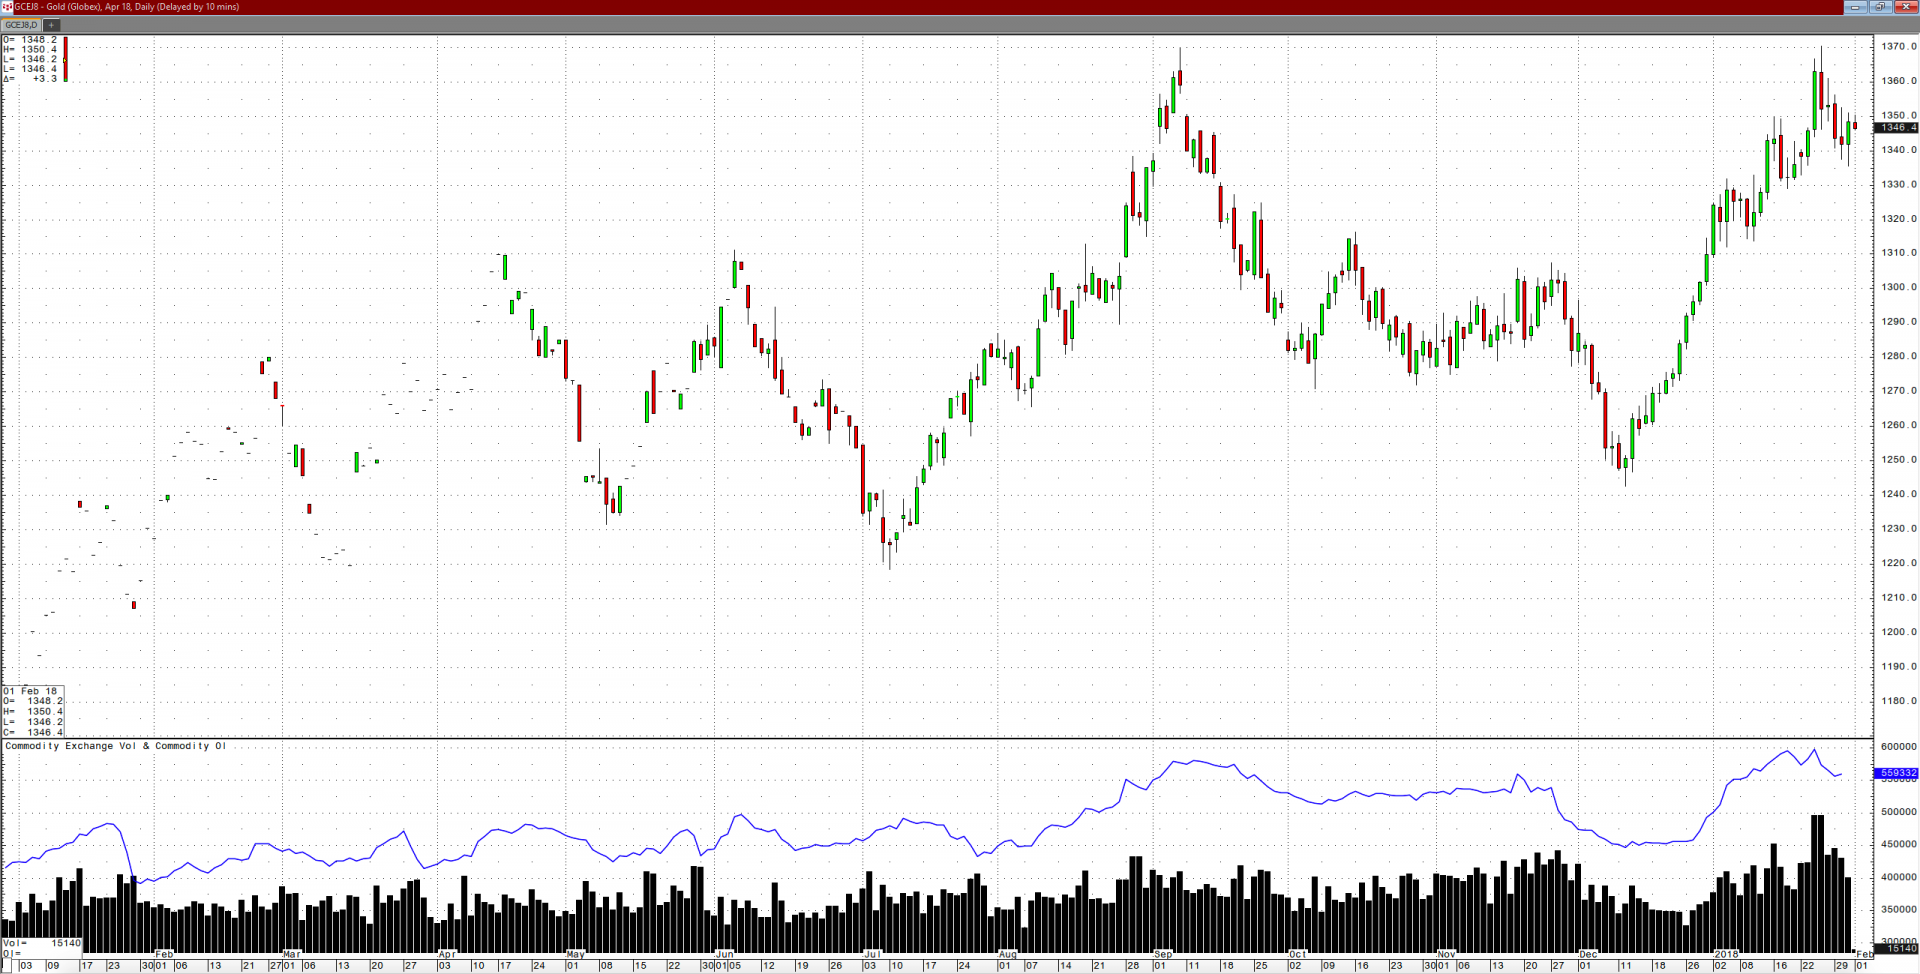
It has been a bullish start to 2018 in the precious metals sector. Palladium began the year with a new record high, and the prices of gold, silver, and platinum have all appreciated after having… more
This Microsoft Excel® spreadsheet pulls in five Imoku studies along with open, high, low, and close bar values. You can change the symbol and the time frame. You can retrieve up to 300 daily… more
Mark your calendar for our next AMA event!
Date: January 30, 2018
Time: 2:30 p.m. CT
Take advantage of the opportunity to ask our product specialists to build your… more
Visit the CQG booth at the 10th Argus Americas Crude Summit to learn more about the following:
Fully integrated trading Standard and smart order types Real-time and historical data… more