Markets became highly volatile during February. A decline in the bond market and rising rates weighed on stocks. At the same time, the dollar index fell to the lowest level since 2014. Rising US rates and a falling dollar are not necessarily historically compatible. After all, currency rates are often the result of interest rate differentials. However, rates have been moving higher on the back of inflationary fears, and recent CPI and PPI reports seemed to have validated the market’s fears.
Meanwhile, volatility has been increasing in the commodities market as a weak dollar is bullish, but higher rates are often a bearish factor as they increase the cost of holding inventories or long positions. Commodities tend to appreciate during inflationary periods, and the question facing markets is whether rates are heading higher because of inflationary pressures. If that turns out to be the case, watch out on the upside for the raw materials sector. On Friday, February 23, in an interview on CNBC, Jeffrey Gundlach, the CEO of DoubleLine Capital, warned that during secular bull markets in commodities, prices could rise by 100-400%.
Commodities continue to look good as we head into the third month of 2018.
The Dollar’s Trend Remains Lower
The dollar has been falling, and it reached its most recent low in January.
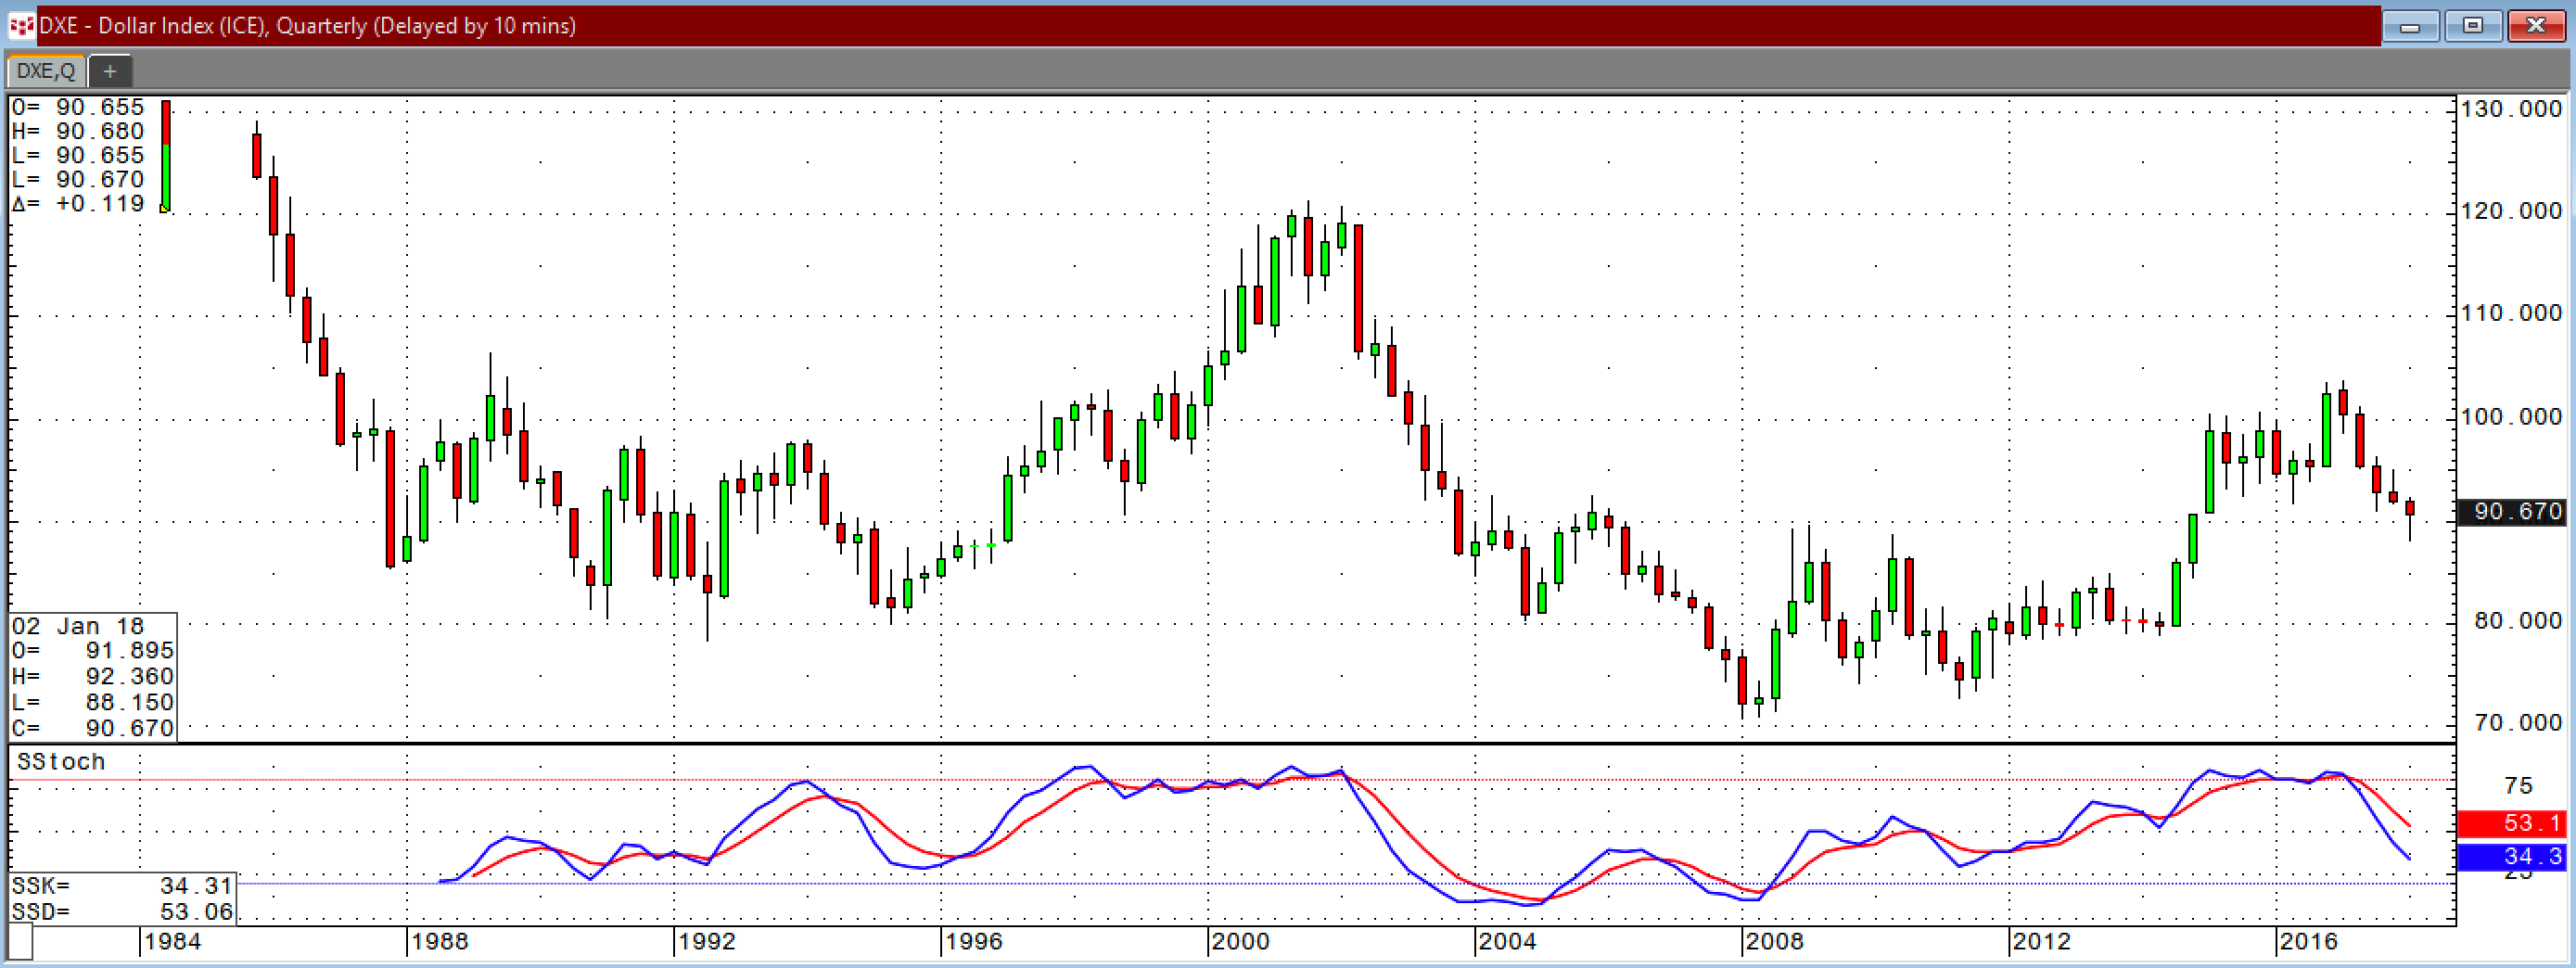
As the quarterly chart highlights, the dollar index has been dropping since the start of 2017. A pattern in the index since 1985 could suggest that we are only one year into a bear market trend that could take the greenback lower for another six years. The index fell for seven years from 1985-1992. A nine-year rally followed until 2001, at which point the dollar declined for another seven years until 2008. The most recent rally that took the dollar index to highs of 103.815 in January 2017 lasted for nine years and if history repeats, we could see a trend to the downside that continues until 2024.
The dollar is the reserve currency of the world and the benchmark pricing mechanism for commodities prices. A bear market in the dollar tends to be supportive of raw material prices.
Inflationary Pressures Support Raw Material Prices
Commodities are assets that are highly sensitive to increasing inflationary pressures. Inflation eats away at the value of money, causing prices to rise as purchasing power erodes.
So far in 2018, we have seen bond prices move to the downside and interest rates rise.
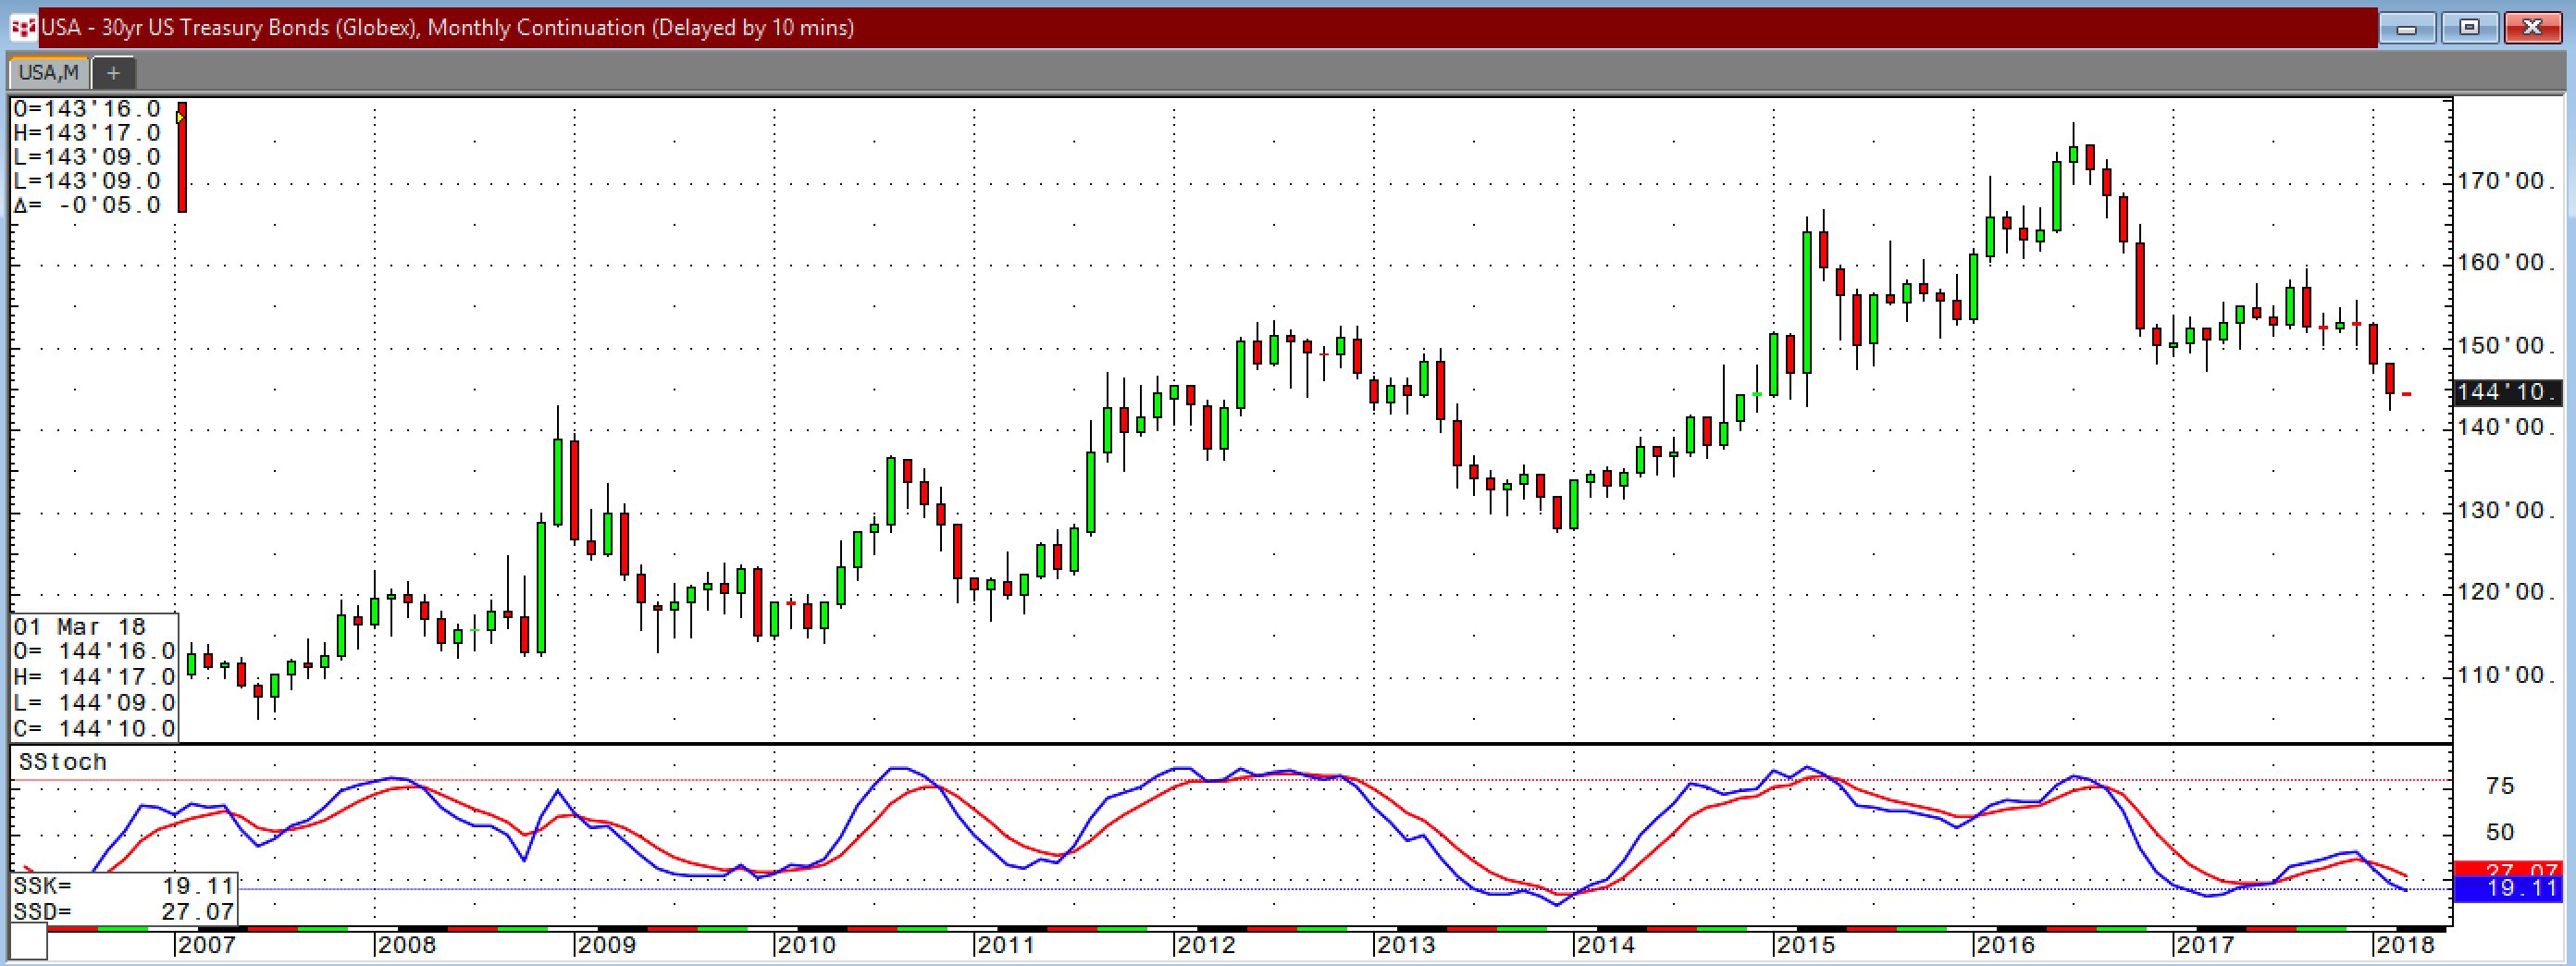
As the monthly chart of the US 30-year Treasury bond illustrates, the nearby futures contract broke below technical support at 147-07 in January and followed through on the downside in February. When it comes to interest rates, two components determine yields. An increase in real rates tends to weigh on commodities prices as it increases the cost of carrying inventories and long positions. However, when rates move higher because of inflationary pressures, commodities prices tend to move to the upside. In February, the CPI and PPI report from the previous month suggested that inflation is on the rise. The path of least resistance of many raw materials prices has been higher over past months, and both the dollar and rates are supportive of higher highs in the coming weeks and months.
Energy - Oil Leads
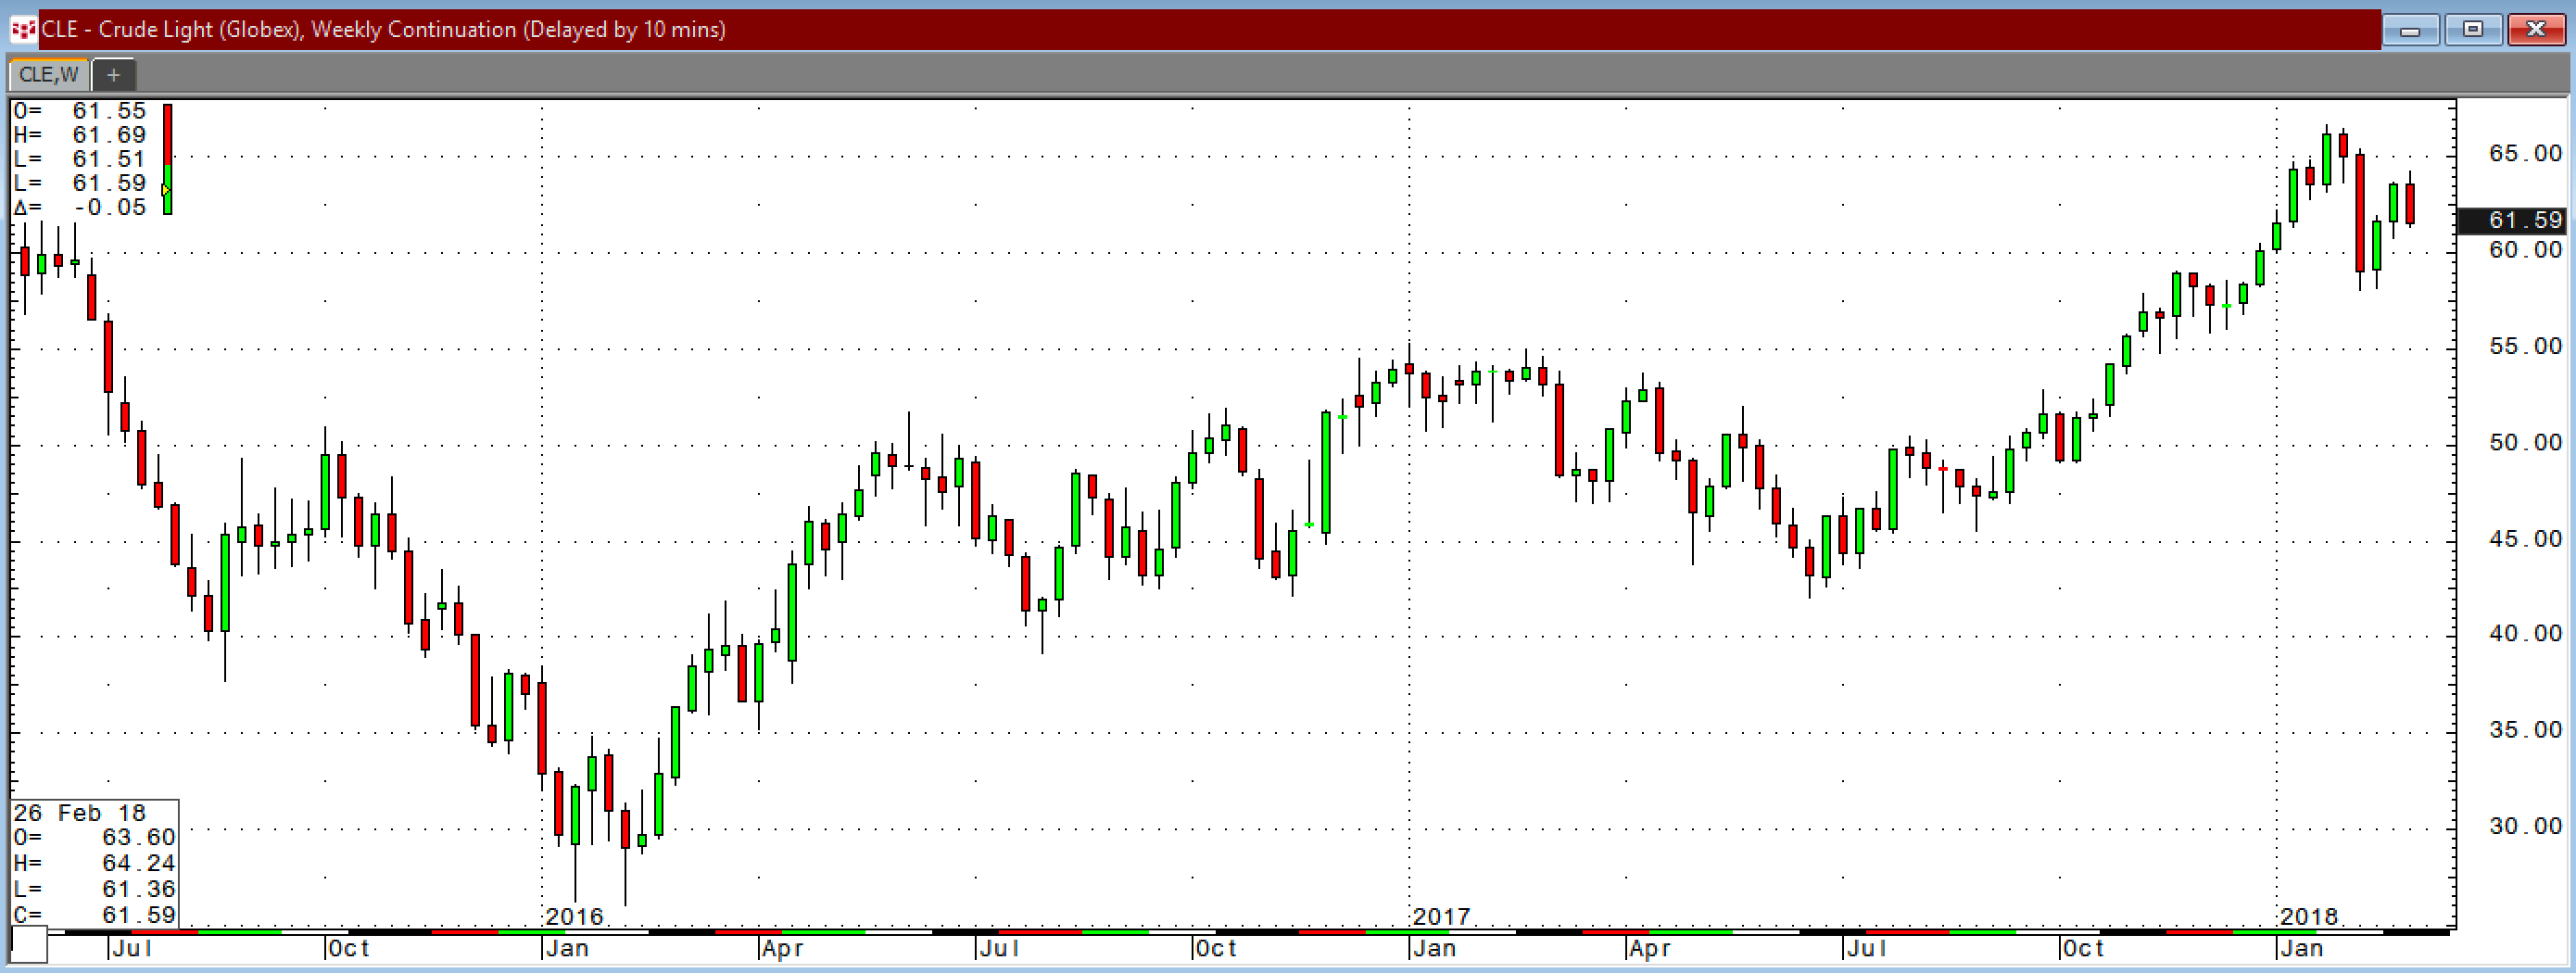
On June 21, 2017, the price of crude oil fell to its lowest level of the year when it traded to $42.05 per barrel on the nearby NYMEX futures contract.
As the weekly chart shows, the energy commodity has rallied since June, reaching a high of $66.66 on January 25. After a correction that took oil down to $58.07, the price has rebounded and closed the month of February at the $64 per barrel level. Crude oil products, gasoline, and distillates have both followed the price of oil and crack spreads, and gasoline and heating oil crack spreads are higher at the end of February 2018 than they were at the end of the second month of the year in 2017. At the same time, oil is in backwardation with deferred prices lower than nearby ones. The tightness in crude oil is a sign that demand remains strong despite the increase in US shale production. A buoyant economy in the US and around the world continues to support the price of oil.
Metals - Industrial and Precious Metals Are Strong
Aside from oil, other industrial commodities are firm and holding gains over recent months.
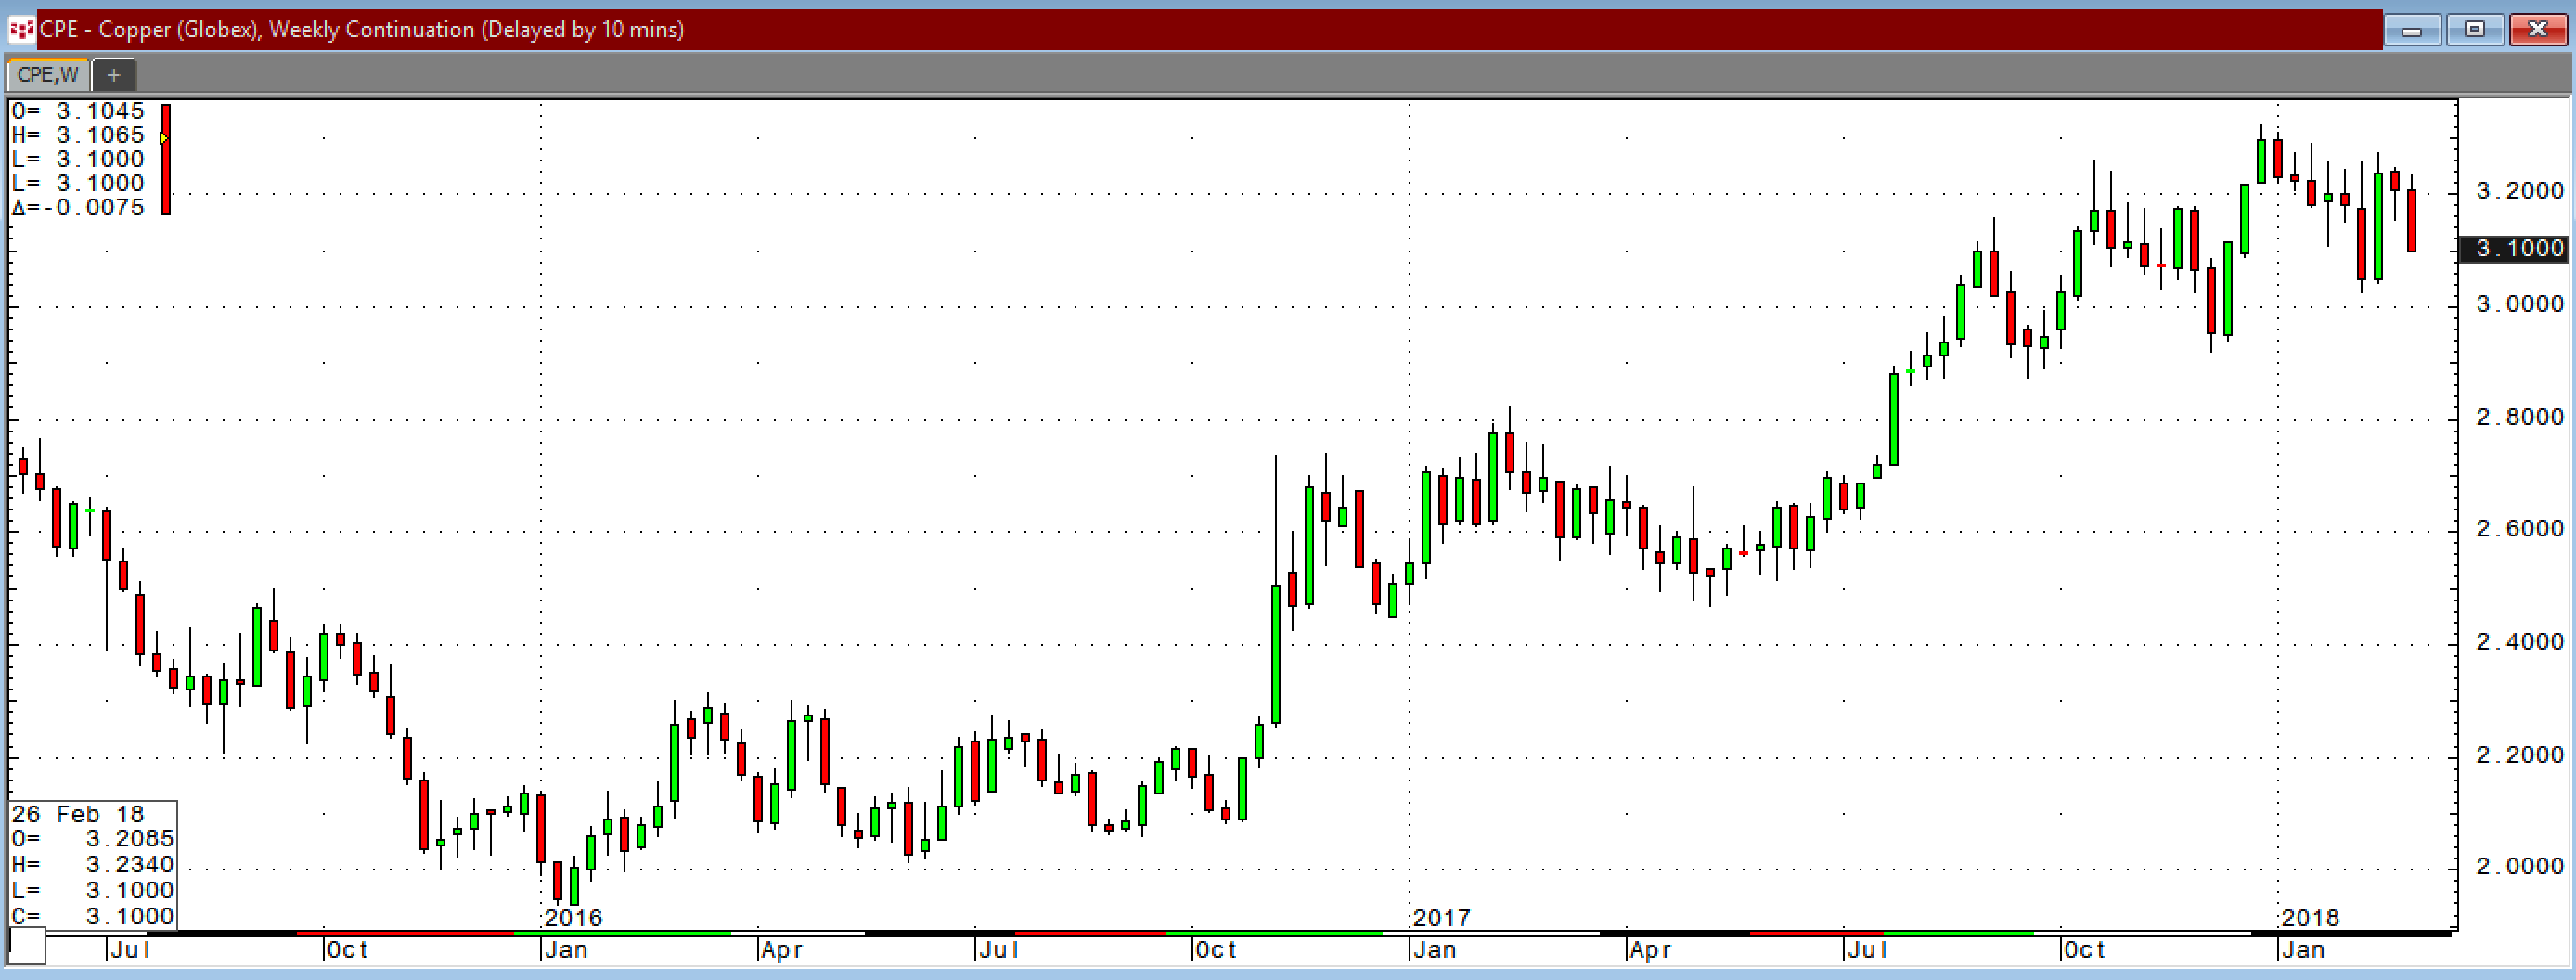
Copper, a bellwether commodity, has moved from $1.9355 in early 2016 to highs of $3.3220 per pound in late December 2017. Copper was trading at over the $3.13 per pound level at the end of February. At the same time, the other nonferrous metals that trade on the London Metals Exchange are close to recent highs with aluminum, nickel, lead, zinc, and tin prices all in bullish mode. The price of iron ore, the primary ingredient in steel, is also close to recent highs.
As the quarterly chart shows, the price of lumber rose to its highest level in history in February when it traded at $532.60 per 1,000 board feet. All of the industrial commodities have been making higher highs so far in 2018.
When it comes to precious metals, gold came within $7 of its 2016 high in February when the price of the yellow metal hit $1370.50 per ounce. Palladium put in a new record peak in January at $1133 per ounce. While silver and platinum have not approached critical levels on the upside, the recent path of least resistance for both of the laggards in the sector has been higher.
Agriculture - Uncertainty and Weather Could Spark Inflationary Pressures
Commodities prices can contribute to inflationary pressures, and one of the most ubiquitous sectors of the raw material market is agriculture. People all over the world need to eat, and because of population and wealth growth around the world, the demand for food rises on a daily basis. In 1960, there were approximately three billion people on the earth. The latest count is north of 7.455 billion. Each quarter the total grows by around twenty million, which means that there are more mouths to feed in the world. The bottom line is that more people, with more money, are competing for finite food supplies and agricultural production has been rising to meet the increasing demand.
Each year is a new adventure in the grain markets, and after five consecutive years of bumper crops, the world has become accustomed to and dependent on abundant crops. However, it will be the weather across the fertile plains of the US and around the world that will determine if 2018 is the sixth straight year of crop yields sufficient to satisfy global requirements.
On long-term charts, even though inventories have swelled to record levels over recent years, the prices of corn, soybeans, and wheat have all made higher lows for the past two decades or longer. The price pattern is a testament to increasing global demand. Recently, dry conditions in South America have bolstered prices as we enter the 2018 planting season.
The price of soybean futures is going into the 2018 crop year at the highest price since early 2017.
The corn price is also on an upward trajectory since the end of the 2017 crop year.
Additionally, CBOT wheat has been moving higher since posting a bullish key reversal trading pattern on the weekly chart last December.
Grain prices are pointing higher as we enter a period of uncertainty as weather over the coming months will determine the 2018 crops. If Mother Nature decides that this year will not be the sixth straight year of bumper crops, and shortages begin to develop, watch out on the upside. Higher food prices could feed inflationary pressures already present in the economy.
We are now heading into the final month of the first quarter of 2018, and the prospects for commodities prices continue to look bullish. Raw material prices tend to be one of the most volatile sectors of the market and prices rarely move in a straight line.


