Quotes
- New dialog for managing columns, tabs similar to chart
Charts
- New scale with studies, scale without studies toggle button
Trading
- Orders, Positions, and Accounts widgets: new manage columns dialog
- Orders: historical order search
- Accounts: custom columns and filters
- OTE + PL setting to use yesterday's settlement
More Details and How to Access the New Features
Managing Columns in QSS, Orders, Positions, and Accounts
- Go to the task menu in the QSS, Orders, Positions, and Accounts views and select Manage columns.
- The Manage columns dialog will appear with 2 tabs: In Window and + Column.
- Reorder and remove columns on the In Window tab.
- Add columns on the + Column tab by selecting columns and then clicking the Add button.
Auto-Scale with Studies on Chart
A new toggle button switches between auto-scaling with or without studies when panning the chart.
Historical Order Search
From the Filter dialog in the Orders view, you can now select from historical presets, or select a data range to see orders within 30 days.
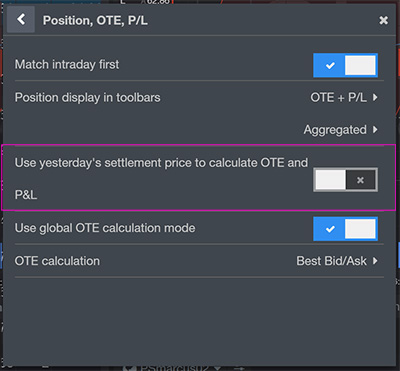
Calculate OTE Based on Yesterday's Settlement
Go to Preferences, then Reporting, and finally Position, OTE, P/L to calculate OTE based on yesterday's settlement.
Account Summary and Custom Formulas
Custom formulas for filtering:
You may want to use this technique when monitoring multiple accounts for risk conditions, and filter a view to just those accounts that meet the condition.
- Have both the Account Summary and the Formulas widget open.
- Create a new formula by clicking the + button in the toolbar, the New Formula dialog will open.
- Give your formula a name in the Title field.
- In the Expression field, use the prefix "account." for different account values and simple math operators to construct a formula.
- In this example, we create a filter to show accounts with a negative balance.
- To use the formula as a filter, check the Condition box.
- Save the formula.
- Go to the filters menu in the Account Summary view to choose the filter you just created.
Custom formulas for custom columns:
You may want to use this technique to create a column to display some risk algorithm that indicates when accounts might be getting into trouble.
- From the task menu, or from the + Column tab in the Column manager dialog, click + Formula to create a new formula.
- In the New Formula window, give your formula a name in the Title field.
- In the Expression field, use the prefix "account." for different account values and simple math operators to construct a formula.
- In this example, we create a column showing purchasing power minus margin, shown as a percentage.
- Save the formula.
- Because we started the formula from the + Column tab, once the formula was saved, it was added to the In Window tab.
We hope that these updates help improve your trading workflow. We continually strive to improve your CQG Desktop experience. We invite you to vote for or enter features you want via our CQG Forums site. And see past release notes on our website.
Happy Trading!
The CQG Desktop Team