
I am excited to share the news we just announced, that CQG has entered into an agreement for Broadridge Financial Solutions, Inc. (NYSE:BR) to acquire our firm, subject to customary closing… more

This video, presented by CQG Product Specialist Helmut Mueller, walks you through using his Super Template for developing and testing a trading system.
The Super Template is installed in CQG… more
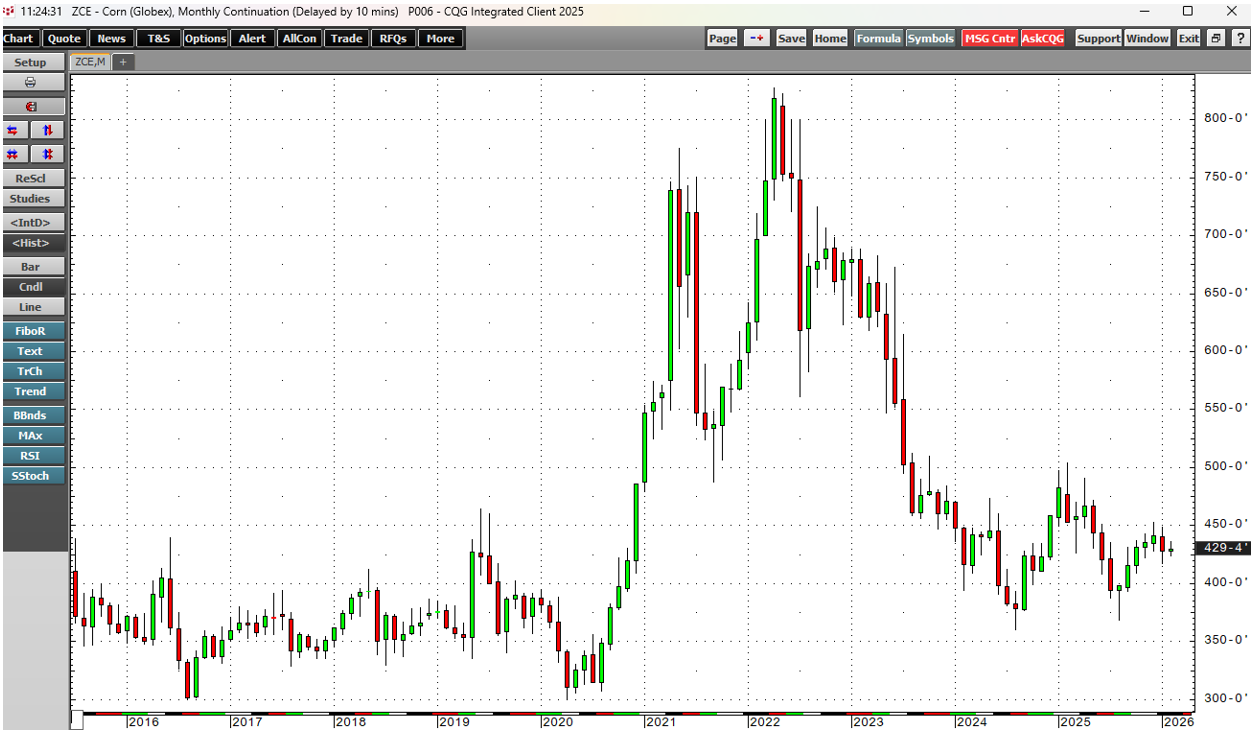
Sentiment in the leading grain and oilseed markets remains bearishSigns of bullish life in CBOT soybeans, corn, and wheatThe weather is critical, as each year is a new adventure in the agricultural… more

Midweek, the OSE 10 Year JGB, Mar 26 contract is down -0.20%. The best performer in the US market is the 30yr US Treasury Bond (Globex), Mar 26 contract, which is up +0.51%. The best… more

This midweek look shows the Nikkei 225 (Osaka), Mar 26 contract, up with a gain of +4.91%. The best performer in the US market is the E-mini NASDAQ 100, Mar 26 contract showing a gain of +1… more

Each Wednesday this article will be updated with the current seasonal study using CQG's Seasonal analysis applied to the Soybean, Wheat and Corn markets. You can download the CQG pac providing the… more
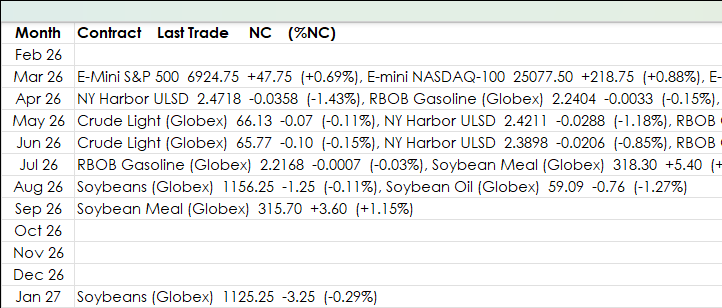
The previous post: "Excel 365 REDUCE and LAMBDA Functions" detailed using Excel's REDUCE and LAMBDA functions to display a table of markets that are sorted by the contract month from a table of a… more
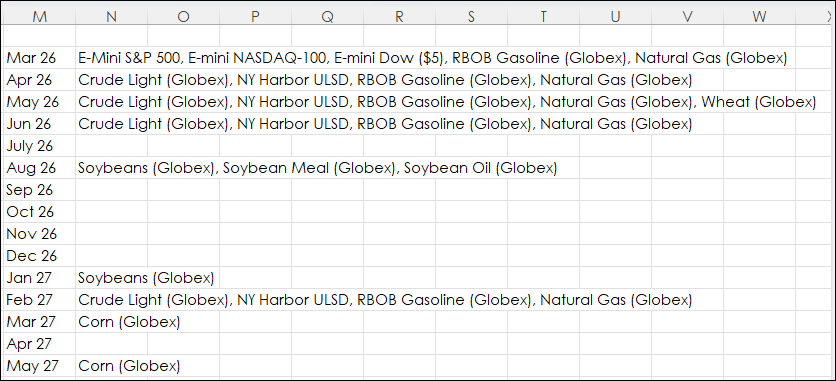
This post details using Excel's REDUCE and LAMBDA function to extract particular data from an Excel dashboard tracking many different markets. For example, the image below displays market data for… more
This midweek look shows the Nikkei 225 (Osaka), Mar 26 contract, up with a gain of +1.00%. The best performer in the US market is the E-mini NASDAQ 100, Mar 26 contract showing a gain of +0… more
Midweek, the OSE 10 Year JGB, Mar 26 contract is up +0.40%. The best performer in the US market is the 30yr US Treasury Bond (Globex), Mar 26 contract, which is down -0.16%. The best… more