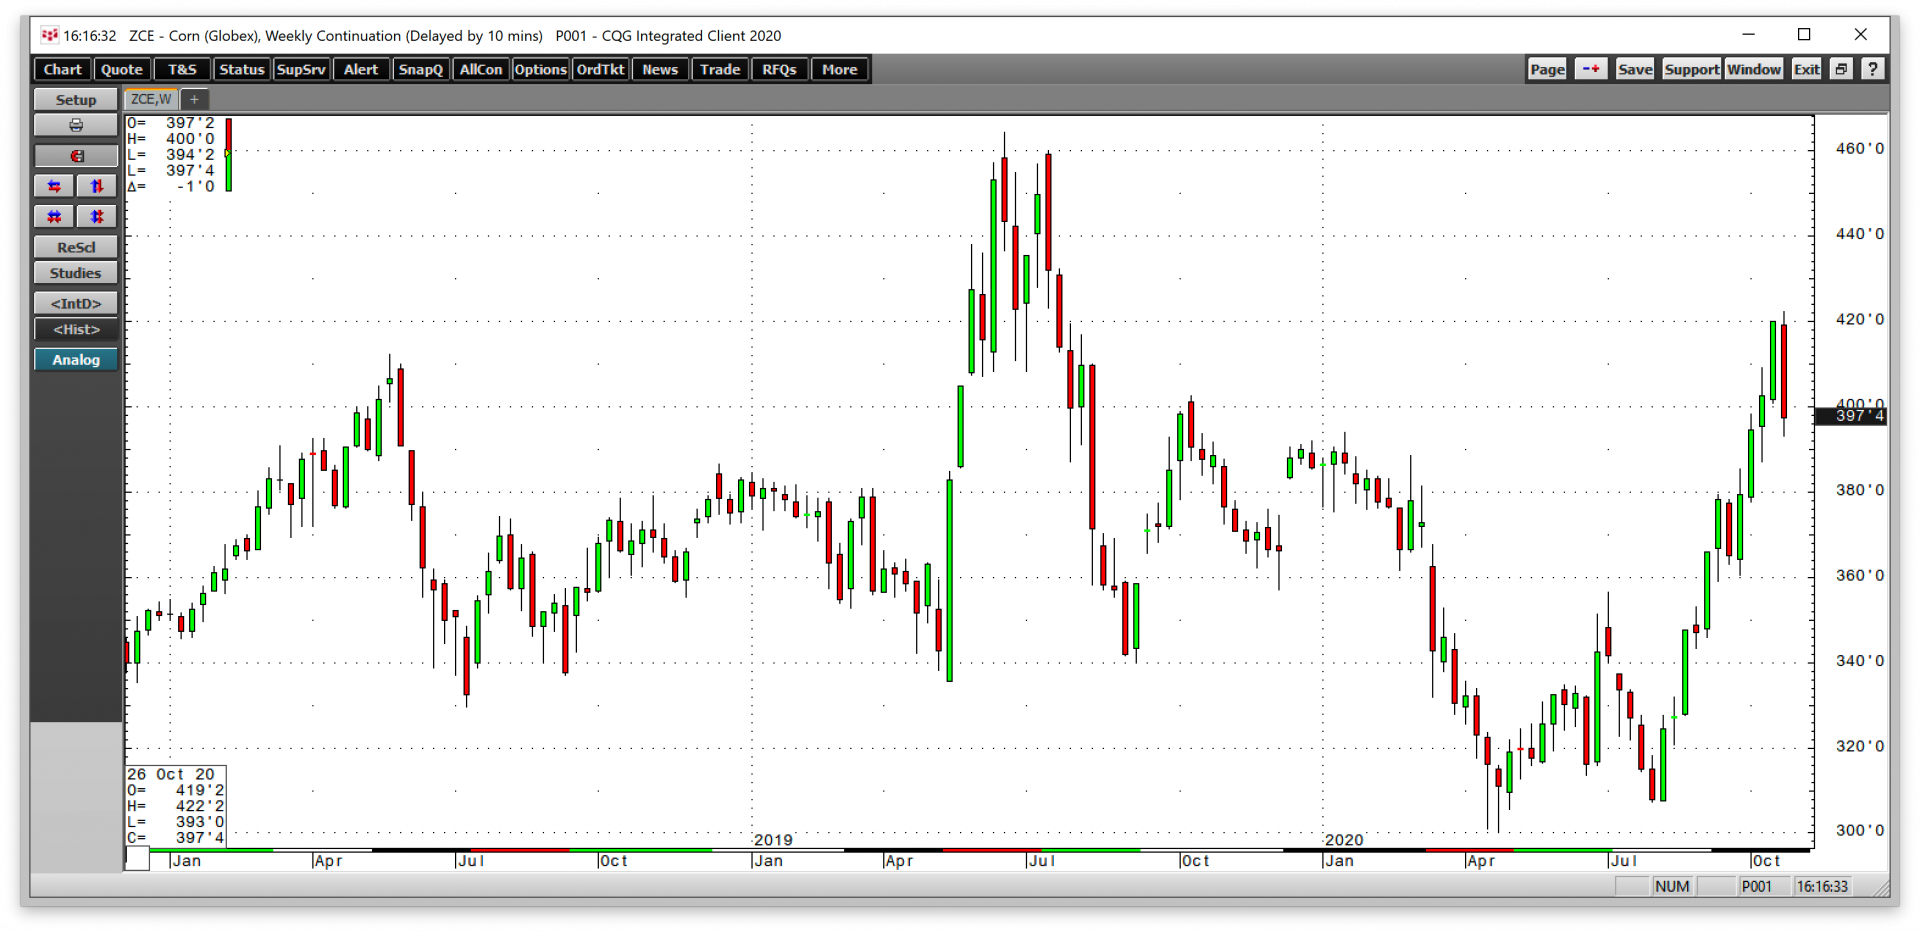
Market watchers who trade/hedge in futures need to pay close attention to the longer-term weekly and monthly continuation charts for nearby futures. History shows that strong-… more
Yra Harris joins Anthony Crudele on Futures Radio in a great discussion about the current Global Macro Landscape. Listen to the conversation here.
Presented by Futures Radio Show… more
This Microsoft Excel® dashboard displays the CFTC Disaggregated COT data published each Friday as of Tuesday’s business date. Using the combined futures and options data there is a pie chart and… more
Judd Hirschberg explores the current analysis of the financial markets on 10.28.2020 using CQG IC here.
Presented by Financial Repression Authority
… more
Supply and demand fundamentals support the grain markets. According to the US Census Bureau, the global population grows by approximately twenty million each quarter. At the turn of this century,… more
… more
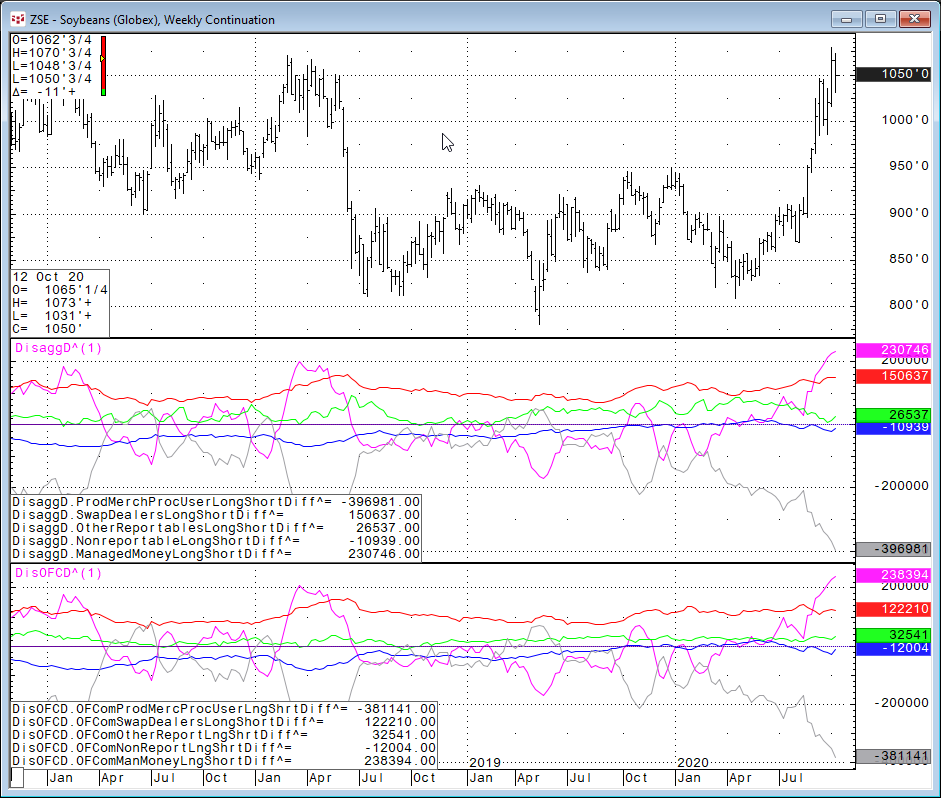
CQG has added more data to the Disaggregated group in the CQG Symbol Finder. Now, both the futures only and the combined futures and options data are available.The Disaggregated reports are broken… more
Here is a presentation by Yra Harris, presented by WhiteWave Trading Strategies, an independent research firm, about Japan, the Nikkei Index, and how markets align.
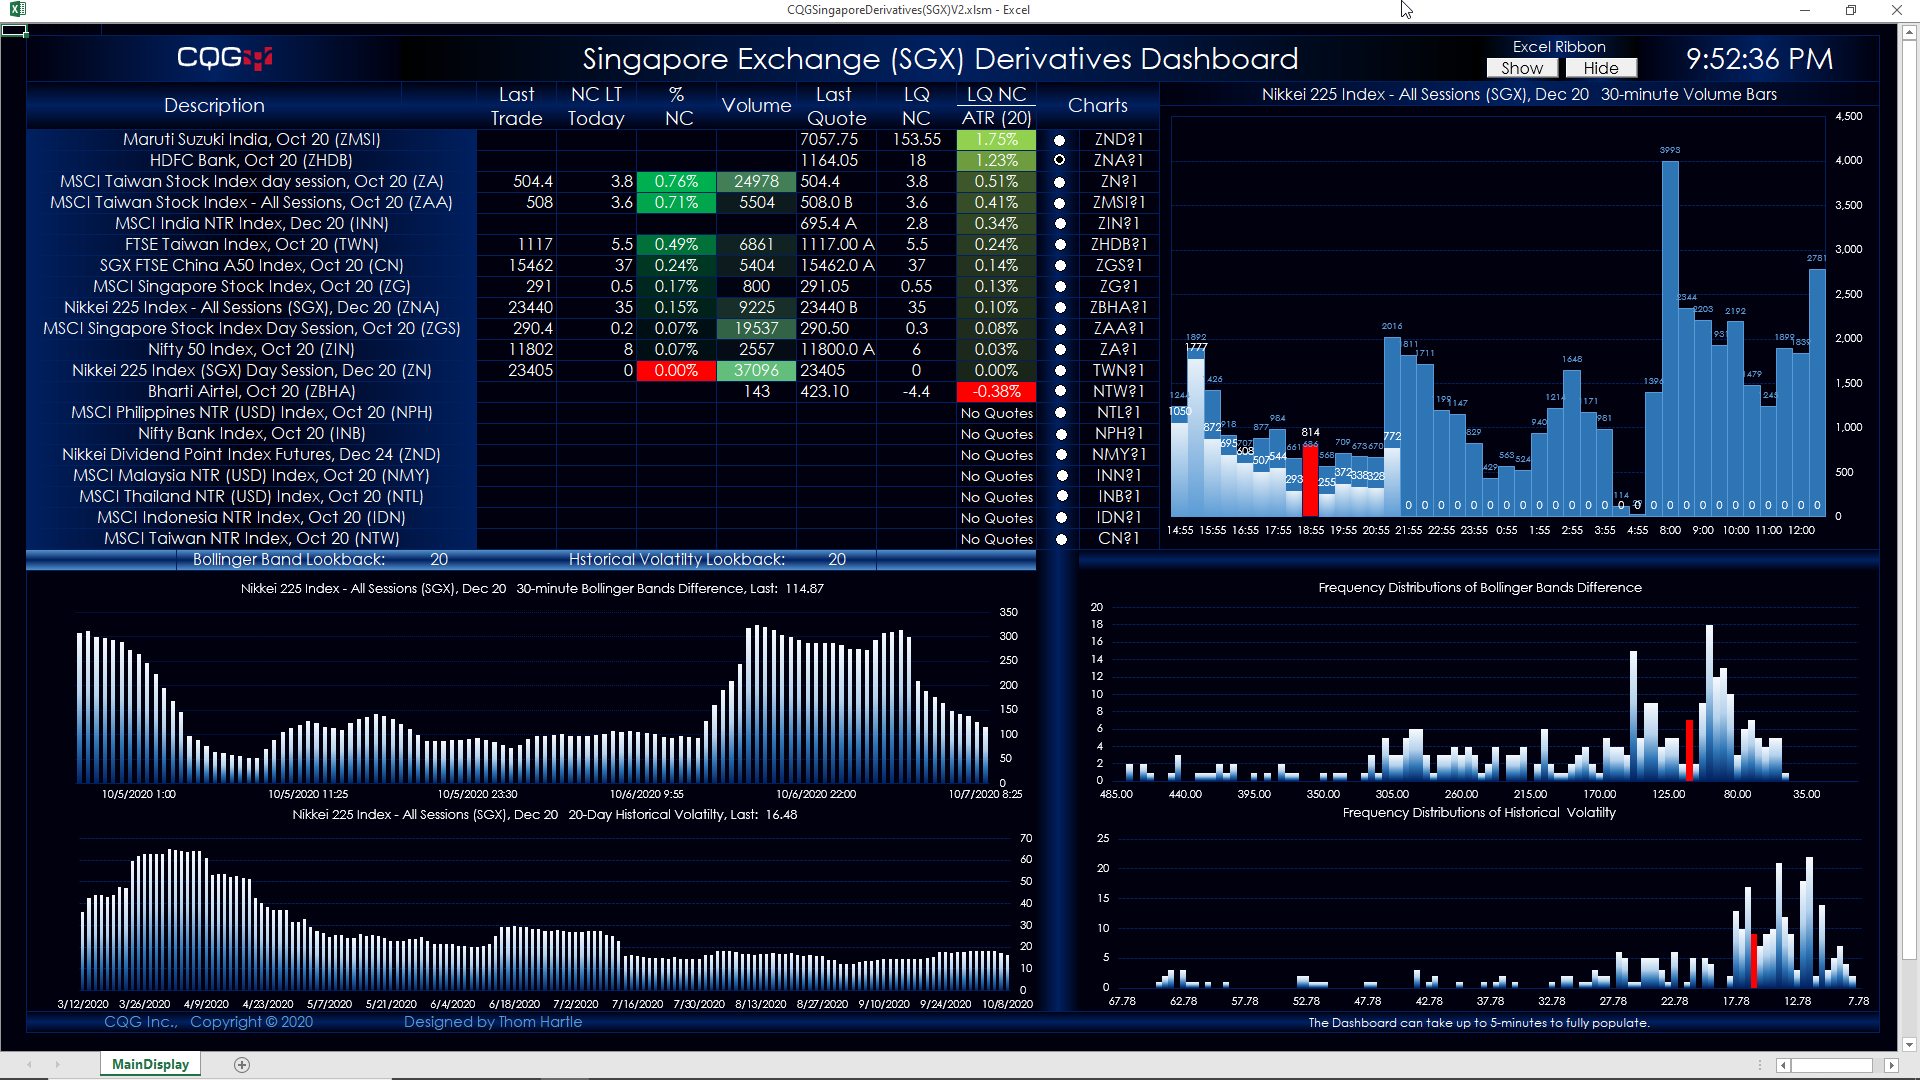
… moreThis Microsoft Excel® dashboard tracks the futures contracts traded on SGX. The symbol choices are hard coded and are the most popular by volume and open interest.
This dashboard… more
