
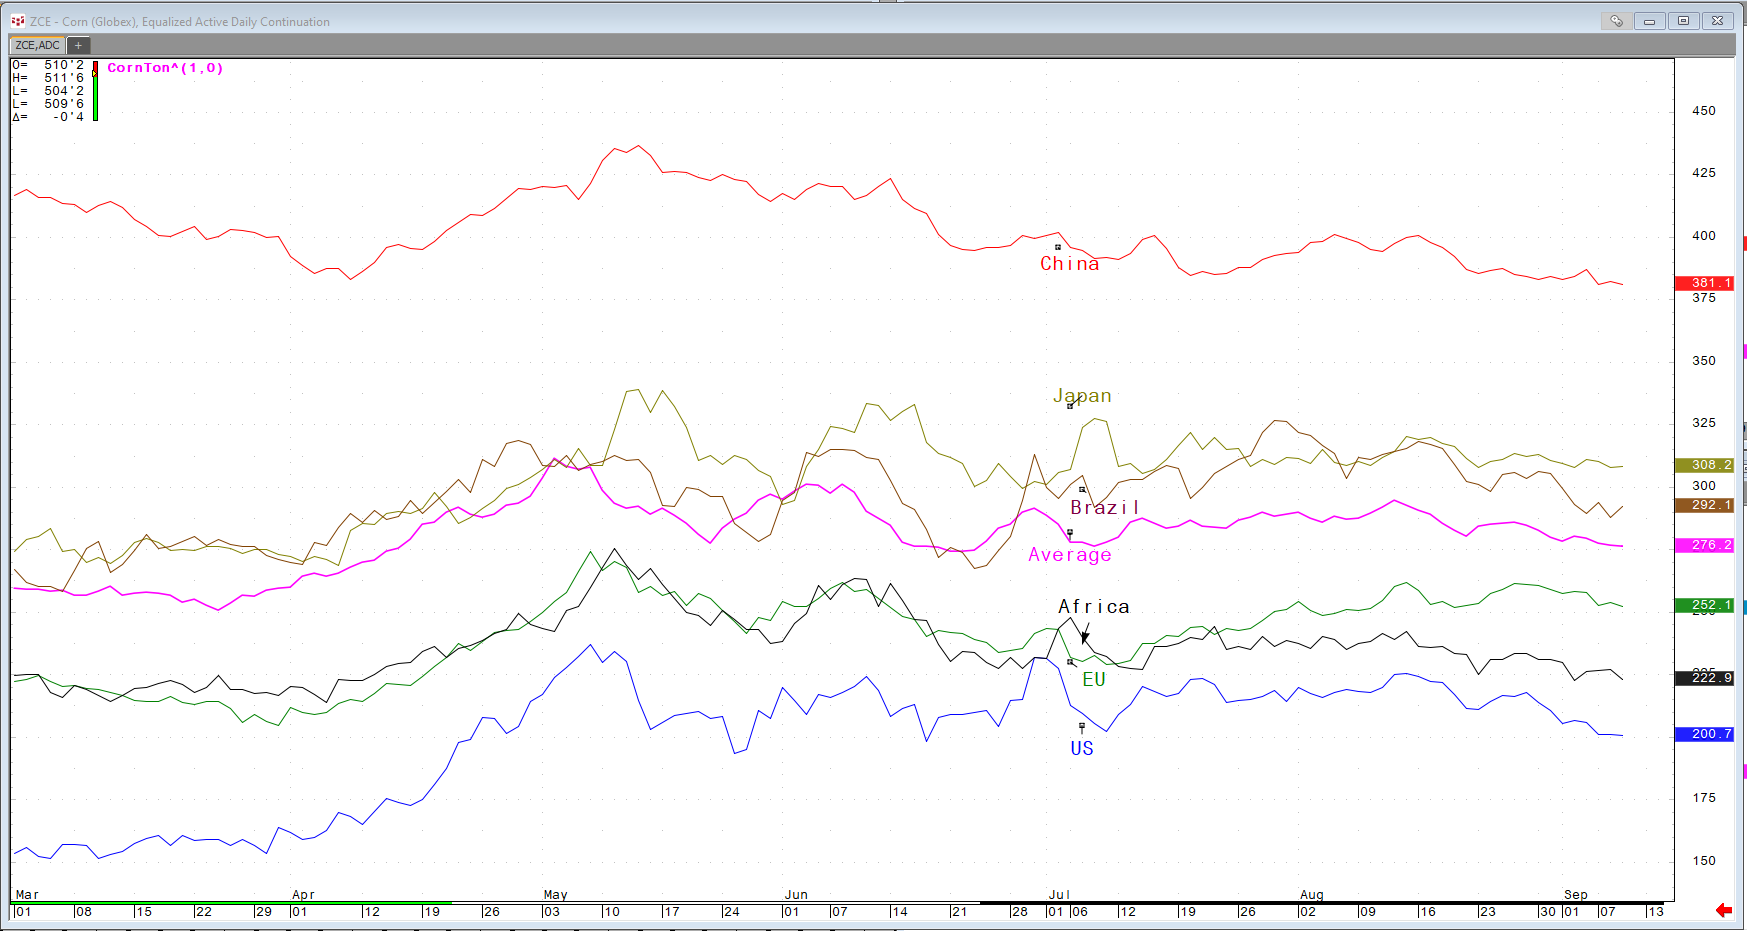
#CQGWeeklyGlobalCornRecap #cornfutures #corn
CQG Integrated Client
Get a 2-week free trial
#CQGWeeklyGlobalCornRecap #cornfutures #corn

After FEDERAL RESERVE Chairman Jerome Powell’s Jackson Hole speech, the jobs data may have taken on added significance. Inflation was not a concern for Powell as that is considered transitory… more
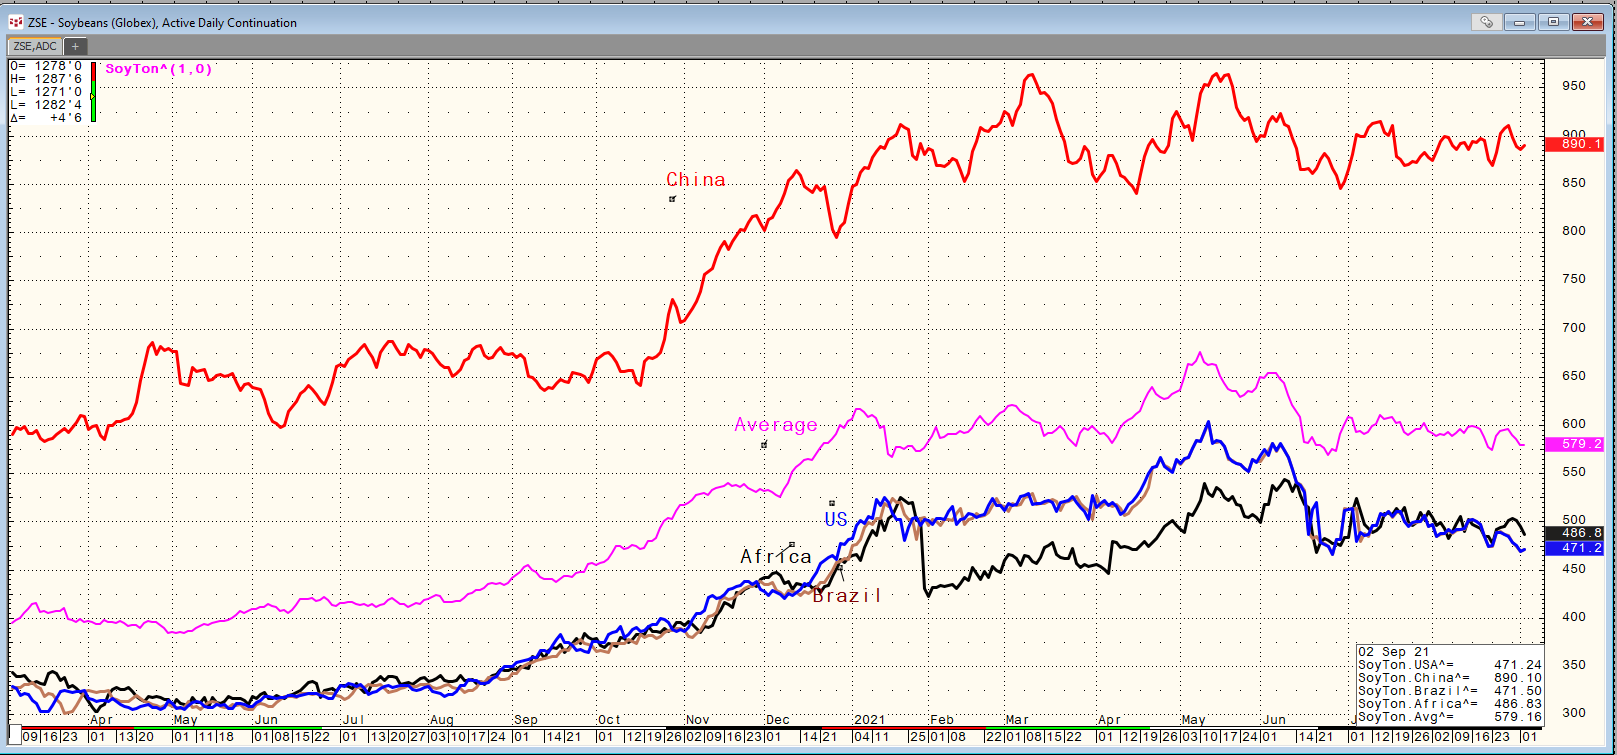
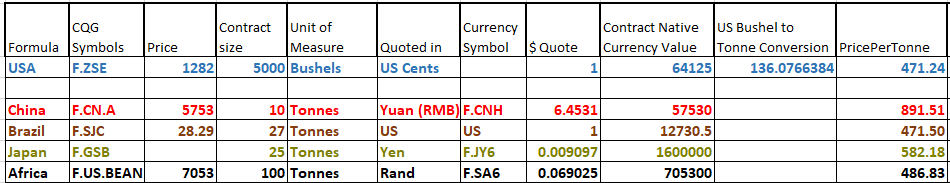
#CQGWeeklyGlobalSoybeansRecap #soybeansfutures #soybeans
#CQGWeeklyGlobalCornRecap #cornfutures #corn
#CQGWeeklyGlobalCornRecap #cornfutures #corn
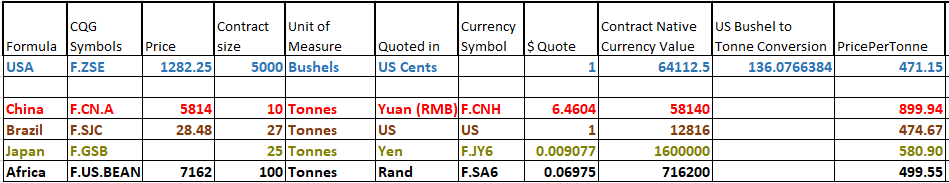
#CQGWeeklyGlobalSoybeansRecap #soybeansfutures #soybeans

Hurricane Ida, a category four storm with winds exceeding 145 MPH, made landfall last Sunday in eastern Louisiana. Most US Gulf oil production, Natural Gas production and more than 2.3 MBPD of… more
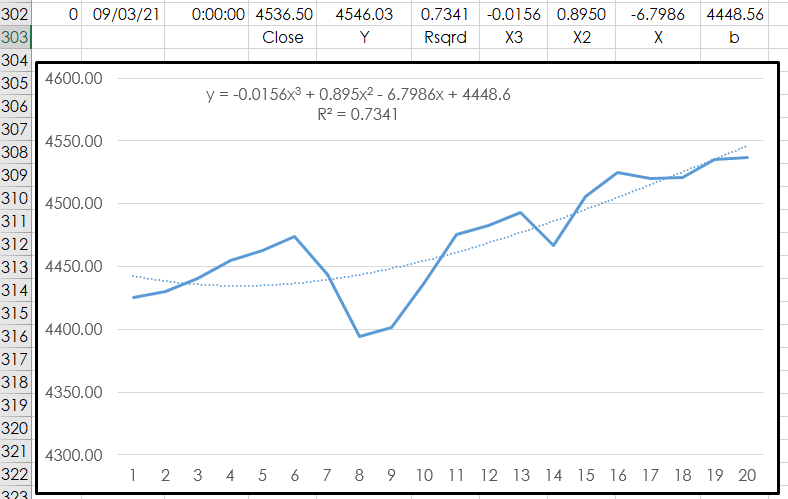
This article walks you through using Microsoft® Excel’s LINEST function to determine the three coefficients and y-intercept of a 3rd order polynomial function over the past 20 bars of closing… more
#CQGWeeklyGlobalSoybeansRecap #soybeansfutures #soybeans
#CQGWeeklyGlobalSoybeansRecap #soybeansfutures #soybeans